. 2024 Nov 1;137(21):jcs261575.
doi: 10.1242/jcs.261575. Epub 2024 Nov 6.

Mature microRNA-binding protein QKI suppresses extracellular microRNA let-7b release

Affiliations

Mature microRNA-binding protein QKI suppresses extracellular microRNA let-7b release

Kyung-Won Min et al. J Cell Sci. .

Abstract

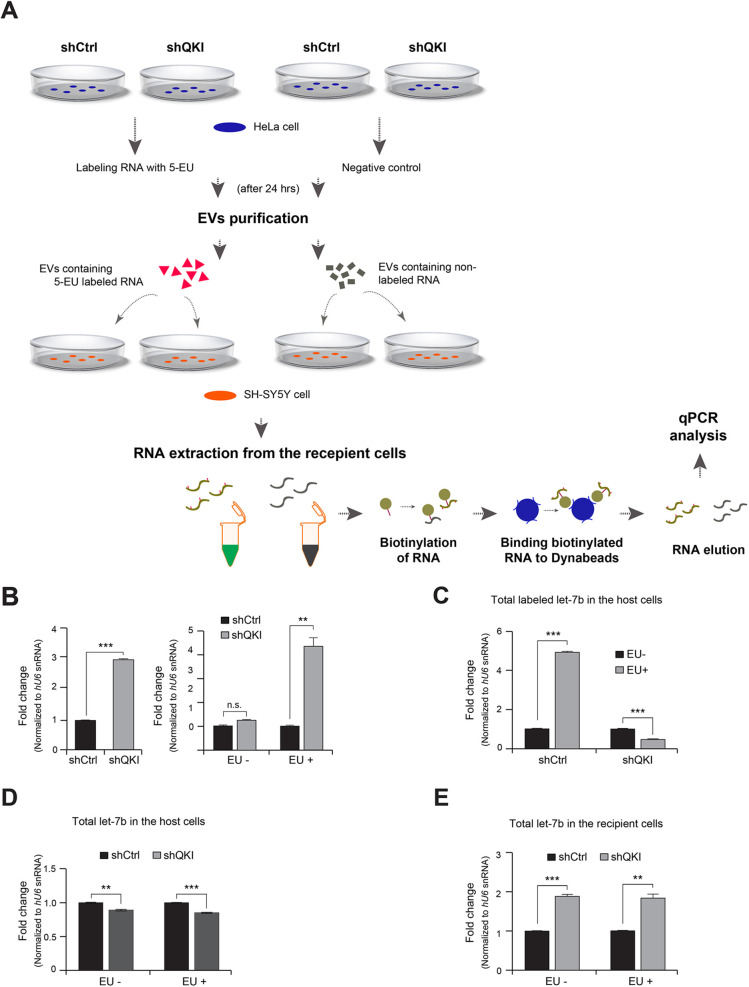
Argonaute (AGO), a component of RNA-induced silencing complexes (RISCs), is a representative RNA-binding protein (RBP) known to bind with mature microRNAs (miRNAs) and is directly involved in post-transcriptional gene silencing. However, despite the biological significance of miRNAs, the roles of other miRNA-binding proteins (miRBPs) remain unclear in the regulation of miRNA loading, dissociation from RISCs and extracellular release. In this study, we performed protein arrays to profile miRBPs and identify 118 RBPs that directly bind to miRNAs. Among those proteins, the RBP quaking (QKI) inhibits extracellular release of the mature microRNA let-7b by controlling the loading of let-7b into extracellular vesicles via additional miRBPs such as AUF1 (also known as hnRNPD) and hnRNPK. The enhanced extracellular release of let-7b after QKI depletion activates Toll-like receptor 7 (TLR7) and promotes the production of proinflammatory cytokines in recipient cells, leading to brain inflammation in the mouse cortex. Thus, this study reveals the contribution of QKI to the inhibition of brain inflammation via regulation of extracellular let-7b release.

Keywords: AGO2; Extracellular vesicular miRNA; QKI; RNA-binding protein; let-7b.


Conflict of interest statement

Competing interests The authors declare no competing or financial interests.

Figures

Fig. 1.
Fig. 1.
High-throughput protein array profiles RBPs directly binding with mature miRNAs. (A) Fluorescence images of biotinylated let-7b, miR-21 and miR-130b bound to proteins spotted on the microarray slides. (B) Venn diagram of RNA-binding proteins (RBPs) commonly identified from the protein array (>500 intensity), followed by lists of RBPs in each overlap. The intensity of let-7b, miR-21 and miR-130b were plotted using values from full-length QKI, its KH domain, full-length AGO2, the double-stranded RNA-binding (ds) domain of DROSHA and full-length GST as a negative control. Bars show mean±s.d. n=2. n.s., not significant; *P<0.05, **P<0.01; ***P<0.001 (one-tailed unpaired Student's t-test). (C) Western blot analysis of recombinant 6× histidine-tagged QKI alone or in complex with let-7b. His–QKI (23 nM or 230 nM) was incubated with let-7b at room temperature for 1 h, cross-linked with ultraviolet light (254 nm) at 150 mJ/cm2, and separated via SDS-PAGE for western blot analysis. The presence of the QKI and let-7b complex was detected by a change of electrophoretic mobility in the blot. The image is representative of three independent experiments. (D) Anisotropy analysis of recombinant QKI protein with let-7b–Cy3 (Kd=8.071±3 nM) and mutant let-7b lacking the QKI-binding sequence. Bars show mean±s.d. (E,F) Left: western blot analysis of AGO2, DICER1, QKI and ACTB using cell lysates from wild-type and AGO2 knockout (KO) HeLa cells as well as mouse embryonic fibroblasts (MEFs). The images are representative of three independent experiments. Right: ribonucleoprotein (RNP) immunoprecipitation quantitative PCR (RIP-qPCR) analysis of let-7b normalized with U6 RNA from immunopellets of IgG or anti-QKI antibody using lysates of wild-type or AGO2 KO HeLa cells as well as MEFs. Bars show mean±s.d. n=3. n.s., not significant (one-tailed unpaired Student's t-test).
Fig. 2.
Fig. 2.
QKI suppresses extracellular release of let-7b. (A,B) RT-qPCR analysis of let-7b, miR-21 and miR-130b in (A) extracellular vesicles (EVs) and (B) total RNA from HeLa cells transfected with control or QKI shRNA for 48 h. n=3. n.s., not significant; **P<0.01 (one-tailed unpaired Student's t-test). (C,D) RT-qPCR analysis of let-7b, miR-21 and miR-130b in (C) EVs and (D) total RNA from HeLa cells transfected with empty vector or Myc–QKI plasmids for 48 h. n=3. n.s., not significant; **P<0.01 (one-tailed unpaired Student's t-test). (E) Mature miRNA intensity from RNA-binding domain arrays containing hnRNPK full-length proteins and KH domains. n=2. n.s., not significant; *P<0.05; **P<0.01; ***P<0.001 (one-tailed unpaired Student's t-test). (F) Immunoblot analysis of CD63 (from EVs) and QKI, AUF1, hnRNPK, AGO2 and actin (from cell lysates) in HeLa cells transfected with shRNAs for 48 h. The images are representative of three independent experiments. (G,H) RT-qPCR analysis of let-7b in (G) EVs and (H) total RNA from HeLa cells transfected with shRNAs for 48 h. n=3. n.s., not significant; ***P<0.001 (one-tailed unpaired Student's t-test). Bars in A–E,G,H show mean±s.d.
Fig. 3.
Fig. 3.
QKI depletion activates TLR7 signaling. (A) Experimental procedure for treating the recipient cells (SH-SY5Y) with extracellular vesicles (EVs) purified from HeLa cells transfected with control or QKI shRNA. (B) Immunoblot analysis of phosphorylated (p)STAT1-S727, STAT1, TLR7 and tubulin in SH-SY5Y cells treated with EVs derived from control or QKI shRNA-transfected HeLa cells for 2 h. The images are representative of three independent experiments. (C) RT-qPCR analysis of IFNA1, IL1B, IFNB1 and TNFA mRNA levels in TLR7 shRNA-transfected SH-SY5Y cells treated with EVs derived from control or QKI shRNA-transfected HeLa cells for 2 h. Bars show mean±s.d. n=3. n.s., not significant; *P<0.05 (one-tailed unpaired Student's t-test). (D) Chromatin immunoprecipitation-quantitative PCR (ChIP-qPCR) analysis of IRF7 occupancy on its target gene IFNA1 in the EV-stimulated recipient cells. Schematic diagrams show canonical IRF7 binding sites on IFNA1 promoter region, and PCR amplicons indicated by arrows. The bar graphs show relative changes in the level of IRF7 binding on IFNA1 promoter regions normalized to input chromatin. Bars show mean±s.d. n=3. n.s., not significant; ***P<0.001 (one-tailed unpaired Student's t-test). (E) Schematic diagram of the proposed function of QKI in miRNA metabolism. miRBP, miRNA-binding protein.
Fig. 4.
Fig. 4.
Expression and function of Qki in neurons, astrocytes, microglia and oligodendrocytes of mouse cerebral cortex. (A,B) Top: immunolabeling of Qki5 (red) with NeuN, GFAP, CNPase and Iba1 (green) using sections of Nestin-CreERT2 (A) and Plp-CreERT2 (B) Qki+/+ and Qki KO mice. In CNPase-stained images, thick and thin arrows indicate Qki5-positive and -deficient oligodendrocytes. In Iba1-stained images, thick arrows indicate Qki5-positive microglia. Scale bars: 50 μm. Bottom: marker/Qki5 double-positive cells were counted with cell marker immunolabeling out of 100 Qki5-positive cells. The number of marker-stained cells out of 100 Qki5-positive cells compared with that of the control. Bars shown mean±s.d. n=3. *P<0.05; **P<0.01; ***P<0.001 (one-tailed unpaired Student's t-test). (C) Top: confocal images of immunolabeling using sections from Nestin-CreERT2 Qki+/+ and Qki KO mice with TLR7 (red) with NeuN, GFAP, CNPase, and Iba1 (green). Scale bar: 50 μm. DAPI is a marker of nucleus. In NeuN-stained images, arrows indicate NeuN/TLR7 double-positive neurons. In CNPase-stained images, arrows indicate TLR7-negative oligodendrocytes. In Iba1-stained images, arrows indicate microglia wrapping around TLR7-positive neurons. TLR7-positive cells were counted with TLR7 immunolabeling out of 100 DAPI-positive cells in Nestin-CreERT2 Qki samples. Quantitative data indicate counts of TLR7-positive cells surrounded by Iba1-positive cells among 100 DAPI-positive cells in Nestin-CreERT2 Qki samples as the inflammatory index. Bars shown mean±s.d. n=3. ***P<0.001 (one-tailed unpaired Student's t-test). (D) Western blot analysis of pSTAT1-S727 and Qki in brain sections from Qki+/+ and Qki−/− mice. Images are representative of three independent sections. (E) RT-qPCR analysis of let-7b, miR-21 and miR-130b in blood extracellular vesicles (EVs) from Qki+/+ and Qki KO mice. Bars shown mean±s.d. n=3. **P<0.01 (one-tailed unpaired Student's t-test).
Fig. 5.
Fig. 5.
Tracking of let-7b transfer from host HeLa to recipient SH-SY5Y cells. (A) Schematic diagram of the experimental design for tracking the labeled let-7b originating from QKI-deficient or control donor cells to the recipient cells via extracellular vesicles (EVs). Donor cells were grown in the presence of 5-EU to label newly synthesized RNA transcripts. EVs from the donor cells were isolated and applied to the recipient cells grown under standard conditions without 5-EU labeling. After 6 h, EV-treated or untreated cells were lysed and the presence of labeled or unlabeled let-7b was determined by RT-qPCR. (B) Tracking of labeled let-7b derived from control or QKI shRNA-transfected cells (HeLa) to recipient cells (SH-SY5Y). Total RNA was extracted from the EV-treated recipient cells; then, 5-EU-labeled RNA in the pool of total RNA was precipitated and biotinylated. The presence of labeled let-7b was determined by qPCR normalized with U6 snRNA. n=3. n.s., not significant; **P<0.01; ***P<0.001 (one-tailed unpaired Student's t-test). (C,D) Analysis of total let-7b in the host HeLa cells. n=2. **P<0.01; ***P<0.001 (one-tailed unpaired Student's t-test). (E) Analysis of total let-7b in the recipient SH-SY5Y cells stimulated with EVs purified from either control or QKI-depleted HeLa cells. n=2. **P<0.01; ***P<0.001 (one-tailed unpaired Student's t-test). Bars in B–E show±s.d.

References

    1. Arroyo, J. D., Chevillet, J. R., Kroh, E. M., Ruf, I. K., Pritchard, C. C., Gibson, D. F., Mitchell, P. S., Bennett, C. F., Pogosova-Agadjanyan, E. L., Stirewalt, D. L.et al. (2011). Argonaute2 complexes carry a population of circulating microRNAs independent of vesicles in human plasma. Proc. Natl. Acad. Sci. USA 108, 5003-5008. 10.1073/pnas.1019055108 - DOI - PMC - PubMed
    1. Asangani, I. A., Rasheed, S. A. K., Nikolova, D. A., Leupold, J. H., Colburn, N. H., Post, S. and Allgayer, H. (2008). MicroRNA-21 (miR-21) post-transcriptionally downregulates tumor suppressor Pdcd4 and stimulates invasion, intravasation and metastasis in colorectal cancer. Oncogene 27, 2128-2136. 10.1038/sj.onc.1210856 - DOI - PubMed
    1. Bagga, S., Bracht, J., Hunter, S., Massirer, K., Holtz, J., Eachus, R. and Pasquinelli, A. E. (2005). Regulation by let-7 and lin-4 miRNAs results in target mRNA degradation. Cell 22, 553-563. 10.1016/j.cell.2005.07.031 - DOI - PubMed
    1. Bailey, T. L., Boden, M., Buske, F. A., Frith, M., Grant, C. E., Clementi, L., Ren, J., Li, W. W. and Noble, W. S. (2009). MEME SUITE: tools for motif discovery and searching. Nucleic Acids Res. 37(suppl_2), W202-W208. 10.1093/nar/gkp335 - DOI - PMC - PubMed
    1. Behm-Ansmant, I., Rehwinkel, J., Doerks, T., Stark, A. and Bork, P. and Izaurralde E. (2006). mRNA degradation by miRNAs and GW182 requires both CCR4:NOT deadenylase and DCP1:DCP2 decapping complexes. Genes Dev. 20, 1885-98. 10.1101/gad.1424106 - DOI - PMC - PubMed

MeSH terms

LinkOut - more resources