

From coral reefs into the abyss: the evolution of corallivory in the Coralliophilinae (Neogastropoda, Muricidae)
- PMID: 39308990
- PMCID: PMC11413129
- DOI: 10.1007/s00338-024-02537-1
From coral reefs into the abyss: the evolution of corallivory in the Coralliophilinae (Neogastropoda, Muricidae)
Abstract
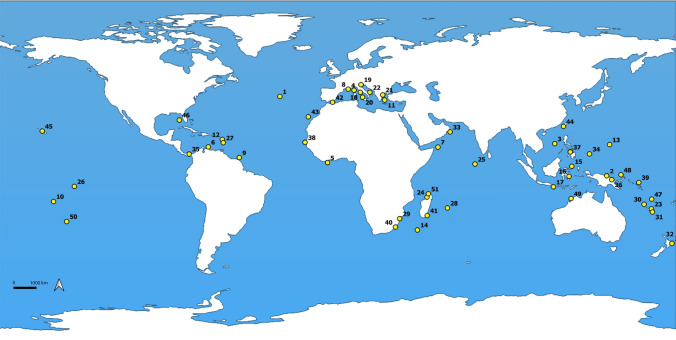
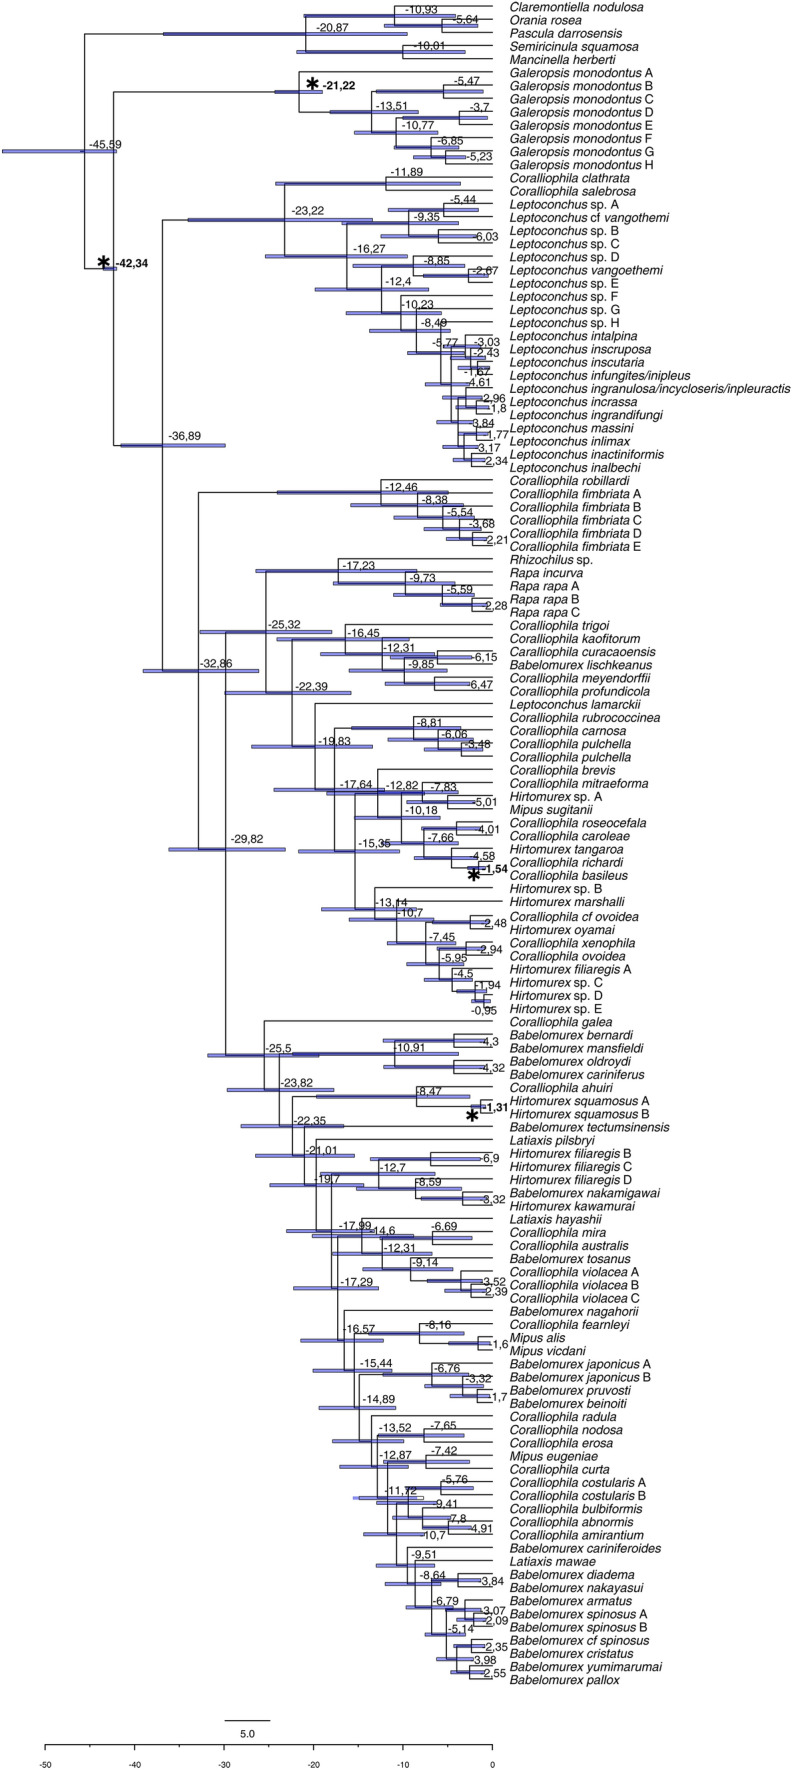
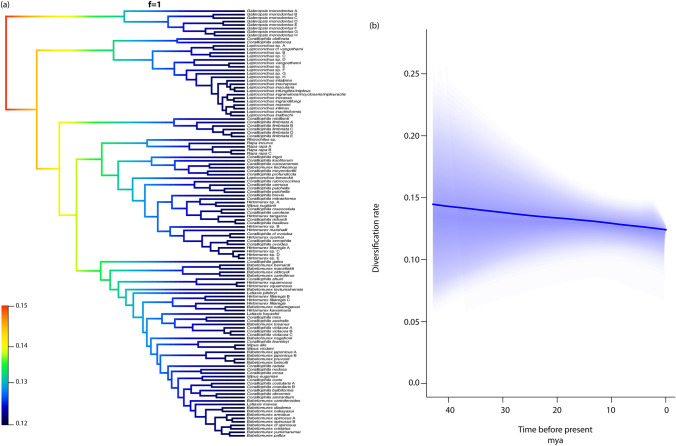
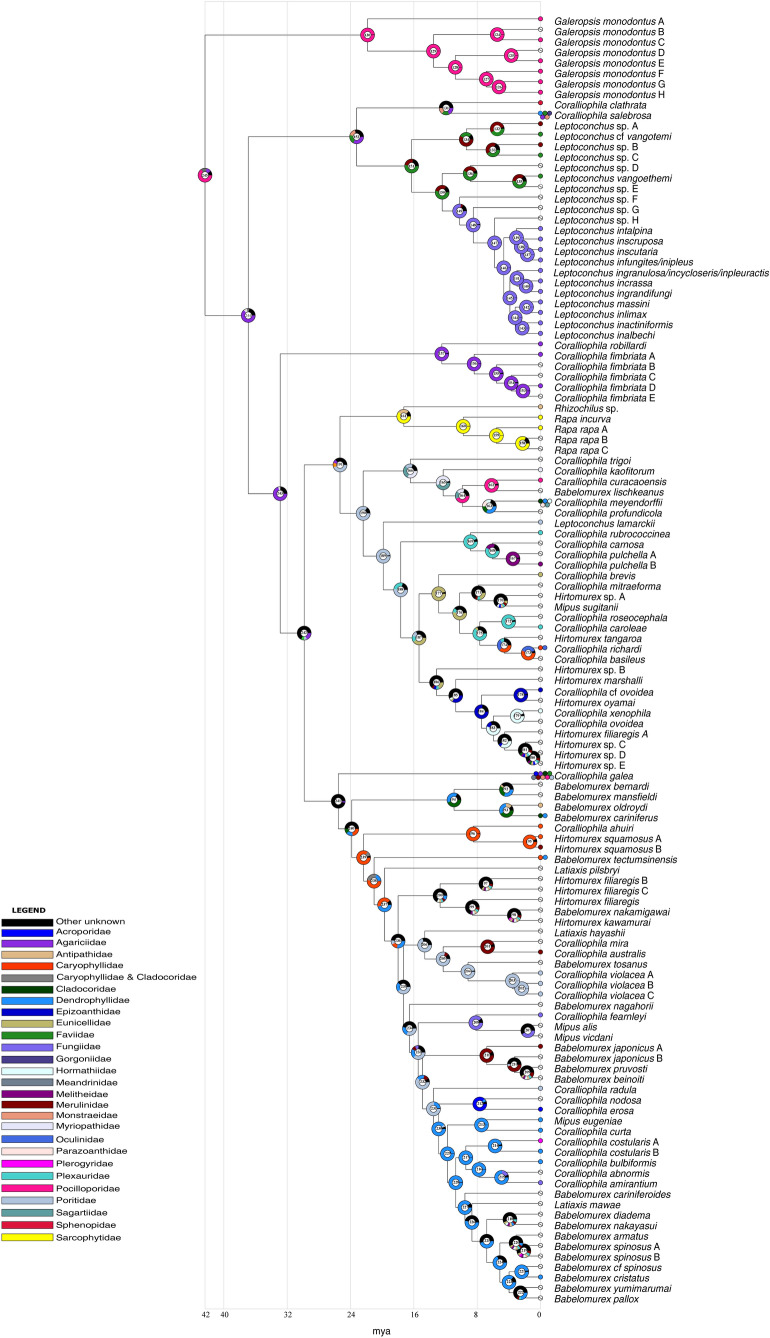
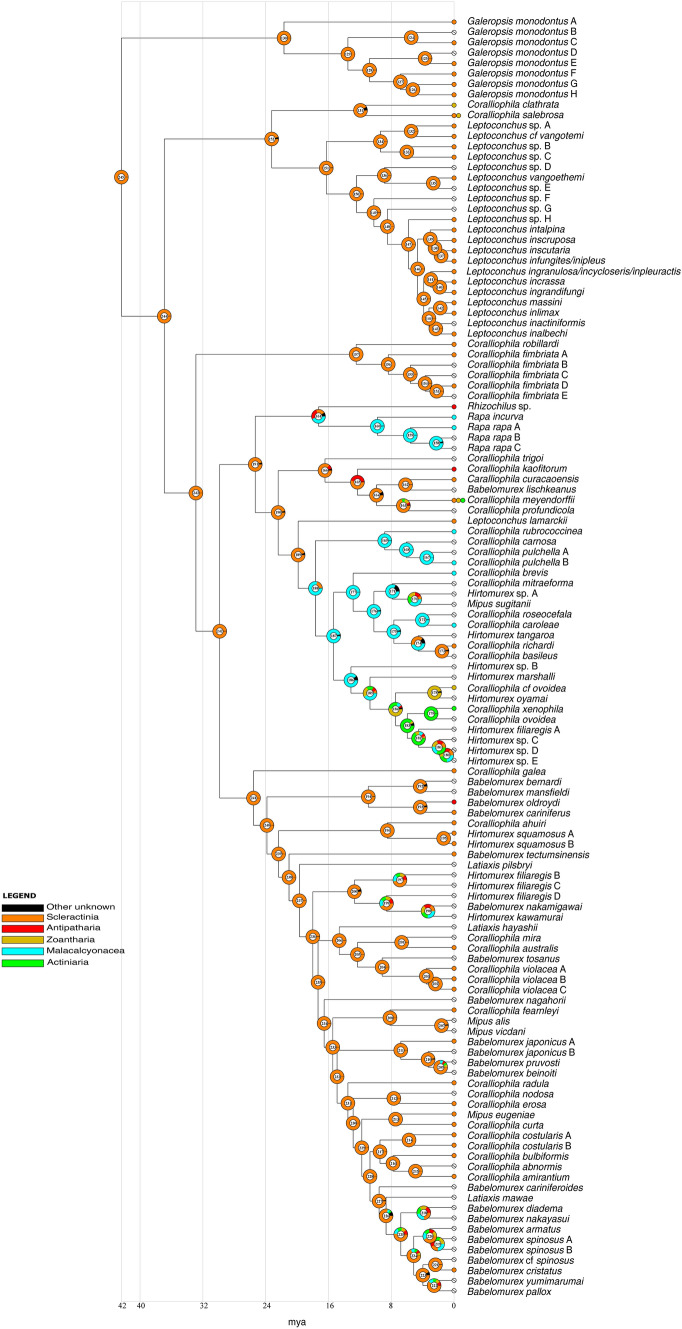
In this study, we delved into the interaction between corallivorous marine gastropods, the muricid Coralliophilinae Chenu, 1859, and their cnidarian food targets. Coralliophilinae is a subfamily of specialised corallivorous caenogastropods that feed by browsing on octocorals or hexacorals. Only sparse information is available on the phylogenetic relationships and the degree of specificity of the trophic relationships within this corallivorous lineage. To address these gaps, we generated the largest molecular dataset to date, comprising two mitochondrial (cox1 and 16S rDNA) and one nuclear gene (ITS2 rDNA) from 586 specimens collected worldwide. The coral hosts of coralliophilines were identified through an integrative approach, combining literature data with new records, employing morphological and/or molecular markers, and incorporating data from DNA barcoding of the snail stomach content. Our comprehensive approach unveiled the existence of numerous cryptic species in Coralliophilinae, while the phylogeny showed that most of the currently accepted genera are not monophyletic. The molecular dating confirmed the origin of the Coralliophilinae in Middle Eocene, with diversification of most lineages during the Miocene. Our results indicate that the subfamily's ancestor evolved in shallow waters in association with Scleractinia. Through the evolutionary history of Coralliophilinae, multiple host shifts to other cnidarian orders were observed, not correlated with changes in the depth range. The results of diversification analyses within the subfamily further suggest that the association with the host has influenced the evolutionary patterns of Coralliophilinae, but not vice versa.
Supplementary information: The online version contains supplementary material available at 10.1007/s00338-024-02537-1.
Keywords: Cnidaria; Coevolution; Corallivory; Gastropods; Host–parasite interactions; Molecular phylogeny.
© The Author(s) 2024.
Conflict of interest statement
Conflict of interestThe authors certify that they have NO affiliations with or involvement in any organisation or entity with any financial interest, or non-financial interest in the subject matter or materials discussed in this manuscript.
Figures


References
-
- Abdelkrim J, Aznar-Cormano L, Fedosov AE, Kantor YI et al (2018) Exon-Capture-Based Phylogeny and Diversification of the Venomous Gastropods (Neogastropoda, Conoidea). Mol Biol Evol 35:2355–2374 - PubMed
-
- Cernohorsky WO (1980) The Taxonomy of Some Indo-Pacific Mollusca: PART 7. Rec Auckland Inst Mus 16:171–187
-
- Davison A (2006) The ovotestis: an underdeveloped organ of evolution. BioEssays 28:642–650 - PubMed
-
- Dockery DT III (1986) Punctuated succession of Paleogene mollusks in the northern Gulf Coastal Plain. Palaios 1(6):582–589
-
- Fabricius K, Alderslade P (2001) Soft corals and sea fans: a comprehensive guide to the tropical 731 shallow-water genera of the Central-West Pacific, the Indian Ocean and the Red Sea. Australian Institute of Marine Science, Townsville, Queensland, Australia, 204 pp
LinkOut - more resources
Full Text Sources
Research Materials