. 2024 Sep 12;15(39):16291-16299.
doi: 10.1039/d4sc03387f. Online ahead of print.

Fluorescence-plane polarization for the real-time monitoring of transferase migration in living cells

Affiliations

Fluorescence-plane polarization for the real-time monitoring of transferase migration in living cells

Yafu Wang et al. Chem Sci. .

Abstract

Transferases are enzymes that exhibit multisite migration characteristics. Significantly, enzyme activity undergoes changes during this migration process, which inevitably impacts the physiological function of living organisms and can even lead to related malignant diseases. However, research in this field has been severely hindered by the lack of tools for the simultaneous and differential monitoring of site-specific transferase activity. Herein, we propose a novel strategy that integrates a fluorescence signal response with high sensitivity and an optical rotation signal response with superior spatial resolution. To validate the feasibility of this strategy, transferase γ-glutamyltransferase (GGT) was used as a model system to develop dual-mode chiral probes ACx-GGTB (AC17-GGTB and AC15-GGTB) using chiral amino acids as specific bifunctional recognition groups. The probes undergo structural changes under GGT, resulting in the release of bifunctional recognition groups (chiral amino acids) and simultaneously generate fluorescence signals and optical rotation signals. This dual-mode output exhibits high sensitivity and facilitates differentiation of sites. Furthermore, it enables simultaneous and differential detection of GGT activity at different sites during migration. We anticipate that probes developed based on this strategy will facilitate imaging-based monitoring of the activity for other transferases, thus providing an imaging platform suitable for the real-time tracking of transferase activity changes during migration.


Conflict of interest statement

There are no conflicts to declare.

Figures
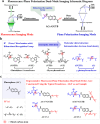
Fig. 1
Fig. 1. (a) Schematic for fluorescence-plane polarization dual-mode imaging and the corresponding molecular skeleton of chiral probes. (b) Bifunctional recognition groups for different kinds of transferases (R1). They are chiral amino acids and named Tran. Among them, GSTB and GST for glutathione S-transferase, GTB and GT for glycosyltransferase, GGTB and G for γ-glutamyltransferase. (c) Fluorescent-plane polarization dual-mode probes for typical transferase-GGT. AC, fluorophore. R2, alkyl chain groups to adjust the water–oil amphiphilicity of the probes. The red glows indicate the chiral carbon atom.
Fig. 2
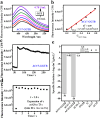
Fig. 2. Response of ACx-GGTB (15 μM) for GGT activity in PBS (pH = 7.4). (a) Emission spectrum of AC17-GGTB for GGT activity (0–0.78 U mL−1, λex = 325 nm). (b) Linear response of AC17-GGTB for GGT activity in the emission spectrum (a) (I422nm = 3.7 × 10⁵ + 6.1 × 10⁵ GGT (R2 = 0.99)). (c) Dynamic response of AC17-GGTB for GGT activity (0.39 U mL−1). (d) Local expansion of (c) (63 s in (c) was taken as 0 s). (e) Specific rotation ([α]λt) of ACx-GGTB (1.5 g/100 mL) and its metabolites (1.5 g/100 mL) at 25 °C in dichloromethane. Data are representative of replicate experiments (n = 5).
Fig. 3
Fig. 3. Changes of probe structure under the action of GGT.
Fig. 4
Fig. 4. LC-MS/MS analysis of the transfer and recognition process of AC17-GGTB in living HepG2 cells. a, LC-MS/MS analysis of the migration and recognition process of AC17-GGTB in cells. (b) Expansion of the blue area of (a). Incubation concentration: 20 μM. Incubation time: 0.5 h, 4.0 h.
Fig. 5
Fig. 5. Schematic for the structural changes and site migration of the probe in cells. The structure of the probes changes gradually in the cell, which leads to the transfer from the cytomembrane to the ER.
Fig. 6
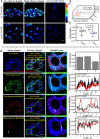
Fig. 6. Fluorescence imaging of AC17-GGTB in HepG2 cells. (a) One/two-photon fluorescence imaging in HepG2 cells. Single-photon excitation wavelength = 405 nm, two-photon excitation wavelength = 800 nm, scan range = 420–460 nm. Incubation concentration: 20 μM. Incubation time: 3.0 h. ACx-GGTB + DON: the cells were first incubated with the inhibitor DON (1.0 mM) for 1.0 h, and then incubated with the ACx-GGTB (20 μM) for 3.0 h. (b) The high throughput date statistics of the blue channel in the two-photon channel. 1, AC17-GGTB; 2, AC15-GGTB. (c) The total intensity data in the two-photon channel. (d) Colocalization imaging of AC17-GGTB in HepG2 cells. AC17-GGTB: incubation time: 3.0 h, excitation wavelength = 405 nm, scan range = 420–460 nm (Blue Channel); ER-Tracker Green: endoplasmic reticulum commercial probe, incubation time: 0.5 h, excitation wavelength = 488 nm, scan range = 505–555 nm (Green Channel); LysoTracker Red DND-99: lysosome commercial probe, incubation time: 0.5 h, excitation wavelength = 559 nm, scan range = 580–630 nm (Red Channel); DiD Perchlorate (DiIC18(5)): cell membrane commercial probe, incubation time: 0.5 h, excitation wavelength = 635 nm, scan range = 650–700 nm (Red Channel). Overlay Channel: fitting diagram of the four channels. Internal PMTs are at 16 bit and 1600 × 1600 pixels, and scan speed is 400 Hz. Scan: 10 μm.
Fig. 7
Fig. 7. Plane polarization imaging in model cells. (a) Plane polarization imaging of probe AC17-GGTB and the enzyme metabolites and PBS (pH = 7.4, control) in model cells. (b) The expansion of the green area in (a). (c) Optical rotation signal intensity data statistics in (a). (d) Optical rotation signal intensity data statistics of the marked sites in (b). [α]λt, optical activity of the probe and its metabolites; 1, 2, markers in (b). Incubation concentration: 20 μM. Incubation time: 3.0 h. Scan: 50 mm.
Fig. 8
Fig. 8. Fluorescence-plane polarization dual-mode imaging in HepG2 cells. (a) Fluorescence plane polarization dual-mode imaging of AC17-GGTB for GGT activity in HepG2 cells. (b) and (c) The fluorescence (b) and optical rotation (c) signal intensity data statistics of the marker sites in (a). Two-photon excitation wavelength = 800 nm, scan range = 420–460 nm (blue channel). Incubation concentration: 20 μM. Scan in fluorescence imaging: 10 μm. Scan in polarization imaging: 10 mm.

Similar articles

Cited by

References

    1. Abdelraheem E. Thair B. Varela R. F. Jockmann E. Popadić D. Hailes H. C. Ward J. M. Iribarren A. M. Lewkowicz E. S. Andexer J. N. Hagedoorn P. L. Hanefeld U. ChemBioChem. 2022;23(18):e202200212. doi: 10.1002/cbic.202200212. - DOI - PMC - PubMed
    1. Zakharia K. Klair S. J. Murali R. A. Dig. Dis. 2019;37(6):518. doi: 10.1159/000499874. - DOI - PubMed
    1. Carolina R. S. Luis E. M. M. Andrés B. P. Beatriz K. D. Montserrat L. C. Sobeida S. N. Front. Mol. Biosci. 2021;8:701975. doi: 10.3389/fmolb.2021.701975. - DOI - PMC - PubMed
    1. Nagy L. Márton J. Vida A. Kis G. Bokor É. Kun S. Gönczi M. Docsa T. Tóth A. Antal M. Gergely P. Csóka B. Pacher P. Somsák L. Bai P. Br. J. Pharmacol. 2018;175:301. doi: 10.1111/bph.13819. - DOI - PMC - PubMed
    1. Shekhawat J. Gauba K. Gupta S. Choudhury B. Purohit P. Sharma P. Banerjee M. J. Cancer Res. Clin. 2021;147:1869. doi: 10.1007/s00432-021-03641-3. - DOI - PMC - PubMed

LinkOut - more resources