. 2024 Aug 20;32(4):101323.
doi: 10.1016/j.omtm.2024.101323. eCollection 2024 Dec 12.

Lentiviral vectors for precise expression to treat X-linked lymphoproliferative disease

Affiliations

Lentiviral vectors for precise expression to treat X-linked lymphoproliferative disease

Paul G Ayoub et al. Mol Ther Methods Clin Dev. .

Abstract

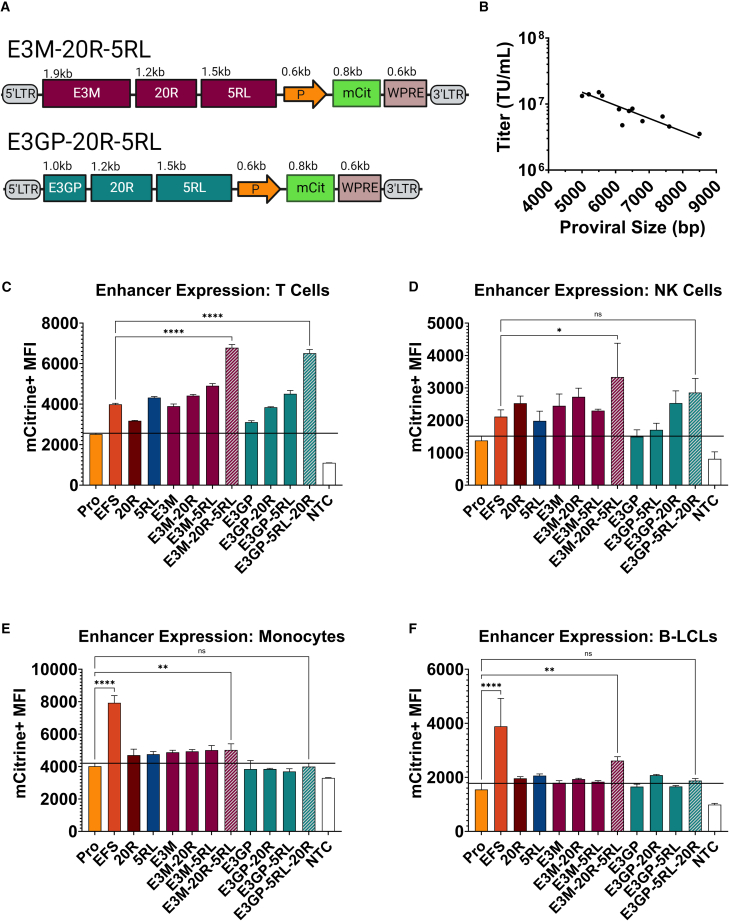
X-linked lymphoproliferative disease (XLP1) results from SH2D1A gene mutations affecting the SLAM-associated protein (SAP). A regulated lentiviral vector (LV), XLP-SMART LV, designed to express SAP at therapeutic levels in T, NK, and NKT cells, is crucial for effective gene therapy. We experimentally identified 34 genomic regulatory elements of the SH2D1A gene and designed XLP-SMART LVs to emulate the lineage and stage-specific control of SAP. We screened them for their on-target enhancer activity in T, NK, and NKT cells and their off-target enhancer activity in B cell and myeloid populations. In combination, three enhancer elements increased SAP promoter expression up to 4-fold in on-target populations in vitro. NSG-Tg(Hu-IL15) xenograft studies with XLP-SMART LVs demonstrated up to 7-fold greater expression in on-target cells over a control EFS-LV, with no off-target expression. The XLP-SMART LVs exhibited stage-specific T and NK cell expression in peripheral blood, bone marrow, spleen, and thymic tissues (mimicking expression patterns of SAP). Transduction of XLP1 patient CD8+ T cells or BM CD34+ cells with XLP-SMART LVs restored restimulation-induced cell death and NK cytotoxicity to wild-type levels, respectively. These data demonstrate that it is feasible to create a lineage and stage-specific LV to restore the XLP1 phenotype by gene therapy.

Keywords: HSC; SAP; SH2D1A; XLP; enhancer; gene therapy; lentiviral vector; regulated; stem cell.


Conflict of interest statement

The authors declare no competing interests.

Figures

None
Graphical abstract
Figure 1
Figure 1
Functional Characterization and Optimization of SH2D1A Enhancers Across T, NK, and B Cell Lineages (A) UCSC Genome Browser interface of the SH2D1A locus encoding the SAP protein. Blue shaded columns indicate putative regulatory regions. Distinctive DNase I hypersensitive sites (DHSs) are shown across different cell lineages. Transcription factor (TF) binding, along with peaks of bound H3K4me1, H3K27ac, and DHSs can be used to define the presence and boundaries of putative enhancer elements. Proviral maps of a series of XLP1 “SMART” lentiviral vector constructs each contain a putative regulatory element upstream of the endogenous SH2D1A promoter (SH2D1A Pro) that drive expression of an mCitrine (mCit) reporter cassette. A unique barcode (BC) is located upstream of the woodchuck hepatitis virus post-transcriptional regulatory element (WPRE) to identify the ability for each element to drive lineage and stage specific expression of the mCit reporter. We transduced primary T, NKT, and NK cells with a pool of raw viral supernatant containing each of the 34 candidate XLP-SMART LVs, in duplicate with different BC, and the EFS-SAP vector as control. B-LCLs were transduced to measure off-target expression in the B lymphocyte lineage. Fourteen days post-transduction, cells were harvested for their gDNA and RNA fractions to measure BC expression and presence in gDNA via next-generation sequencing. (B) Relative SH2D1A enhancer activity of the highest-expressing elements. The relative enhancer expression measured by next-generation sequencing of vector barcodes is shown. The highest-expressing 5 enhancers are depicted (see supplemental figures for the remaining 29), with the lowest level of expression (white) denoted as that of the SH2D1A promoter only (Pro). Elements of interest contain increased expression over the SH2D1A Pro (red). Minimal = 1- to 1.25-fold increase; low = 1.25- to 1.5-fold increase; medium = 1.5- to 2-fold increase; high = >2-fold increase. (C) Proviral size of refined XLP-SMART LV versus titer. Putative enhancers were cloned into the plasmid backbone of a lentiviral vector (pCCL-c-MNDU3-X [Addgene, plasmid no. 81071]) with the MNDU3 promoter first removed, and the vectors were packaged and titered head-to-head. The quantities of infectious particles were plotted as a function of proviral length (bp). Each point in the plot represents an average of three individual 10-cm plates of virus titered on HT-29 cells. Proviral length is defined as sequence length from the beginning of the 5′ long terminal repeat (LTR) U3 through the end of the 3′ LTR U5. n = 3 per arm. Linear regression analyses were used to determine the correlation between titer and proviral size (R2 = 0.78). (D and E) Expression from LV with refined enhancer elements (via GFP mean fluorescence intensity [MFI]) in T and NK cells. Healthy donor CD3+ T cells or CD56+ NK cells were isolated from peripheral blood mononuclear cells (PBMCs). CD3+ T cells and CD56+ NK cells were transduced with each XLP-SMART LV to achieve a VCN ranging from 0.1 to 0.2. 14 days post-transduction (based on pre-determined titers), T cells were assessed for relative expression driven by each enhancer via mCitrine+ MFI using flow cytometry. Each enhancer was compared with basal SH2D1A promoter-driven expression (Pro) and the control LV (EFS). Data are represented as mean ± SD of biological triplicates from two experiments. Statistical significance was analyzed using a one-way ANOVA followed by multiple paired comparisons for normally distributed data (Tukey test). Statistical analysis was performed on all arms, but selected arms are shown. All statistical tests were two-tailed and a p value of <0.05 was deemed significant (ns, non-significant; ∗p < 0.05, ∗∗p < 0.01, ∗∗∗p < 0.001, ∗∗∗∗p < 0.0001).
Figure 2
Figure 2
In Vitro Characterization of Composite XLP1-SMART Lentiviral Vectors: Proviral Size, Titer, and Cell Lineage-Specific Expression (A) Schematic of composite XLP1-SMART lentiviral vectors. Diagrams of the two XLP-SMART LV composite constructs are shown with their sequence lengths (kb). 5′ LTR and 3′ LTR designate the 5' and 3′ viral long terminal repeats (LTRs), respectively; E3M, E3GP, 20R, and 5RL are SH2D1A enhancer elements; P designates the SH2D1A promoter; mCit, mCitrine reporter cassette; WPRE, woodchuck hepatitis virus post-transcriptional regulatory element. (B) Proviral size of composite XLP-SMART LVs versus titer. Enhancers were cloned into the plasmid backbone of a therapeutic lentiviral vector (pCCL-c-MNDU3-X [Addgene, plasmid no. 81071]) (with the MNDU3 promoter removed), packaged, and titered head-to-head. The quantities of infectious particles were plotted as a function of proviral length (bp). Each point in the plot represents an average of three individual 10-cm plates of virus titered on HT-29 cells. Proviral length is defined as sequence length from the beginning of the 5′ long terminal repeat (LTR) U3 through the end of the 3′ LTR U5. n = 3 per arm. Linear regression analyses were used to determine the correlation between titer and proviral size (R2 = 0.79). (C) On-target expression in T cells in vitro of composite XLP-SMART LVs. Healthy donor CD3+ T cells were isolated from PBMCs. CD3+ T cells were transduced with each XLP-SMART LV to achieve a VCN ranging from 0.1 to 0.2. At 14 days post-transduction, T cells were assessed for the relative expression driven by each enhancer via mCitrine+ MFI using flow cytometry. Each enhancer was compared with basal SH2D1A promoter expression (Pro), the control LV (EFS), and a non-transduced control (NTC). Data are represented as mean ± SD of biological triplicates from three experiments. Statistical significance was analyzed using a one-way ANOVA followed by multiple paired comparisons for normally distributed data (Tukey test). Statistical analysis was performed on all arms, but selected arms are shown. All statistical tests were two-tailed and a p value of <0.05 was deemed significant (ns, non-significant; ∗p < 0.05, ∗∗p < 0.01, ∗∗∗p < 0.001, ∗∗∗∗p < 0.0001). (D) On-target expression in NK cells in vitro of composite XLP-SMART LVs. Healthy donor CD56+ NK cells were isolated from PBMCs. CD56+ NK Cells were transduced with each XLP-SMART LV to achieve a VCN ranging from 0.1 to 0.2. At 14 days post-transduction, NK cells were assessed for the relative expression driven by each enhancer via mCitrine+ MFI using flow cytometry. Each enhancer was compared with basal SH2D1A promoter expression (Pro) and the control LV (EFS). Data are represented as mean ± SD of biological triplicates from three experiments. Statistical significance was analyzed using a one-way ANOVA followed by multiple paired comparisons for normally distributed data (Tukey test). Statistical analysis was performed on all arms, but selected arms are shown. All statistical tests were two-tailed and a p value of <0.05 was deemed significant (ns, non-significant; ∗p < 0.05, ∗∗p < 0.01, ∗∗∗p < 0.001, ∗∗∗∗p < 0.0001). (E) Off-target expression in CB CD34+ differentiated monocytes cells by composite XLP-SMART LVs. Healthy donor CB CD34+ cells were differentiated into monocytes as described. Prior to differentiation, CB CD34+ cells were transduced with each XLP-SMART LV to achieve a VCN ranging from 0.1 to 0.2. At 14 days post-transduction and differentiation, CD14+CD16+ monocytes were assessed for the relative expression driven by each enhancer via mCitrine+ MFI using flow cytometry. Each enhancer was compared with basal SH2D1A promoter expression (Pro) and the control LV (EFS). Data are represented as mean ± SD of biological triplicates from one experiment. Statistical significance was analyzed using a one-way ANOVA followed by multiple paired comparisons for normally distributed data (Tukey test). Statistical analysis was performed on all arms, but selected arms are shown. All statistical tests were two-tailed and a p value of <0.05 was deemed significant (ns, non-significant; ∗p < 0.05, ∗∗p < 0.01, ∗∗∗p < 0.001, ∗∗∗∗p < 0.0001). (F) Off-target expression in B-LCLs by composite XLP-SMART LVs. B-LCLs, cultured in R10, were transduced with each XLP-SMART LV to achieve a VCN ranging from 0.1 to 0.2. At 14 days post-transduction, B-LCLs were assessed for the relative expression driven by each enhancer via mCitrine+ MFI using flow cytometry. Each enhancer was compared with basal SH2D1A promoter expression (Pro) and the control LV (EFS). Data are represented as mean ± SD of biological triplicates from three experiments. Statistical significance was analyzed using a one-way ANOVA followed by multiple paired comparisons for normally distributed data (Tukey test). Statistical analysis was performed on all arms, but selected arms are shown. All statistical tests were two-tailed and a p value of <0.05 was deemed significant (ns, non-significant; ∗p < 0.05, ∗∗p < 0.01, ∗∗∗p < 0.001, ∗∗∗∗p < 0.0001).
Figure 3
Figure 3
Lineage-Specific Expression of XLP-SMART Lentiviral Vectors in NSG-Tg(Hu-IL15) Mice (A) Vector copy number 16 weeks post-transplant from NSG-Tg(Hu-IL15) mouse bone marrow (BM). Whole BM was taken from each mouse at time of euthanasia and processed into a single-cell suspension. Genomic DNA was extracted from the BM suspension and analyzed for vector copy number by ddPCR. n = 4, mock; n = 5, promoter only (Pro); n = 3, EFS-mCitrine (EFS); n = 4, E3M-20R-5RL-mCitrine (3M); n = 3, E3GP-20R-5RL-mCitrine (3GP). Data are represented as mean ± SD of biological replicates from one experiment. (B) Engraftment 16 weeks post-transplant from NSG-Tg(Hu-IL15) mouse BM. Whole BM was taken from each mouse at time of euthanasia and analyzed for engraftment by flow cytometry using an anti-hCD45 antibody. n = 5, Mock; n = 5, promoter only (Pro); n = 3, EFS-mCitrine (EFS); n = 4, E3M-20R-5RL-mCitrine (3M); n = 4, E3GP-20R-5RL-mCitrine (3GP). (C) On-target XLP-SMART LV expression in peripheral blood 16 weeks post-transplant in NSG-Tg(Hu-IL15) mice. Mice were bled at 16 weeks post-transplant to analyze peripheral blood for XLP-SMART LV expression. Lysed red blood cells were stained for various on-target lineages within the hCD45+ gate (T cells: hCD33–, hCD19–, hCD3+; NK cells: hCD33-, hCD3-, hCD19-, hCD56+; NKT cells: hCD33-, hCD19-, hCD3+, hCD56+; and iNKT cells: hCD33–, hCD19–, hCD3+, hCD56+, hVα24+). Each LV’s relative expression was measured in on-target lineages via mCitrine+ MFI using flow cytometry. Each enhancer was compared with basal SH2D1A promoter-driven expression (Pro) and the control LV (EFS). Data are represented as mean ± SD of biological triplicates from one experiment. Statistical significance was analyzed using a two-way ANOVA followed by multiple paired comparisons for normally distributed data (Tukey test). Statistical analysis was performed on all arms, but selected arms are shown. All statistical tests were two-tailed and a p value of <0.05 was deemed significant (ns, non-significant; ∗p < 0.05, ∗∗p < 0.01, ∗∗∗p < 0.001, ∗∗∗∗p < 0.0001). (D) Off-target XLP-SMART LV expression in BM and peripheral blood (PB) 16 weeks post-transplant in NSG-Tg(Hu-IL15) mice. Whole BM was taken from each mouse at time of euthanasia and mice were bled at 16 weeks post-transplant to analyze PB for XLP-SMART LV expression. Whole BM, processed into a single-cell suspension, and red blood cell-lysed PB were stained for various off-target lineages within the hCD45+ gate (myeloid cells: hCD33+; B cells: hCD33–, hCD19+, hCD3–). Each LV’s relative expression was measured in off-target lineages via mCitrine+ MFI using flow cytometry. Each enhancer was compared with basal SH2D1A promoter expression (Pro) and the control LV (EFS). Data are represented as mean ± SD of biological triplicates from one experiment. Statistical significance was analyzed using a two-way ANOVA followed by multiple paired comparisons for normally distributed data (Tukey test). Statistical analysis was performed on all arms, but selected arms are shown. All statistical tests were two-tailed and a p value of <0.05 was deemed significant (ns, non-significant; ∗p < 0.05, ∗∗p < 0.01, ∗∗∗p < 0.001, ∗∗∗∗p < 0.0001). (E) XLP-SMART LV expression across NK cell development in PB 16 weeks post-transplant in NSG-Tg(Hu-IL15) mice. Mice were bled at 16 weeks to analyze PB for XLP-SMART LV expression after red blood cell lysis. Cells were stained for various stages of NK cell differentiation within the hCD45+CD33– gate (stage 1 [data not shown]: hCD34+; stage 2a [data not shown]: hCD34+, hCD117+, hCD122–; stage 2b [data not shown]: hCD34+, hCD117+, hCD122+; stage 3: hCD34–, hCD117+, hCD122+, hCD56–; stage 4a: hCD34–, hCD117+, hCD122+, hCD56+, hCD94+; stage 4b: hCD34–, hCD117–, hCD122+, hCD56+, hCD94+, hNKp80+; stage 5: hCD34–, hCD117–, hCD122+, hCD56+, hCD94+, hNKp80+, hCD16+; and stage 6: hCD34–, hCD117–, CD122+, hCD56+, hCD94+, hNKp80+, hCD16+, hCD57+). Each LV’s relative expression was measured across NK cell subpopulations via mCitrine+ MFI using flow cytometry. Each enhancer was compared with basal SH2D1A promoter expression (Pro) and the control LV (EFS). Data are represented as mean ± SD of biological triplicates from one experiment. Statistical significance was analyzed using a two-way ANOVA followed by multiple paired comparisons for normally distributed data (Tukey test). Statistical analysis was performed on all arms, but selected arms are shown. All statistical tests were two-tailed and a p value of <0.05 was deemed significant (ns, non-significant; ∗p < 0.05, ∗∗p < 0.01, ∗∗∗p < 0.001, ∗∗∗∗p < 0.0001). (F) XLP-SMART LV expression across T cell development in PB 16 weeks post-transplant in NSG-Tg(Hu-IL15) mice. Mice were bled at 16 weeks to analyze PB for XLP-SMART LV expression after red blood cell lysis. Cells were stained for various stages of mature T cell populations within the hCD45+ hCD34– hCD14– hCD19– hCD56– hCD5+ hCD7+ TCRab+ CD3+ gate (total CD4: hCD4+, hCD8–; CD4+CD45RA+: hCD4+, hCD8–, hCD45RA+, hCD45RO–; CD4+CD45RO+: hCD4+, hCD8–, hCD45RA–, hCD45RO+; total CD8: hCD4–, hCD8+; CD8+CD45RA+: hCD4–, hCD8+, hCD45RA+, hCD45RO–; CD8+CD45RO+: hCD4–, hCD8+, hCD45RA–, hCD45RO+). Each LV’s relative expression was measured in mature T cell subsets via mCitrine+ MFI using flow cytometry. Each enhancer was compared with basal SH2D1A promoter expression (Pro) and the control LV (EFS), both harboring an mCitrine reporter cassette. Data are represented as mean ± SD of biological triplicates from one experiment. Statistical significance was analyzed using a two-way ANOVA followed by multiple paired comparisons for normally distributed data (Tukey test). Statistical analysis was performed on all arms, but selected arms are shown. All statistical tests were two-tailed and a p value of <0.05 was deemed significant (ns, non-significant; ∗p < 0.05, ∗∗p < 0.01, ∗∗∗p < 0.001, ∗∗∗∗p < 0.0001).
Figure 4
Figure 4
Colony Forming Unit (CFU) Assay of XLP-SMART Lentiviral Vectors in Healthy Donor and XLP1 Patient Bone Marrow CD34+ Cells BM CD34+ cells from a healthy donor and an XLP1 patient were prestimulated for 24 h with 50 ng/mL each of human stem cell factor (hSCF), human thrombopoietin (hTPO), and human FMS-like tyrosine kinase 3 ligand (hFlt3-L) before transduction with XLP1-SMART LVs. 24 h after transduction, 100, 300, and 900 BM CD34+ HSPCs per replicate were plated in MethoCult. After 14 days of culture at 5% CO2, 37°C, and humidified atmosphere, the number of mature colonies were scored under the microscope for total colony-forming units (CFU) at a VCN of 1.1 (A) or 2.4 (D); total hematopoietic progenitor cell counts at a VCN of 1.1 (B) or 2.4 (E), denoted as myeloid (G/M/GM), erythroid (BFU/E), or mixed (GEMM); and, finally, percentage of total myeloid or erythroid lineage distribution for cells at a VCN of 1.1 (C) or 2.4 (F). Data are represented as mean ± SD of biological duplicates from one experiment. Clonogenicity was analyzed for statistical significance using a one-way ANOVA followed by multiple paired comparisons for normally distributed data (Tukey test). CFU hematopoietic potential was analyzed for statistical significance using a two-way ANOVA followed by multiple paired comparisons for normally distributed data (Tukey test). Statistical analysis was performed on all arms, but selected arms are shown. All statistical tests were two-tailed and a p value of <0.05 was deemed significant (ns, non-significant;∗p < 0.05, ∗∗p < 0.01, ∗∗∗p < 0.001, ∗∗∗∗p < 0.0001).
Figure 5
Figure 5
Functional Restoration and Cytotoxic Activity of XLP1-SMART Lentiviral Vectors in CD8+ T Cells and NK Cells from XLP1 Patients (A) FACS representation of SAP protein restoration in XLP1 patient CD8+ T cells. CD8+ T cells from a healthy donor (HD) and an XLP1 patient were isolated from PBMCs and transduced with XLP-SMART LVs. Ten days after transduction, cells were fixed, permeabilized, and stained for SAP protein using an anti-SAP monoclonal antibody. Stained cells were then assessed for their SAP expression via total SAP MFI within each target subpopulation using flow cytometry. (B) T cell restimulation-induced cell death (RICD) assay of XLP1 patient CD8+ T cells transduced with XLP-SMART LVs. CD8+ T cells from a HD and an XLP1 patient were isolated from PBMCs and transduced with XLP-SMART LVs. Ten days after transduction, cells were plated for RICD assay in OKT3 at final concentrations of 1,000, 100, and 10 ng/mL. After 24 h, XLP-SMART LV transduced cells were taken to measure the recovery of RICD in comparison with an EFS-SAP transduced condition and an HD control. The number of live cells (PI–) in stimulated controls were compared with unstimulated controls to measure the percent cell loss = [1 – (no. of PI– restimulated cells/no. of PI– untreated cells)] × 100. Data are represented as mean ± SD of biological triplicates from one experiment. Statistical significance was analyzed using a two-way ANOVA followed by multiple paired comparisons for normally distributed data (Tukey test). All statistical tests were two-tailed and a p value of <0.05 was deemed significant (ns, non-significant; ∗p < 0.05, ∗∗p < 0.01, ∗∗∗p < 0.001, ∗∗∗∗p < 0.0001). Compared with SH2D1A knockout (KO) T cells, the EFS, E3M, and E3GP conditions were deemed significant with a p value < 0.0001 (data not shown). (C) K562 NK cell cytotoxicity assay of XLP1 patient BM CD34+ cells transduced with XLP-SMART LVs. BM CD34+ cells from a HD and an XLP1 patient were transduced with XLP-SMART LVs and differentiated into CD56+ NK cells using the StemSpan NK Cell Generation Kit. On day 28 of differentiation, CD56+ NK cells were enriched using magnetic bead isolation and serially diluted with target cells at various effector to target (K562) ratios: 2.5:1, 1.25:1, 1:1.6, 1:3.2, 1:6.8, and 1:12.8. After 18 h of incubation, GFP+ tumor cells were counted via FACS to assess NK cytotoxicity and normalized to target only control wells. Due to limited XLP1 patient cells, data are represented as single replicates from one experiment. Statistical significance was analyzed using a two-way ANOVA followed by multiple paired comparisons for normally distributed data (Tukey test). All statistical tests were two-tailed and a p value of <0.05 was deemed significant (ns non-significant; ∗p < 0.05, ∗∗p < 0.01, ∗∗∗p < 0.001, ∗∗∗∗p < 0.0001). Compared with XLP1 patient samples, Healthy donor was deemed significant at a p value < 0.05; EFS was deemed significant with a p value < 0.001; E3M was deemed not significant; and E3GP was deemed significant with a p value < 0.0001. (D): Raji NK cell cytotoxicity assay of XLP1 patient BM CD34+ cells transduced with XLP-SMART LVs. BM CD34+ cells from a HD and an XLP1 patient were transduced with XLP-SMART LVs and differentiated into CD56+ NK cells using the StemSpan NK Cell Generation Kit. On day 28 of differentiation, CD56+ NK cells were enriched using magnetic bead isolation and serially diluted with target cells at various effector to target (Raji) ratios: 2.5:1, 1.25:1, 1:1.6, 1:3.2, 1:6.8, and 1:12.8. After 18 h of incubation, 7AAD+ CFSE+ tumor cells were counted via FACS to assess NK cytotoxicity and normalized to target only control wells. Due to insufficient patient cells, data are represented as single replicates from one experiment. Statistical significance was analyzed using a two-way ANOVA followed by multiple paired comparisons for normally distributed data (Tukey test). Compared with XLP1 patient samples, EFS was deemed not significant; E3M was deemed significant with a p value < 0.0001; and E3GP was deemed significant with a p value < 0.0001.

References

    1. Booth C., Gilmour K.C., Veys P., Gennery A.R., Slatter M.A., Chapel H., Heath P.T., Steward C.G., Smith O., O'Meara A., et al. X-linked lymphoproliferative disease due to SAP/SH2D1A deficiency: a multicenter study on the manifestations, management and outcome of the disease. Blood. 2011;117:53–62. doi: 10.1182/blood-2010-06-284935. - DOI - PMC - PubMed
    1. Ma C.S., Nichols K.E., Tangye S.G. Regulation of cellular and humoral immune responses by the SLAM and SAP families of molecules. Annu. Rev. Immunol. 2007;25:337–379. doi: 10.1146/annurev.immunol.25.022106.141651. - DOI - PubMed
    1. Coffey A.J., Brooksbank R.A., Brandau O., Oohashi T., Howell G.R., Bye J.M., Cahn A.P., Durham J., Heath P., Wray P., et al. Host response to EBV infection in X-linked lymphoproliferative disease results from mutations in an SH2-domain encoding gene. Nat. Genet. 1998;20:129–135. doi: 10.1038/2424. - DOI - PubMed
    1. Latour S., Gish G., Helgason C.D., Humphries R.K., Pawson T., Veillette A. Regulation of SLAM-mediated signal transduction by SAP, the X-linked lymphoproliferative gene product. Nat. Immunol. 2001;2:681–690. doi: 10.1038/90615. - DOI - PubMed
    1. Sayos J., Wu C., Morra M., Wang N., Zhang X., Allen D., Van Schaik S., Notarangelo L., Geha R., Roncarolo M.G., et al. The X-linked lymphoproliferative-disease gene product SAP regulates signals induced through the co-receptor SLAM. Nature. 1998;395:462–469. doi: 10.1038/26683. - DOI - PubMed