. 2024 Sep 17:11:1743-1761.
doi: 10.2147/JHC.S481338. eCollection 2024.

Dendritic Cell-Related Gene Signatures in Hepatocellular Carcinoma: An Analysis for Prognosis and Therapy Efficacy Evaluation

Affiliations

Dendritic Cell-Related Gene Signatures in Hepatocellular Carcinoma: An Analysis for Prognosis and Therapy Efficacy Evaluation

Huasheng Huang et al. J Hepatocell Carcinoma. .

Abstract

Background: This study aimed to identify dendritic cells (DCs) related genes in hepatocellular carcinoma (HCC) patients, establish DC-related subtypes and signatures, and correlate them with prognosis and treatment response.

Methods: DC-related genes were screened using Weighted Gene Co-expression Network Analysis (WGCNA) based on RNA sequencing from the TCGA (374 samples), GSE14520 (242 samples), and GSE76427 datasets (115 samples), following immune infiltration assessment by the TIME method. Two DC-related subtypes in HCC were identified through unsupervised clustering. A DC-related signature (DCRS) predictive of overall survival was constructed using LASSO and Cox regression models, and validated across the three datasets. Additionally, genetic mutation characteristics, immune infiltration levels, and treatment sensitivity were explored in DCRS risk groups. The expression levels of DCRS genes and risk scores were validated in the transcriptome of 13 HCC patients receiving combined targeted therapy and immunotherapy in the Guangxi cohort using Wilcoxon test.

Results: A signature consisting of 13 genes related to DCs was constructed, and the superior prognostic consistency of the low DCRS risk group was validated across the TCGA (P=0.003), GSE76427 (P=0.005), and GSE14520 (P=0.047) datasets. Furthermore, in the 147-sample transarterial chemoembolization (TACE) treatment dataset GSE104580, the response group exhibited lower risk scores than the non-response group (P=0.01), whereas in the 140-sample Sorafenib treatment dataset GSE109211 (P=0.041) and the 17-sample anti-PD-1 treatment dataset GSE202069 (P=0.027), the risk scores were higher in the response group. We also validated the gene expression levels of DCRS and the higher risk scores in the response group of the Guangxi cohort (P=0.034).

Conclusion: A DCRS consisting of 13 genes was established in HCC, facilitating the prediction of patient prognosis and responsiveness to TACE, targeted therapy, and immunotherapy.

Keywords: dendritic cells; hepatocellular carcinoma; immunotherapy; prognosis; targeted therapy.


Conflict of interest statement

The authors declare that the research was conducted in the absence of any commercial or financial relationships that could be construed as a potential conflict of interest.

Figures
None
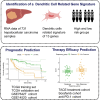
Graphical abstract
Figure 1
Figure 1
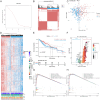
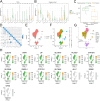
Identify DC-related genes. (A-C), Use weighted gene co-expression network analysis to identify gene modules associated with immune cell infiltration in the TCGA (A), GSE14520 (B), and GSE76427 (C) datasets separately. The “r” represents the correlation coefficient; (D-F), Identify gene modules most correlated with DCs in the TCGA (D), GSE14520 (E), and GSE76427 (F) datasets; G, Venn diagrams to obtain DC-related genes based on the intersection. (H-I), Conduct Gene Ontology and Kyoto Encyclopedia of Genes and Genomes analyses of DC-related genes.
Figure 2
Figure 2
Construct and analyze DC-related clusters. (A-B), Unsupervised clustering analysis identifies two DC-related clusters in the TCGA dataset; (C), Principal component analysis (PCA) demonstrates the separation trend of the two DC-related clusters; (D), Heatmap shows the enrichment levels of DC-related genes in the two clusters; (E), The Kaplan–Meier curve between the two DC-related clusters. (F), Volcano plot of differentially expressed genes between the two DC-related clusters; (G-H), Gene set enrichment analysis of differentially expressed genes.
Figure 3
Figure 3
Constructing and validating the DC-related signature. (A), Venn diagram identifies the intersection of differentially expressed genes in DC-related clusters and differentially expressed genes between TCGA tumor and adjacent non-tumor tissues; (B-C), Construction of the DC-related signature based on LASSO regression; (D-G), Survival curves of DCRS risk groups in the TCGA training set, TCGA validation set, GSE76427, and GSE14520; (H-K), Risk score scatter plots of the TCGA training set, TCGA validation set, GSE76427, and GSE14520; (L-O), Time‐dependent receiver operating characteristic curves of the risk scores in the TCGA training set, TCGA validation set, GSE76427, and GSE14520.
Figure 4
Figure 4
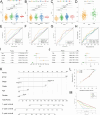
Dendritic cell-related signature association with clinical parameters and construction of a nomogram. (A-D), Boxplots of risk scores for hepatocellular carcinoma patients stratified by different T stages, tumor stages, pathological grades, and survival status. (E-H), Receiver operating characteristic curves of risk scores and clinical parameters in the TCGA training set, TCGA validation set, GSE76427, and GSE14520 datasets. (I-J), Univariate and multivariate Cox regression analyses in the TCGA-LIHC dataset. (K), Nomogram combining risk groups with clinical parameters. (L), Calibration curves of nomogram model at 1, 3, and 5 years in the nomogram. (M), Decision curves of the nomogram and clinical parameters.\.
Figure 5
Figure 5
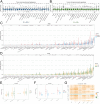
Analysis of gene mutations and TMB in DCRS risk groups. (A-B), Mutation landscape of top 20 genes in DCRS high-risk and low-risk groups. (C), Boxplot of risk scores for TP53 wild-type and mutation types. (D), Boxplot of risk scores for CTNNB1 wild-type and mutation types. (E), Boxplot of TMB in DC-related clusters. (F), Boxplot of TMB in DCRS risk groups. (G), Joint survival curve of risk groups and TMB. (H), Joint survival curve of DC-related clusters and TMB.
Figure 6
Figure 6
Immune infiltration analysis. (A-B), Gene set variation analysis of DC-related clusters and risk groups; (C-D), Immune infiltration analysis based on the xCell algorithm in DC-related clusters and risk groups. The red text on the x-axis indicated dendritic cells and their subpopulations.; (E-F), Immune infiltration analysis based on the ESTIMATE algorithm in DC-related clusters and risk groups; G, Heatmap showing the correlation between DC-related signature genes and immune infiltrating cells.
Figure 7
Figure 7
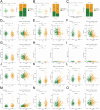
Therapeutic response prediction and drug sensitivity analysis. (A), Boxplots and bar graphs of risk scores in the GSE104580 dataset treated with TACE; (B), Boxplots and bar graphs of risk scores in the GSE109211 dataset treated with Sorafenib; (C), Boxplots and bar graphs of risk scores in the GSE202069 dataset treated with anti-PD1 therapy; (D-O), Boxplots and correlation scatter plots of drug sensitivity analysis for different drugs.
Figure 8
Figure 8
Expression and validation of DCRS genes in Guangxi cohort. (A), Expression levels of DCRS genes in TCGA; (B), Expression levels of DCRS genes in the Guangxi cohort; (C), Boxplots of risk scores in the Guangxi cohort; (D), Correlation heatmap of DCRS genes. The “r” represents the correlation coefficient; (E-G), Dimensionality reduction, clustering, and cell annotation of the single-cell dataset GSE140228; (H), Differential expression of DCRS genes in various cells in the GSE140228 dataset.

References

    1. Sung H, Ferlay J, Siegel RL, et al. Global cancer statistics 2020: GLOBOCAN estimates of incidence and mortality worldwide for 36 cancers in 185 countries. CA. 2021;71(3):209–249. doi:10.3322/caac.21660 - DOI - PubMed
    1. El-Serag HB. Hepatocellular carcinoma. N Engl J Med. 2011;365(12):1118–1127. doi:10.1056/NEJMra1001683 - DOI - PubMed
    1. Forner A, Reig M, Bruix J. Hepatocellular carcinoma. Lancet. 2018;391(10127):1301–1314. doi:10.1016/S0140-6736(18)30010-2 - DOI - PubMed
    1. Kulik L, El-Serag HB. Epidemiology and management of hepatocellular carcinoma. Gastroenterology. 2019;156(2):477–491.e471. doi:10.1053/j.gastro.2018.08.065 - DOI - PMC - PubMed
    1. Chen W, Zheng R, Baade PD, et al. Cancer statistics in China, 2015. CA. 2016;66(2):115–132. doi:10.3322/caac.21338 - DOI - PubMed

LinkOut - more resources