. 2024 Sep 9;20(12):4819-4837.
doi: 10.7150/ijbs.100276. eCollection 2024.

ESM1 facilitates the EGFR/HER3-triggered epithelial-to-mesenchymal transition and progression of gastric cancer via modulating interplay between Akt and angiopoietin-2 signaling

Affiliations

ESM1 facilitates the EGFR/HER3-triggered epithelial-to-mesenchymal transition and progression of gastric cancer via modulating interplay between Akt and angiopoietin-2 signaling

Yi-Chieh Yang et al. Int J Biol Sci. .

Abstract

Gastric cancer (GC) poses global challenges due to its difficult early diagnosis and drug resistance, necessitating the identification of early detection markers and understanding of oncogenic pathways for effective GC therapy. Endothelial cell-specific molecule 1 (ESM1), a secreted glycoprotein, is elevated in various cancers, but its role in GC remains controversial. In our study, ESM1 was elevated in GC tissues, and its concentration was correlated with progression and poorer patient prognosis in independent cohorts. Functionally, ESM1 expression promoted proliferation, anoikis resistance, and motility of GC cells, as well as tumor growth in PDOs and in GC xenograft models. Mechanistically, ESM1 expression triggered the epithelial-to-mesenchymal transition (EMT) of GC cells by enhancing epidermal growth factor receptor (EGFR)/human EGFR 3 (HER3) association and activating the EGFR/HER3-Akt pathway. Additionally, angiopoietin-2 (ANGPT2) was found to be highly correlated with ESM1 and interplayed with Akt to induce the EMT and cancer progression. Use of a signal peptide deletion mutant (ESM1-19del) showed that the secreted form of ESM1 is crucial for its protumorigenic effects by activating the EGFR/HER3-Akt/ANGPT2 pathway to promote the EMT. Patients with high levels of both ESM1 and ANGPT2 had the poorest prognoses. Furthermore, therapeutic peptides successfully inhibited ESM1's induction of the aforementioned signals and motility of GC cells. ESM1's oncogenic role in GC involves activating the EGFR/HER3-Akt/ANGPT2 pathway, presenting a potential therapeutic target for GC.

Keywords: Akt; Angiopoietin-2; EGFR/HER3; EMT; ESM1; Gastric cancer; Patient-derived organoid.


Conflict of interest statement

Competing Interests: The authors have declared that no competing interest exists.

Figures

Figure 1
Figure 1
ESM1 is highly expressed in gastric cancer (GC) and associated with a poor prognosis. (A) Gene expression levels of ESM1 in paired adjacent (GSE66229) normal and tumor tissues derived from patients with GC. Statistical significance was analyzed by a paired t-test. (B, C) ESM1 gene expression levels in GC from the GSE66229 dataset were compared according to clinical stages and the lymph node metastasis (B), and vascular invasion (C) statuses. (D) Kaplan-Meier (KM) survival analysis showing the correlation between ESM1 expression and the overall survival (OS) or disease-free survival of GC patients based on the GSE66229 dataset. (E) Correlation between ESM1 expression and OS in GC patients receiving different treatments as determined using a KM plotter database. Gene expression was dichotomized into high and low values using the median as a cutoff. HR, hazard ratio. (F) Representative pictures and quantified results of IHC staining of ESM1 levels in normal and tumor tissues. (G) KM survival analysis showing the correlation between ESM1 expression and the OS of GC patients based on Taiwanese cohorts.
Figure 2
Figure 2
ESM1 expression promotes the growth and motility of gastric cancer (GC) cells. (A) Protein expression levels of ESM1 in GC (AGS, KATO-III, N87, and MKN-45) cell lines. Quantitative results of ESM1 proteins were adjusted to α-tubulin protein levels. (B) Western blot and dot blot analyses respectively revealed endogenous and secreted ESM1 levels in AGS cells expressing ESM1-HA (left panel) or ESM1 shRNA (right panel). (C) Colony-forming abilities of ESM1-manipulated AGS cells. The quantified data were examined by calculating colony numbers per well. (D) The growth number of 3D patient-derived organoids (PDOs) was measured after knockdown of ESM1 in F014-BL and F012 cells. Levels of magnification of the representative images were 10x. (E) Migratory ability of ESM1-manipulated AGS cells was determined by a transwell migration assay. Data in C-E are presented as the mean ± SD.
Figure 3
Figure 3
ESM1 induces the epithelial-to-mesenchymal transition (EMT) of gastric cancer (GC) cells through activating epidermal growth factor receptor (EGFR)-dependent signaling. (A) Gene set enrichment of the EMT in GC patients with high (top 5%) versus low (bottom 5%) expression of ESM1. An EMT gene set derived from HALLMARK was used. (B) Positive correlations of ESM1 and the mesenchymal markers, Snail and Slug, in 300 GC patients. (C) Cellular microfilament bundle rearrangements were induced by ESM1 overexpression in AGS cells. Cells that overexpressed ESM1-HA or a control vector (Neo) were seeded on coverslips overnight. Cells were then fixed and stained for F-actin by Alexa Fluor 594 phalloidin. Nuclei were counterstained with DAPI (blue). Original magnification, 400×. (D) Western blot and migration analyses to examine levels of phosphorylated (p)-EGFR, t-EGFR, ESM1, Snail, and Slug under manipulation of ESM1 and EGFR levels. (E) The migratory ability of ESM1/EGFR-manipulated AGS cells. (F) The top five enriched pathways of GC patients (GSE66229) with high (top 5%) versus low (bottom 5%) expressions of ESM1 obtained by a GSEA. (G) Detection of activation of the EGFR (pTyr1068) and its downstream signaling including Akt (pSer473) and signal transduction and activator of transcription 3 (STAT3) (pTyr705) by Western blotting after overexpression of ESM1 in AGS and Kato-III cells. (H) Examining activation of transforming growth factor (TGF)-β and p-Smad2 signals in ESM1-overexpressing AGS cells.
Figure 4
Figure 4
Angiopoietin-2 (ANGPT2) is highly correlated with ESM1 and interplays with Akt to promote the epithelial-to-mesenchymal transition (EMT) and progression of gastric cancer (GC) cells. (A) List of the top 10 ESM1-correlated genes with the highest Pearson's correlation coefficient obtained from the GSE66229 database (left panel). Visualized dot plot diagram of a correlation between ANGPT2 and ESM1 in 300 GC patients (right panel). (B) AGS cells overexpressing ESM1-HA or a control vector as indicated. Cell protein and RNA were extracted, and ESM1 and ANGPT2 expression levels were determined by Western blotting (upper panel) and RT-PCR (lower panel), respectively. (C-D) AGS cells overexpressing ESM1-HA, ESM1-HA+shANGPT2, shANGPT2, or a control vector as indicated were subjected to transwell-migration and colony-formation assays (C), and also a Western blot analysis (D). Multiples of differences are presented as the mean ± SD. ** p < 0.01, *** p < 0.001, compared to the control group; ## p < 0.01, ### p < 0.001, compared to the ESM1-overexpressing only group. (E, F) AGS/ESM1-HA cells were treated with 1 μM MK-2206 or vehicle for 24 h and the expression of indicated targets was determined by Western blotting (E), and the migration ability was further examined (F). (G) Positive correlation of protein levels of ESM1 and ANGPT2 in Taiwanese GC patients. (H) Kaplan-Meier curves of overall GC patient survival, grouped by ESM1 and ANGPT2 expressions. The p value indicates a comparison between patients with ESM1high/ANGPT2high, ESM1low/ANGPT2low, and others. The GC dataset was retrieved from a Taiwanese GC patient cohort.
Figure 5
Figure 5
Secretion of ESM1 is critical for ESM1-induced activation of the epidermal growth factor receptor (EGFR)-AKT axis to promote epithelial-to-mesenchymal transition (EMT)-mediated cell mobility in gastric cancer (GC) cells. (A, B) Wild-type ESM1 (WT-ESM1) and 19del-ESM1 were introduced into AGS cells, and then cells were subjected to dot blot and Western blot assays to respectively detect the secretion of ESM1 (A) and activation of the EGFR-Akt-signal transduction and activator of transcription 3 (STAT3) axis or expressions of angiopoietin-2, Snail, and Slug (B). α-tubulin, EGFR, Akt, or STAT3 were used as an equal loading control. (C, D) AGS and patient-derived organoid (PDO) (F014-BL) cells were infected with a lentivirus-carrying control vector, WT-ESM1, or 19del-ESM1 as indicated. (C) Upper panel: Representative photos of transwell migration assays. Lower panel: Quantified migratory ability is presented as the mean ± SD. (D) The growth number of 3D PDOs was measured after carrying the control vector, WT-ESM1, or 19del-ESM1. (E-G) NCI-N87 cells carrying the control vector, WT-ESM1, or 19del-ESM1 were subcutaneously injected into mice, and the tumor growth curve (E), visualized tumor nodules (F), and tumor weight (G) were recorded as indicated. (H) NCI-N87 xenografts infected with the control vector, WT-ESM1, or 19del-ESM1 were isolated to detect expressions of Ki-67 and Snail/Slug by IHC staining. Original magnification, 400×.
Figure 6
Figure 6
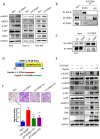
Targeting the ESM1-epidermal growth factor receptor (EGFR) interaction by therapeutic peptides suppresses EGFR/human EGFR3 (HER3)-driven epithelial-mesenchymal transition (EMT) and cell mobility in gastric cancer (GC) cells. (A) Wild-type ESM1 (WT-ESM1) was introduced into AGS, Kato-III, and NCI-N87 cells, and then cells were subjected to a Western blot assay to evaluate the phosphorylation status of HER3. (B, C) Co-immunoprecipitation assays were conducted to assess the interaction between EGFR, ESM1, and HER3 in AGS/WT-ESM cells (B). Comparing the association of EGFR and HER3 in the AGS cells transfected with either WT-ESM1 or a control vector (Ctrl) (C). Subsequently, a Western blot analysis was performed to examine the formation of this complex. (D) Schematic diagram of two synthetic peptides including peptide 1 (1-27 aas) and peptide 2 (26-46 aas) of the ESM1 protein. (E, F) AGS cells were infected with a lentivirus carrying a control vector or WT-ESM1 following treatment of cells with synthetic peptides (1 µM) as indicated. The phosphorylation status of HER3, EGFR and Akt, and expressions of angiopoietin-2, Snail, and Slug were all detected by Western blotting (E). The migratory ability of cells was determined by a transwell migration assay (F). Differences are presented as the mean ± SD. *** p < 0.001, compared to the WT-ESM1-overexpressing only group.
Figure 7
Figure 7
A working model shows the molecular mechanism underlying the ability of ESM1 to promote progression of gastric cancer (GC) cells. The oncogenic role of ESM1 was attributed to triggering the epithelial-to-mesenchymal transition (EMT) by activating epidermal growth factor receptor (EGFR)/human EGFR3 (HER3) and their downstream signal, Akt. Angiopoietin-2 was highly correlated with ESM1 and interplayed with Akt to promote EMT progression. Blocking the interaction of ESM1 and the EGFR by synthetic ESM1 peptides attenuated the EGFR/HER3 activation-driven EMT, cell motility, and proliferation. This schematic representation was created using BioRender software.

References

    1. Sung H, Ferlay J, Siegel RL, Laversanne M, Soerjomataram I, Jemal A. et al. Global Cancer Statistics 2020: GLOBOCAN Estimates of Incidence and Mortality Worldwide for 36 Cancers in 185 Countries. CA Cancer J Clin. 2021;71:209–49. - PubMed
    1. Hayakawa Y, Nakagawa H, Rustgi AK, Que J, Wang TC. Stem cells and origins of cancer in the upper gastrointestinal tract. Cell Stem Cell. 2021;28:1343–61. - PMC - PubMed
    1. Klein CA. Cancer progression and the invisible phase of metastatic colonization. Nat Rev Cancer. 2020;20:681–94. - PubMed
    1. Ferlay J, Steliarova-Foucher E, Lortet-Tieulent J, Rosso S, Coebergh JW, Comber H. et al. Cancer incidence and mortality patterns in Europe: estimates for 40 countries in 2012. Eur J Cancer. 2013;49:1374–403. - PubMed
    1. Tan Z. Recent Advances in the Surgical Treatment of Advanced Gastric Cancer: A Review. Med Sci Monit. 2019;25:3537–41. - PMC - PubMed

MeSH terms