. 2024 Sep 3;20(12):4635-4653.
doi: 10.7150/ijbs.101039. eCollection 2024.

Darolutamide-mediated phospholipid remodeling induces ferroptosis through the SREBP1-FASN axis in prostate cancer

Affiliations

Darolutamide-mediated phospholipid remodeling induces ferroptosis through the SREBP1-FASN axis in prostate cancer

Bingheng Li et al. Int J Biol Sci. .

Abstract

Darolutamide, an androgen receptor inhibitor, has been approved by the Food and Drug Administration (FDA) for the treatment of prostate cancer (PCa), especially for patients with androgen receptor mutations. Owing to the unique lipidomic profile of PCa and the effect of darolutamide, the relationship between darolutamide and ferroptosis remains unclear. The present study showed that darolutamide significantly induces ferroptosis in AR+ PCa cells. Mechanistically, darolutamide promotes ferroptosis by downregulating SREBP1, which then inhibits the transcription of FASN. FASN knockdown modulates phospholipid remodeling by disrupting the balance between polyunsaturated fatty acids (PUFAs) and saturated fatty acids (SFAs), which induces ferroptosis. Clinically, SREBP1 and FASN are significantly overexpressed in PCa tissues and are related to poor prognosis. Moreover, the synergistic antitumor effect of combination therapy with darolutamide and ferroptosis inducers (FINs) was confirmed in PCa organoids and a mouse xenografts model. Overall, these findings revealed a novel mechanism of darolutamide mediated ferroptosis in PCa, laying the foundation for the combination of darolutamide and FINs as a new therapeutic strategy for PCa patients.

Keywords: darolutamide; ferroptosis; phospholipid remodeling; prostate cancer.


Conflict of interest statement

Competing Interests: The authors have declared that no competing interest exists.

Figures

Figure 1
Figure 1
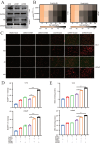
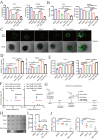
Darolutamide promotes ferroptosis in AR+ PCa cells. A-B KEGG pathway enrichment analysis of the DEGs between the AR WT and AR V-7 groups. C KEGG pathway enrichment analysis of the DEGs in the darolutamide-treated group. D Viability analysis of the indicated cells treated with darolutamide (C4-2,50 µM; LNCaP, 10 µM) plus cell death inhibitors Fer-1 (2µM) and Nec-1 (10µM) for 24h. E Representative images of mitochondria by TEM using LNCaP cells treated with erastin (20µM) or darolutamide (10µM). Scale bars represent 5 µm and 2 µm. F Levels of lipid peroxidation in the indicated groups examined using BODIPY C11 staining. G Analysis of MDA level in the indicated groups. Erastin treatment was used as a positive control. H Representative images of reduced and oxidized lipid in the indicated groups treated with BODIPY C11 staining. *p < 0.05, **p < 0.01, and ***p < 0.001.
Figure 2
Figure 2
AR deletion sensitizes PCa cells to ferroptosis. A Immunoblot analysis of AR in the indicated cells treated with siCtrl and siRNA targeting AR. B Viability analysis of siAR cells treated with different concentrations of erastin (0, 5, 10, 15, 20, and 30 µM) for 24 h. C Representative images of cellular reactive oxygen species (ROS) in the indicated cells treated DCFH-DA probe. D-E Levels of BODIPY C11 (D), as measure of the lipid peroxidation, and MDA concentrations (E), examined using MDA assay kit in the indicated cells treated with or without erastin for 24h. *p < 0.05, **p < 0.01, and ***p < 0.001.
Figure 3
Figure 3
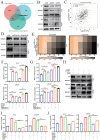
Darolutamide promotes ferroptosis by inhibiting SREBP1 expression. A Venn diagram showing the common candidate genes that overlapped with the GSE148397, ferroptosis-related genes, and lipid metabolism-related genes. B Immunoblot analysis of SREBP1 expression in AR-knockdown cells. C Analysis of the correlation between AR and SREBP1 in TCGA database. D Immunoblot analysis of SREBP1 expression in SREBP1 knockdown indicated cells. E Viability analysis of siSREBP1 indicated cells treated with different concentrations of erastin (0, 5, 10, 15, 20, and 30 µM) for 24 h. F-G Lipid peroxidation levels (F) and MDA concentrations (G) examined in the indicated cells treated with or without erastin for 24h. H Immunoblot analysis of AR and SREBP1 expression in the indicated cells; GAPDH served as a loading control. I-J Lipid peroxidation levels (I) and MDA concentrations (J) examined in the indicated cells by BODIPY C11 staining and MDA assay kit. *p < 0.05, **p < 0.01, and ***p < 0.001.
Figure 4
Figure 4
Darolutamide facilitates ferroptosis by regulating the SREBP1-FASN axis in PCa. A Top 25 genes related to SREBP1 expression in PCa in TCGA database. B Analysis of correlation between SREBP1 and FASN in TCGA database. C-D Relative mRNA level of SREBP1 and FASN in indicated cells treated with darolutamide (C4-2,50 µM; LNCaP, 10 µM) or darolutamide combined with Fer-1. E Immunoblot of SREBP1 and FASN expression in the indicated groups treated with darolutamide with or without Fer-1 for 24h. F Immunoblot of SREBP1 and FASN in C4-2 and LNCaP cells treated with different concentrations of darolutamide (0, 10, 20, 30, 40 and 50 µM) for 24h. G The UCSC genome bioinformatics site showed enrichment of SREBP1 in the promoter of FASN. H JASPAR predicted SREBP1-binding elements at the promoters of FASN. I ChIP-qPCR analysis of SREBP1 and RNA polymerase II (Pol-II) genomic occupancy at the FASN promoter after SREBP1 knockdown. *p < 0.05, **p < 0.01, and ***p < 0.001.
Figure 5
Figure 5
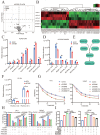
FASN inhibition induces lipid peroxidation in PCa cells. A KEGG enrichment analysis showed the pathways significantly enriched after treatment with FASN inhibition. B Viability analysis of FASN knockdown cells treated with different concentrations of erastin (0, 5, 10, 15, 20, and 30 µM) for 24 h. C-D Lipid peroxidation levels (C) and MDA concentrations (D) examined in the indicated cells treated with or without erastin for 24h. E Immunoblot analysis of SREBP1 and FASN expression in the indicated cells. F-G Lipid peroxidation levels (F) and MDA concentrations (G) examined in the indicated groups using flow cytometry and MDA assay kit. *p < 0.05, **p < 0.01, and ***p < 0.001.
Figure 6
Figure 6
FASN inhibition mediates the SFA/PUFA ratio to regulate ferroptosis in PCa. A Lipidomic analysis of lipid classes by MS/MS in shCtrl and shFASN LNCaP cells. B Heatmap analysis, using liquid chromatography‒mass spectrometry (LC‒MS), of membrane phospholipids with different FAs analysis. C-D Quantification of the most abundant PE/PC-MUFAs and PE/PC-PUFAs in shCtrl and shFASN cells. E Schematic of the synthesis of palmitate (FA 16:0). F Quantification of PC-PA in shCtrl and shFASN cells. G Viability analysis of siFASN C4-2 and LNCaP cells, as indicated, which were treated with different concentrations of erastin and/or PA (20 µM) for 24 h. H Viability analysis of siCtrl and siFASN cells treated with or without erastin and different concentrations of PA (0, 10, and 20 µM) for 24 h. I MDA levels examined in the indicated groups. *p < 0.05, **p < 0.01, and ***p < 0.001.
Figure 7
Figure 7
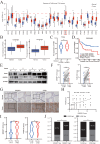
SREBP1 and FASN are elevated in PCa and are associated with poor prognosis. A Analysis of FASN expression in pan-cancer using The Cancer Genome Atlas datasets. B Comparison of SREBP1 and FASN expression between normal tissues and PCa tumors in the Cambridge database. C Analysis of FASN expression in different groups stratified according to Gleason score. D Kaplan‒Meier curves for the RFS of PCa patients with high versus low FASN expression in the GSE54460 datasets. E Immunoblot analysis of SREBP1 and FASN expression between normal tissues and PCa tumors in the SYSMH cohort. F-G Quantitative analysis and representative images of SREBP1 and FASN expression between adjacent tissues and PCa tumors in tissue microarrays. H Correlations analysis between SREBP1 and FASN expression using the Pearson correlation test. I Analysis of SREBP1 and FASN expression in the T1+T2 and T3+T4 groups. J Correlations analysis between SREBP1 and 4-HNE expression, as well as between FASN and 4-HNE expression, using Fisher's exact test. *p < 0.05, **p < 0.01, and ***p < 0.001.
Figure 8
Figure 8
Darolutamide and FINs synergistically sensitize PCa cells to cell death. A Viability analysis of C4-2 and LNCaP cells treated with darolutamide (C4-2,50 µM; LNCaP, 10 µM) or FINs (erastin, 20 µM and RSL-3,100 nM) or their combination for 24 h. B Quantification analysis of colony formation in C4-2 or LNCaP cells with indicated treatments. C Representative images of SYTOX Green assays in prostate cancer organoid models subjected to the indicated treatments. D-E Lipid peroxidation levels (D) and MDA concentrations (E) examined in C4-2 and LNCaP cells treated with indicated treatments. F The synergistic effect of the combination of darolutamide and RSL-3 on antitumor activity using CalcuSyn software. G Treatment schema for nude mice bearing LNCaP xenografts. H Representative images of xenograft tumors in each group treated with darolutamide and/or RSL-3 at the experimental endpoints. I Tumor weights in each group treated with darolutamide and/or RSL-3. J Quantitative analysis of SREBP1 and FASN expression in tumor sections from mice given the indicated treatments. *p < 0.05, **p < 0.01, and ***p < 0.001.
Figure 9
Figure 9
Proposed model of the mechanism by which darolutamide regulates ferroptosis through the SREBP1-FASN axis in PC.

References

    1. Siegel RL, Giaquinto AN, Jemal A. Cancer statistics, 2024. CA Cancer J Clin. 2024;74:12–49. - PubMed
    1. Yamada Y, Beltran H. The treatment landscape of metastatic prostate cancer. Cancer Lett. 2021;519:20–9. - PMC - PubMed
    1. Desai K, McManus JM, Sharifi N. Hormonal Therapy for Prostate Cancer. Endocr Rev. 2021;42:354–73. - PMC - PubMed
    1. Wang Q, Chen J, Singh S, Xie Z, Qin F, Shi X. et al. Profile of chimeric RNAs and TMPRSS2-ERG e2e4 isoform in neuroendocrine prostate cancer. Cell Biosci. 2022;12:153. - PMC - PubMed
    1. Fizazi K, Shore N, Tammela TL, Ulys A, Vjaters E, Polyakov S. et al. Nonmetastatic, Castration-Resistant Prostate Cancer and Survival with Darolutamide. N Engl J Med. 2020;383:1040–9. - PubMed

MeSH terms