

Identification of key genes and pathways involved in T-DM1-resistance in OE-19 esophageal cancer cells through bioinformatics analysis
- PMID: 39309859
- PMCID: PMC11415672
- DOI: 10.1016/j.heliyon.2024.e37451
Identification of key genes and pathways involved in T-DM1-resistance in OE-19 esophageal cancer cells through bioinformatics analysis
Abstract
Introduction: Esophageal Cancer (EC) ranks among the most common malignancies worldwide. Most EC patients acquire drug resistance to chemotherapy either intrinsically or acquired after T-DM1 treatment, which shows that increasing or decreasing the expression of particular genes might influence chemotherapeutic sensitivity or resistance. Therefore, gaining a deeper understanding of the altered expression of genes involved in EC drug resistance and developing new therapeutic methods are essential targets for continued advancement in EC therapy.
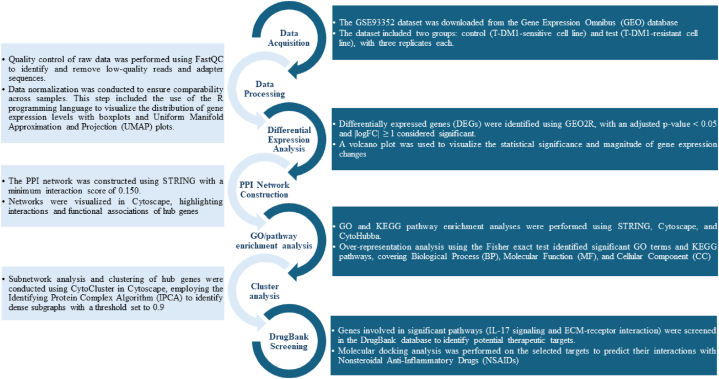
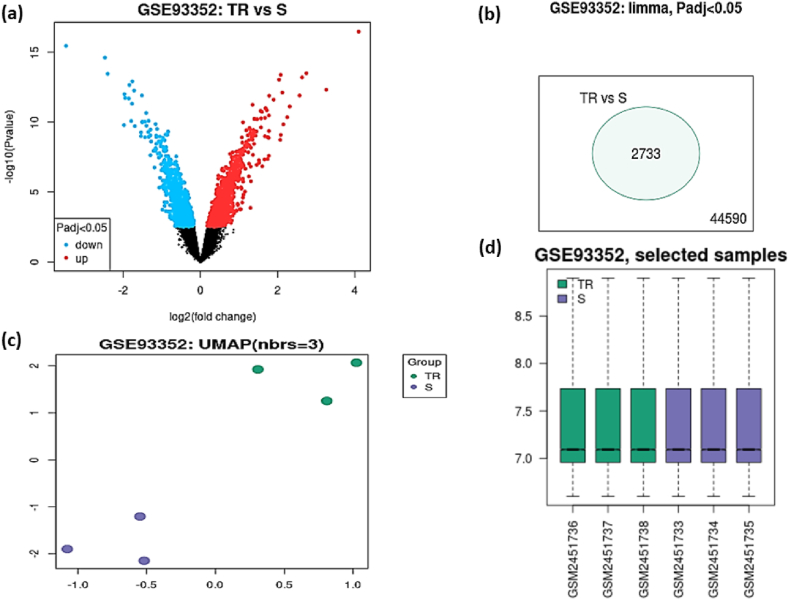
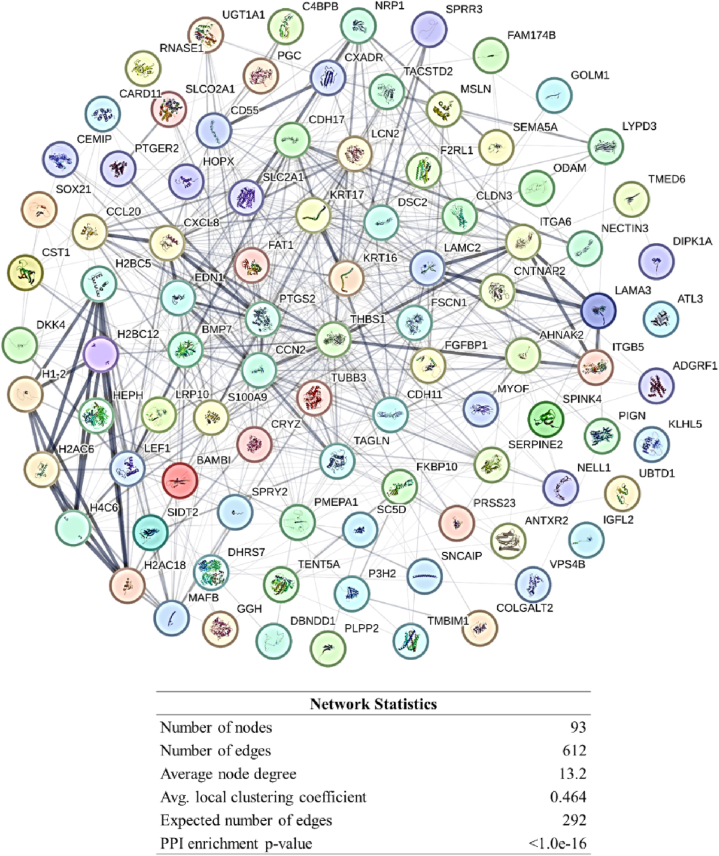
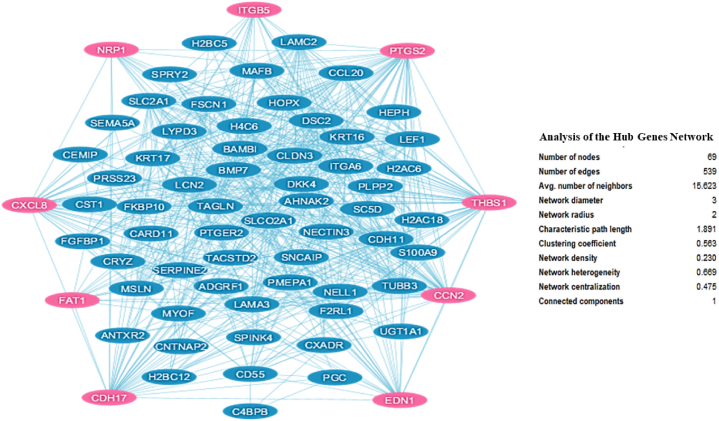
Methods: The present study aimed to find critical regulatory genes/pathways in the progression of T-DM1 resistance in OE-19 EC cells. Expression datasets were extracted from GEO omnibus. Gene interactions were analyzed, and the protein-protein interaction network was drawn. Then, enrichment analysis of the hub genes and network cluster analysis of the hub genes was performed. Finally, the genes were screened in the DrugBank database as therapeutic targets and molecular docking analysis was done on the selected targets.
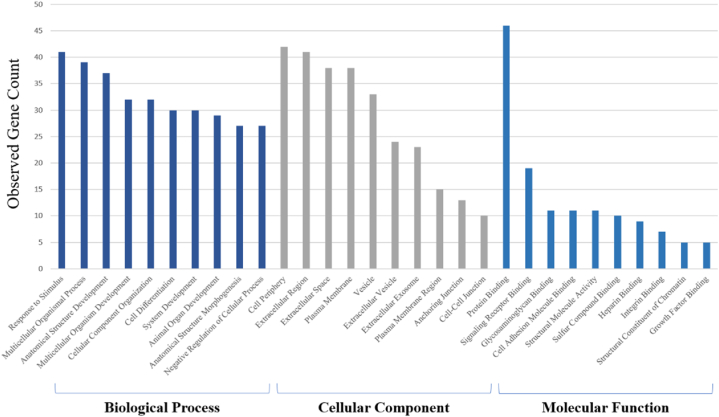
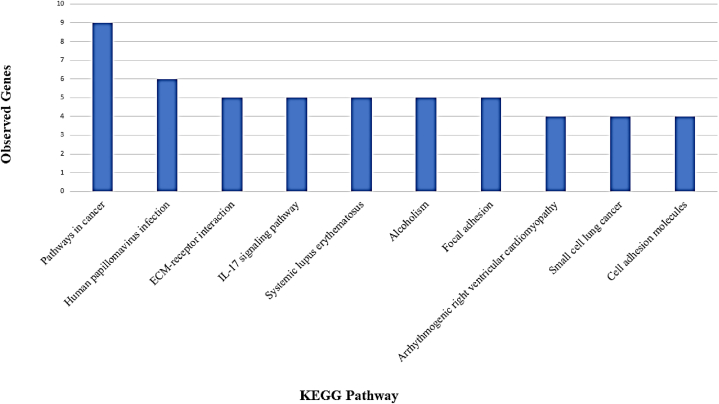
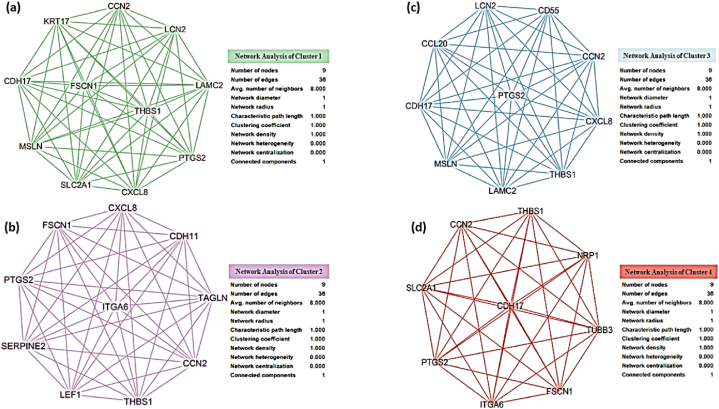
Results: In the current study, nine hub genes were identified in TDM-1-resistant EC cells (CTGF, CDH17, THBS1, CXCL8, NRP1, ITGB5, EDN1, FAT1, and PTGS2). The KEGG analysis highlighted the IL-17 signaling pathway and ECM-receptor interaction pathway as the most critical pathways; cluster analysis also showed the significance of these pathways. Therefore, the genes involved in these two pathways, including CXCL8, FSCN1, PTGS2, SERPINE2, LEF1, THBS1, CCN2, TAGLN, CDH11, and ITGA6, were searched in DrugBank as therapeutic targets. The DrugBank analysis suggests a potential role for Nonsteroidal Anti-Inflammatory Drugs (NSAIDs) in reducing T-DM1 drug resistance in EC. The docking results revealed that NSAIDs, including Diclofenac, Mefenamic acid, Celecoxib, Naproxen, and Etoricoxib, significantly suppress resistant cancer cells.
Conclusion: This comprehensive bioinformatics analysis deeply explains the molecular mechanisms governing TDM-1 resistance in EC. The identified hub genes and their associated pathways offer potential targets for therapeutic interventions. Moreover, the possible role of NSAIDs in mitigating T-DM1 resistance presents an intriguing avenue for further investigation. This research contributes significantly to the field and establishes a basis for further research to enhance treatment efficacy for EC patients.
Keywords: Bioinformatics; DrugBank; ECM-Receptor interaction; Esophageal cancer; Hub genes; IL-17 signaling pathway; NSAIDs; T-DM1 resistance.
© 2024 The Authors.
Conflict of interest statement
The authors declare that they have no known competing financial interests or personal relationships that could have appeared to influence the work reported in this paper.
Figures
References
-
- Sung H., et al. Global cancer statistics 2020: GLOBOCAN estimates of incidence and mortality worldwide for 36 cancers in 185 countries. CA A Cancer J. Clin. 2021;71(3):209–249. - PubMed
-
- Oh D.-Y., Bang Y.-J. HER2-targeted therapies—a role beyond breast cancer. Nat. Rev. Clin. Oncol. 2020;17(1):33–48. - PubMed
LinkOut - more resources
Full Text Sources
Research Materials
Miscellaneous
