

The classification, origin, and evolutionary dynamics of severe fever with thrombocytopenia syndrome virus circulating in East Asia
- PMID: 39310090
- PMCID: PMC11416872
- DOI: 10.1093/ve/veae072
The classification, origin, and evolutionary dynamics of severe fever with thrombocytopenia syndrome virus circulating in East Asia
Abstract
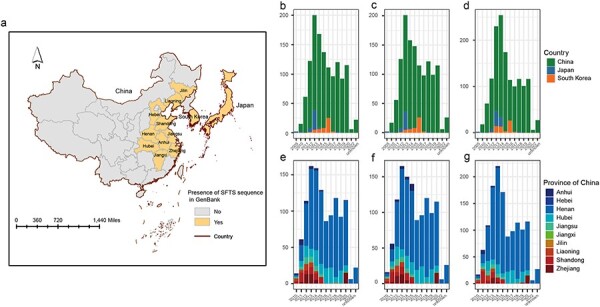
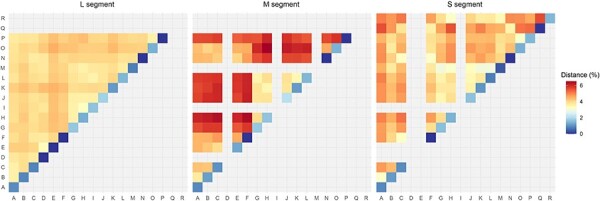
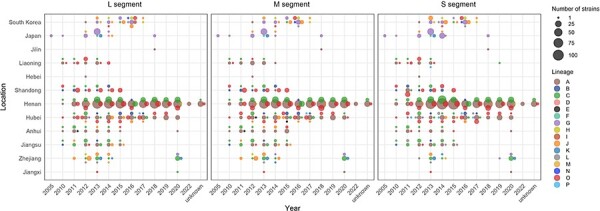
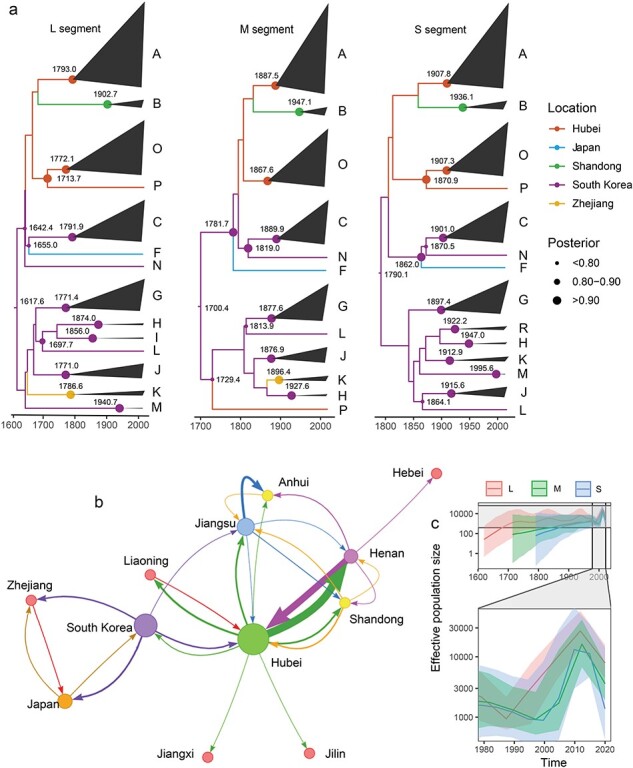
The classification of severe fever with thrombocytopenia syndrome virus (SFTSV) lacked consistency due to limited virus sequences used across previous studies, and the origin and transmission dynamics of the SFTSV remains not fully understood. In this study, we analyzed the diversity and phylodynamics of SFTSV using the most comprehensive and largest dataset publicly available for a better understanding of SFTSV classification and transmission. A total of 1267 L segments, 1289 M segments, and 1438 S segments collected from China, South Korea, and Japan were included in this study. Maximum likelihood trees were reconstructed to classify the lineages. Discrete phylogeographic analysis was conducted to infer the phylodynamics of SFTSV. We found that the L, M, and S segments were highly conserved, with mean pairwise nucleotide distances of 2.80, 3.36, and 3.35% and could be separated into 16, 13, and 15 lineages, respectively. The evolutionary rate for L, M, and the S segment was 0.61 × 10⁻⁴ (95% HPD: 0.48-0.73 × 10⁻⁴), 1.31 × 10⁻⁴ (95% HPD: 0.77-1.77 × 10⁻⁴) and 1.27 × 10⁻⁴ (95% HPD: 0.65-1.85 × 10⁻⁴) subs/site/year. The SFTSV most likely originated from South Korea around the year of 1617.6 (95% HPD: 1513.1-1724.3), 1700.4 (95% HPD: 1493.7-1814.0), and 1790.1 (95% HPD: 1605.4-1887.2) for L, M, and S segments, respectively. Hubei Province in China played a critical role in the geographical expansion of the SFTSV. The effective population size of SFTSV peaked around 2010 to 2013. We also identified several codons under positive selection in the RdRp, Gn-Gc, and NS genes. By leveraging the largest dataset of SFTSV, our analysis could provide new insights into the evolution and dispersal of SFTSV, which may be beneficial for the control and prevention of severe fever with thrombocytopenia syndrome.
Keywords: diversity; origin; phylodynamics; selective pressure; severe fever with thrombocytopenia syndrome.
© The Author(s) 2024. Published by Oxford University Press.
Conflict of interest statement
None declared.None declared.
Figures

Similar articles
-
Molecular Evolution and Spatial Transmission of Severe Fever with Thrombocytopenia Syndrome Virus Based on Complete Genome Sequences.PLoS One. 2016 Mar 21;11(3):e0151677. doi: 10.1371/journal.pone.0151677. eCollection 2016. PLoS One. 2016. PMID: 26999664 Free PMC article.
-
Molecular genomic characterization of tick- and human-derived severe fever with thrombocytopenia syndrome virus isolates from South Korea.PLoS Negl Trop Dis. 2017 Sep 22;11(9):e0005893. doi: 10.1371/journal.pntd.0005893. eCollection 2017 Sep. PLoS Negl Trop Dis. 2017. PMID: 28937979 Free PMC article.
-
Deciphering the evolutionary landscape of severe fever with thrombocytopenia syndrome virus across East Asia.Virus Evol. 2024 Jul 20;10(1):veae054. doi: 10.1093/ve/veae054. eCollection 2024. Virus Evol. 2024. PMID: 39119138 Free PMC article.
-
[The molecular evolution of Dabie bandavirus (Phenuiviridae: Bandavirus: Dabie bandavirus), the agent of severe fever with thrombocytopenia syndrome].Vopr Virusol. 2022 Jan 8;66(6):409-416. doi: 10.36233/0507-4088-68. Vopr Virusol. 2022. PMID: 35019247 Review. Russian.
-
Severe fever with thrombocytopenia syndrome virus: a highly lethal bunyavirus.Crit Rev Microbiol. 2021 Feb;47(1):112-125. doi: 10.1080/1040841X.2020.1847037. Epub 2020 Nov 27. Crit Rev Microbiol. 2021. PMID: 33245676 Review.
References
-
- Diseases, J.N.I.o.I. Investigation and surveillance of SFTS patients in Japan. 2023a.
-
- Diseases, K.C.f.P.a.C.o. Surveillance data on infectious diseases in Korea. 2023b.
LinkOut - more resources
Full Text Sources
Research Materials
Miscellaneous
