Determination of Site-Specific Phosphorylation Occupancy Using Targeted Mass Spectrometry Reveals the Regulation of Human Apical Bile Acid Transporter, ASBT
- PMID: 39310206
- PMCID: PMC11411523
- DOI: 10.1021/acsomega.4c02999
Determination of Site-Specific Phosphorylation Occupancy Using Targeted Mass Spectrometry Reveals the Regulation of Human Apical Bile Acid Transporter, ASBT
Abstract
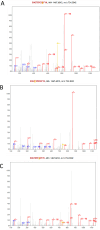
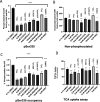
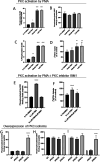
The human apical bile acid transporter (hASBT, SLC10A2) reabsorbs bile acids in the distal ileum, facilitating their recycling to the liver and resecretion. Its activity has been implicated in various disease states, including Crohn's disease, hypercholesterolemia, cholestasis, and type-2 diabetes. Post-translational modifications such as N-glycosylation, ubiquitination, and S-acylation regulate ASBT function by controlling its translocation and stability. However, the precise role of phosphorylation and its relationship with activity remains unknown. Here, we employed parallel reaction monitoring targeted mass spectrometry to investigate ASBT phosphorylation in the presence of various kinase inhibitors and activators. Our study ascertains phosphorylation at multiple sites (Thr330, Ser334, and Ser335), with Ser335 being the predominant phosphosite. We further demonstrate the critical involvement of PKC in regulating ASBT activity by phosphorylation at Ser335. Importantly, we establish a proportional relationship between the phosphorylation level of Ser335 and ASBT bile acid uptake activity. Collectively, our findings shed light on the molecular mechanisms underlying phosphorylation-mediated regulation of ASBT.
© 2024 The Authors. Published by American Chemical Society.
Conflict of interest statement
The authors declare no competing financial interest.
Figures


Similar articles
-
Resveratrol promotes degradation of the human bile acid transporter ASBT (SLC10A2).Biochem J. 2014 Apr 15;459(2):301-12. doi: 10.1042/BJ20131428. Biochem J. 2014. PMID: 24498857
-
S-acylation status of bile acid transporter hASBT regulates its function, metabolic stability, membrane expression, and phosphorylation state.Biochim Biophys Acta Biomembr. 2021 Feb 1;1863(2):183510. doi: 10.1016/j.bbamem.2020.183510. Epub 2020 Nov 13. Biochim Biophys Acta Biomembr. 2021. PMID: 33189717
-
S-acylation modulates the function of the apical sodium-dependent bile acid transporter in human cells.J Biol Chem. 2020 Apr 3;295(14):4488-4497. doi: 10.1074/jbc.RA119.011032. Epub 2020 Feb 18. J Biol Chem. 2020. PMID: 32071081 Free PMC article.
-
An important intestinal transporter that regulates the enterohepatic circulation of bile acids and cholesterol homeostasis: The apical sodium-dependent bile acid transporter (SLC10A2/ASBT).Clin Res Hepatol Gastroenterol. 2017 Oct;41(5):509-515. doi: 10.1016/j.clinre.2017.02.001. Epub 2017 Mar 21. Clin Res Hepatol Gastroenterol. 2017. PMID: 28336180 Review.
-
Bile acid interactions with cholangiocytes.World J Gastroenterol. 2006 Jun 14;12(22):3553-63. doi: 10.3748/wjg.v12.i22.3553. World J Gastroenterol. 2006. PMID: 16773712 Free PMC article. Review.
References
-
- Xiao L.; Pan G. An important intestinal transporter that regulates the enterohepatic circulation of bile acids and cholesterol homeostasis: The apical sodium-dependent bile acid transporter (SLC10A2/ASBT). Clin. Res. Hepatol. Gastroenterol. 2017, 41 (5), 509–515. 10.1016/j.clinre.2017.02.001. - DOI - PubMed
LinkOut - more resources
Full Text Sources
