. 2024 Aug 30;27(9):110851.
doi: 10.1016/j.isci.2024.110851. eCollection 2024 Sep 20.

eIF2B localization and its regulation during the integrated stress response is cell-type specific

Affiliations

eIF2B localization and its regulation during the integrated stress response is cell-type specific

Filipe M Hanson et al. iScience. .

Abstract

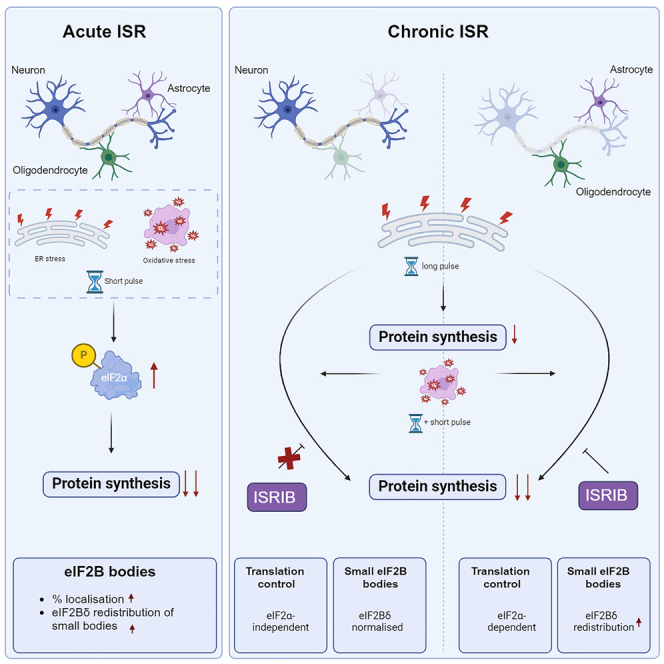
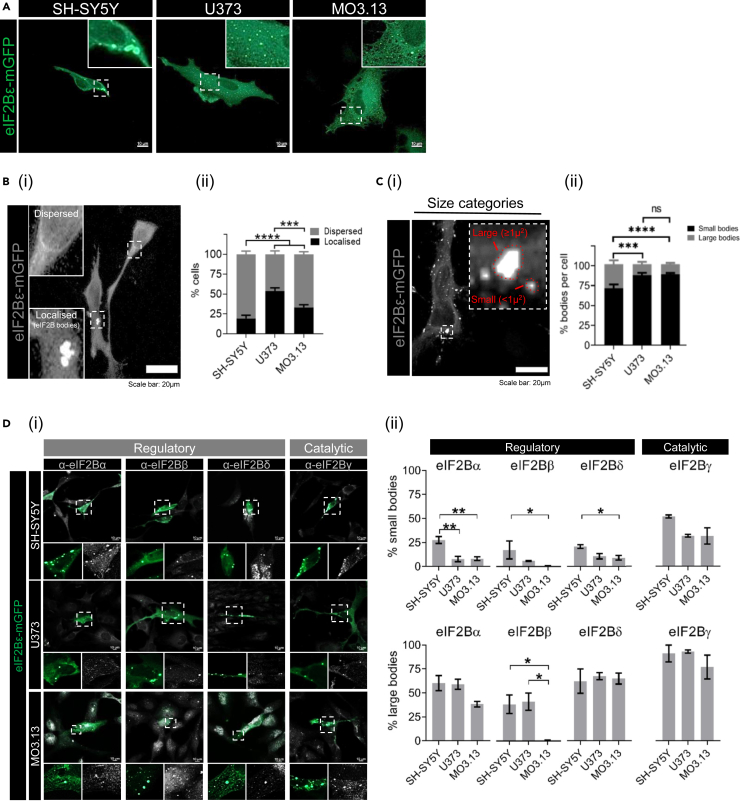
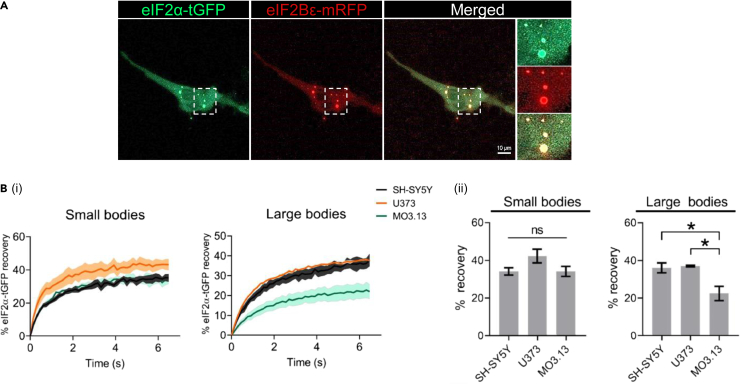
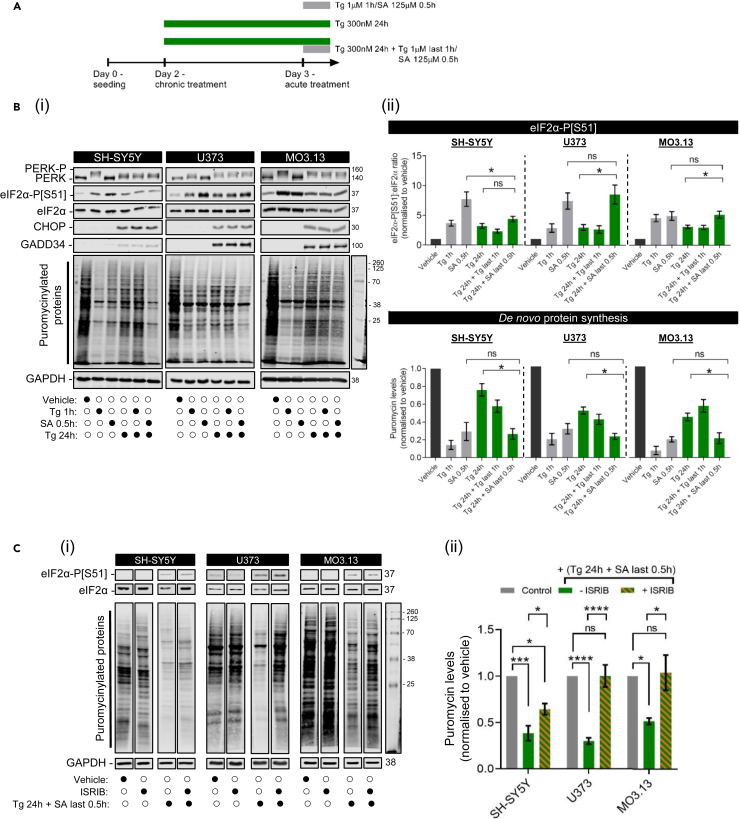
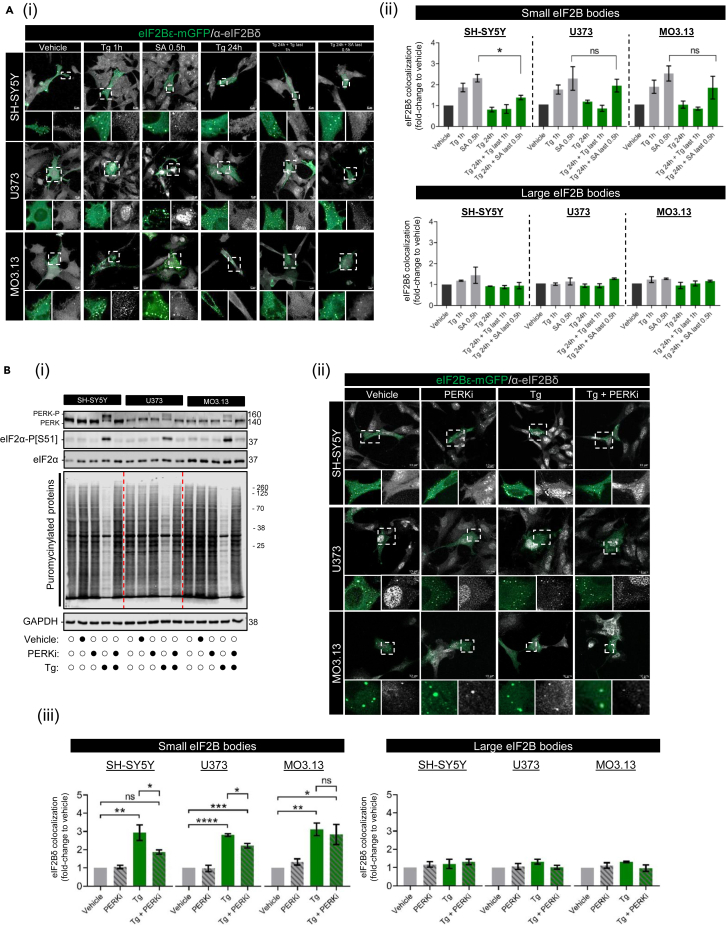
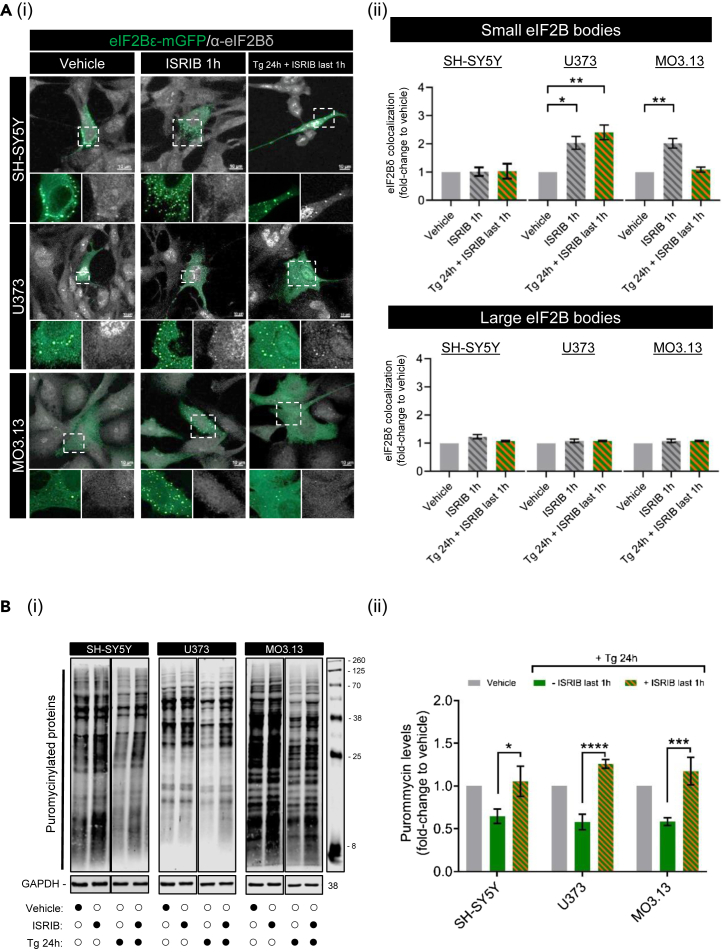
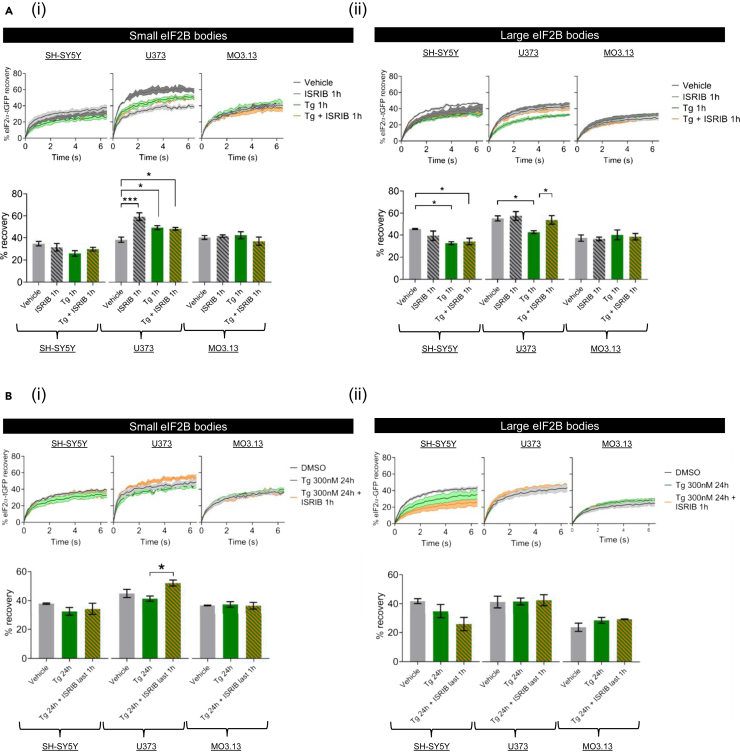
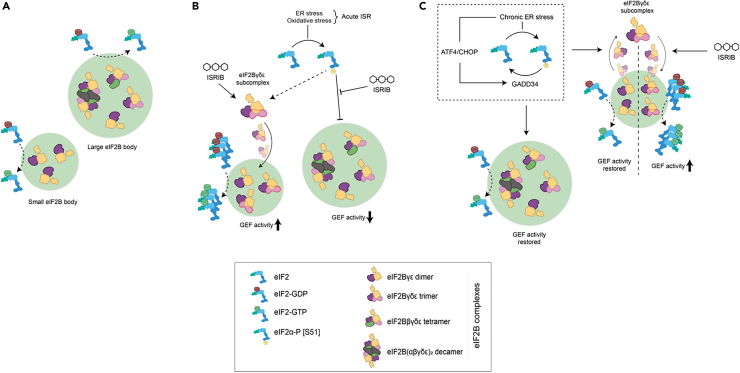
Eukaryotic initiation factor 2B (eIF2B) controls translation initiation by recycling inactive eIF2-GDP to active eIF2-GTP. Under cellular stress, the integrated stress response (ISR) is activated inhibiting eIF2B activity resulting in the translation attenuation and reprogramming of gene expression to overcome the stress. The ISR can dictate cell fate wherein chronic activation has pathological outcomes. Vanishing white matter disease (VWMD) is a chronic ISR-related disorder with mutations in eIF2B targeting astrocyte and oligodendrocyte cells. Regulation of eIF2B localization (eIF2B bodies) has been implicated in the ISR. We present evidence that neuronal and glial cell types possess distinct patterns of eIF2B bodies which change in a manner correlating to acute and chronic ISR activation. We also demonstrate that while neural and glial cell types respond similarly to the acute induction of the ISR a chronic ISR exerts cell-type specific differences. These findings provide key insights into neural cell responses and adaptation to cellular stress.

Keywords: Biological sciences; Cell; Molecular biology.


Conflict of interest statement

For the purpose of open access, the author has applied a Creative Commons Attribution (CC BY) license to any Author Accepted article version of this article arising from this submission. The authors have no relevant financial or non-financial interests to disclose. The author Dr Filipe Hanson completed this work as part of his PhD studies at Sheffield Hallam University. He now works as a Research Scientist for UCB Pharma, Slough, UK. The author Dr Madalena deOliveira contributed to this work as part of her PhD studies at Sheffield Hallam University. She now works as a Postdoctoral Fellow for MSD, UK.

Figures

None
Graphical abstract
Figure 1
Figure 1
eIF2B localization is cell-type specific (A) SH-SY5Y, U373, and MO3.13 cells subjected to transient transfection and expressing eIF2Bε-mGFP. Scale bar: 10 μm. (B) (i) Cells express dispersed eIF2B or localized eIF2B (eIF2B bodies). (ii) Mean percentage of cells displaying dispersed eIF2B or localized eIF2B in a population of 100 transfected cells (mean ± SEM; N = 4; ∗∗∗∗p ≤ 0.001, ∗∗∗p ≤ 0.001 according to two-way ANOVA). (C) (i) eIF2B bodies were categorized as small bodies (<1μ2) and large bodies (≥1μ2). (ii) Within the transfected cells exhibiting localized eIF2B, the mean percentage of small and large eIF2B bodies in a population of 50 cells (mean ± SEM; N = 3; ∗∗∗∗p ≤ 0.001, ∗∗∗p ≤ 0.001, ns: non-significant according to two-way ANOVA). (D) (i) Confocal images of SH-SY5Y, U373 and MO3.13 expressing eIF2Bε-mGFP and immunolabelled with primary anti-eIF2Bα, anti-eIF2Bβ, anti-eIF2Bδ and anti-eIF2Bγ. Scale bar: 10 μm. (ii) Mean percentage of small (top panel) and large bodies (bottom panel) co-localizing with eIF2B(α-γ) subunits of at least 30 cells per repeat (mean ± SEM; N = 3; ∗∗p ≤ 0.01, ∗p < 0.05 according to one-way ANOVA).
Figure 2
Figure 2
eIF2 shuttling of eIF2B bodies is cell-type specific Cells were co-transfected with eIF2α-tGFP to carry out fluorescence recovery after photo bleaching (FRAP) analysis, and eIF2Bε-mRFP to locate the eIF2B body. (A) Representative live cell imaging of a cell co-expressing eIF2α-tGFP and eIF2Bε-RFP. Scale bar: 10 μm. (B) (i) Quantification of normalized FRAP curves for eIF2α-tGFP of at least 10 bodies of each size category of SH-SY5Y, U373, and MO3.13 cells. The data were graphed and shown as the mean and SEM bands (N=3). (ii) Mean percentage of eIF2α-tGFP recovery determined from normalized FRAP curves (mean ± SEM; N = 3; ∗p < 0.05 according to one-way ANOVA).
Figure 3
Figure 3
ER stress-preconditioned cells do not respond to additional acute ER stress treatment but do respond to acute oxidative stress in a cell type manner (A) Schematic diagram of stress treatments. (B) (i) Representative Western blot of the ISR expression profile (PERK-P, PERK, eIF2α-P[S51], pan-eIF2α, CHOP, and GADD34) and global newly synthesized proteins (puromycin incorporation assay) in SH-SY5Y, U373 and MO3.13 cells treated with vehicle (DMSO), acute stress inducers (Tg 1 μM for 1h and SA 125 μM for 30 min) or chronic ER stress (Tg 300 nM for 24h) subsequently challenged with previously described acute stress treatments. (ii) Mean expression levels of eIF2α-P[S51] normalized to total eIF2α levels (top panel) and puromycin-labeled nascent proteins normalized to housekeeping GAPDH levels (bottom panel) upon the previously described stress conditions. Fold-change relative to vehicle-treated cells was calculated and analyzed using one-way ANOVA (mean ± SEM; N = 3–9; ∗p < 0.05, ns: non-significant). Chronic ER stress conditions are highlighted in green. (C) (i) Representative Western blot of eIF2α-P[S51], pan-eIF2α, and global newly synthesized proteins (puromycin incorporation assay) in SH-SY5Y, U373, and MO3.13 cells treated with ISRIB (200nM) for 1h alone, Tg 300 nM for 24h added with SA 125 μM in the last 30min, or combination of both. DMSO for 24h was used as a vehicle. (ii) Mean expression levels of puromycin-labeled nascent proteins normalized to housekeeping GAPDH levels. Fold-change relative to vehicle-treated cells was calculated and analyzed using one-way ANOVA (mean ± SEM; N = 3–4; ∗∗∗∗p ≤ 0.001, ∗∗∗p ≤ 0.001, ∗p < 0.05, ns: non-significant).
Figure 4
Figure 4
eIF2Bδ remodeling of small eIF2B bodies is transient during cellular stress and partially dictated by eIF2α-P[S51] in a cell type dependent manner (A) (i) Confocal images of SH-SY5Y, U373, and MO3.13 expressing eIF2Bε-mGFP and immunolabelled with anti-eIF2Bδ subjected to acute stress inducers (Tg 1 μM for 1h and SA 125 μM for 30min) or chronic ER stress (Tg 300 nM for 24h) subsequently challenged with previously described acute stress treatments. Scale bar: 10 μm. (ii) Mean percentage of eIF2Bε-mGFP-containing small (top panel) and large (bottom panel) bodies co-localizing with eIF2Bδ of a population of 30 cells per biological repeat. Fold-change relative to vehicle-treated cells was calculated and analyzed using one-way ANOVA (mean ± SEM; ∗p < 0.05; ns, non-significant). (B) (i) Representative Western blots of the ISR expression profile (PERK-P, PERK, eIF2α-P[S51], pan-eIF2α, CHOP, and GADD34), global newly synthesized proteins (puromycin incorporation assay) and loading control GAPDH in SH-SY5Y, U373 and MO3.13 cells treated with vehicle (DMSO), GSK2606414/PERKi (500 nM), Tg (1μM) or co-treated with PERKi and Tg (PERKi + Tg) for 1h. (ii) Confocal images of SH-SY5Y, U373 and MO3.13 cells expressing eIF2Bε-mGFP and immunolabelled with primary anti-eIF2Bδ subjected to previous treatments. Scale bar: 10 μm. (iii) Mean percentage of eIF2Bε-mGFP-containing small (left panel) and large (right panel) bodies co-localizing with eIF2Bδ of a population of 30 cells per biological repeat. Fold-change relative to vehicle-treated cells was calculated and analyzed using one-way ANOVA (mean ± SEM; N = 3; ∗p < 0.05).
Figure 5
Figure 5
ISRIB restores translation during chronic ER stress while increasing the eIF2Bδ composition of small eIF2B bodies predominantly in astrocytic cells (A) (i) Confocal images of SH-SY5Y, U373, and MO3.13 expressing eIF2Bε-mGFP and immunolabelled with primary anti-eIF2Bδ subjected to ISRIB (200nM) alone 1h or in combination with preconditioned chronic ER stress treatment (Tg 300nM 24h + ISRIB last 1h). Scale bar: 10 μm. (ii) Mean percentage of eIF2Bε-mGFP-containing small (top panel) and large (bottom panel) bodies co-localizing with eIF2Bδ. Fold-change relative to vehicle-treated cells was calculated and analyzed using one-way ANOVA (mean ± SEM; N = 3; ∗∗p ≤ 0.01, ∗p < 0.05). (B) (i) Western blotting of global newly synthesized proteins (puromycin incorporation assay) and loading control GAPDH in SH-SY5Y, U373, and MO3.13 cells treated with the same conditions as described previously. (ii) Mean expression levels of puromycin-labeled nascent proteins normalized to housekeeping GAPDH levels. Fold-change relative to vehicle-treated cells was calculated and analyzed using one-way ANOVA (mean ± SEM; N = 5–9; ∗∗∗∗p ≤ 0.001, ∗∗∗p ≤ 0.001, ∗p < 0.05).
Figure 6
Figure 6
ISRIB modulates the eIF2 shuttling of eIF2B bodies in astrocytic cells Cells were co-transfected with eIF2α-tGFP to carry out fluorescence recovery after photobleaching (FRAP) analysis, and eIF2Bε-mRFP to locate the eIF2B body. (A) Cells were then treated with vehicle (DMSO), ISRIB (200 nM) alone for 1h, Tg (1 μM) alone for 1h or both treatments in combination (Tg + ISRIB) for 1h. Quantification of normalized FRAP curves for eIF2α-tGFP of at least 10 bodies of small (right panel) and large (left panel) eIF2Bε-mRFP bodies of SH-SY5Y, U373, and MO3.13 cells. The data were graphed and shown as the mean and S.E.M. bands (N=3). The mean percentage of eIF2α-tGFP recovery was determined from normalized FRAP curves (mean ± SEM; N = 3; ∗∗∗p ≤ 0.001, ∗p < 0.05 according to one-way ANOVA). (B) Cells were then treated with vehicle (DMSO), Tg (300nM) alone for 24h or both treatments in combination where ISRIB was added in the last hour of the 24h period of exposure to Tg. Quantification of normalized FRAP curves for eIF2α-tGFP of at least 10 bodies of small (right panel) and large (left panel) eIF2Bε-mRFP bodies of SH-SY5Y, U373, and MO3.13 cells. The data were graphed and shown as the mean and S.E.M. bands (N=3). Mean percentage of eIF2α-tGFP recovery was determined from normalized FRAP curves (mean ± SEM; N = 3; ∗∗∗p ≤ 0.001, ∗p < 0.05 according to one-way ANOVA).
Figure 7
Figure 7
Working model for the impact of cellular stress and ISRIB in eIF2B bodies of astrocytes (A) eIF2B localizes to small eIF2B bodies containing catalytic subcomplexes and larger eIF2B bodies containing a variety of regulatory subcomplexes (including decameric eIF2B). (B) Upon the activation of the acute ISR program, eIF2Bγδε subcomplexes are formed and localized to small eIF2B bodies which we hypothesize to have a regulatory role in eIF2B GEF activity; whilst large eIF2B bodies are negatively impacted. (C) During the transition to a chronic ISR, eIF2Bδ distribution in small bodies is reversed and GEF activity is restored to basal rates, whereas ISRIB treatment bypasses transient eIF2Bδ distribution by prompting extended eIF2Bγδε formation by direct interaction with eIF2Bδ.

Similar articles

Cited by

References

    1. Naveau M., Lazennec-Schurdevin C., Panvert M., Dubiez E., Mechulam Y., Schmitt E. Roles of yeast eIF2alpha and eIF2beta subunits in the binding of the initiator methionyl-tRNA. Nucleic Acids Res. 2013;41:1047–1057. doi: 10.1093/nar/gks1180. - DOI - PMC - PubMed
    1. Schmitt E., Panvert M., Lazennec-Schurdevin C., Coureux P.D., Perez J., Thompson A., Mechulam Y. Structure of the ternary initiation complex aIF2-GDPNP-methionylated initiator tRNA. Nat. Struct. Mol. Biol. 2012;19:450–454. doi: 10.1038/nsmb.2259. - DOI - PubMed
    1. Hinnebusch A.G., Lorsch J.R. The mechanism of eukaryotic translation initiation: new insights and challenges. Cold Spring Harbor Perspect. Biol. 2012;4:a011544. doi: 10.1101/cshperspect.a011544. - DOI - PMC - PubMed
    1. Paulin F.E., Campbell L.E., O'Brien K., Loughlin J., Proud C.G. Eukaryotic translation initiation factor 5 (eIF5) acts as a classical GTPase-activator protein. Curr. Biol. 2001;11:55–59. doi: 10.1016/s0960-9822(00)00025-7. - DOI - PubMed
    1. Jennings M.D., Zhou Y., Mohammad-Qureshi S.S., Bennett D., Pavitt G.D. eIF2B promotes eIF5 dissociation from eIF2∗GDP to facilitate guanine nucleotide exchange for translation initiation. Genes Dev. 2013;27:2696–2707. doi: 10.1101/gad.231514.113. - DOI - PMC - PubMed

LinkOut - more resources