. 2024 Aug 30;27(9):110854.
doi: 10.1016/j.isci.2024.110854. eCollection 2024 Sep 20.

Smyd3-mediated immuno-modulation in HPV-negative head and neck squamous cell carcinoma mouse models

Affiliations

Smyd3-mediated immuno-modulation in HPV-negative head and neck squamous cell carcinoma mouse models

Daniel E Tsai et al. iScience. .

Abstract

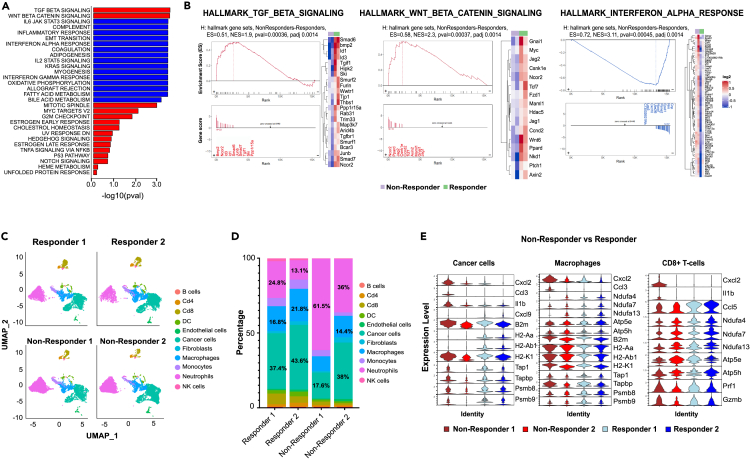
SET and MYND-domain containing protein 3 (SMYD3) mediates epigenetic repression of type I IFN response genes in human papillomavirus (HPV)-negative HNSCC cells, and Smyd3 depletion using anti-sense oligonucleotides (ASOs) increases the sensitivity of syngeneic mouse oral carcinoma (MOC1) models to anti-PD-1 therapy. In this study, we utilized single-cell RNA-seq of MOC1 tumors treated with Smyd3 ASOs and found enrichment of type I IFN response pathways in cancer cells, a shift of CD8+ T-cells toward an activated/memory phenotype, and a shift of neutrophils toward an anti-tumorigenic phenotype. Mechanisms of resistance to the Smyd3 ASO and anti-PD-1 combination were derived from cancer cells, macrophages, and CD8+ T-cells, including neutrophil enrichment through the upregulation of Cxcl2, repression of Cxcl9, and defective antigen presentation. This study sheds light on the immunomodulatory functions of Smyd3 in vivo and provides insight into actionable mechanisms of resistance to improve the efficacy of Smyd3 ASOs and anti-PD-1 combination.

Keywords: Cell biology; Immunology; Microenvironment.


Conflict of interest statement

Xiaolin Luo was an employee of Ionis Pharmaceuticals Inc during this study. The other authors declare no competing interests.

Figures

None
Graphical abstract
Figure 1
Figure 1
Single cell RNA-sequencing of MOC1 tumors treated with Smyd3 ASOs reveals distinct cancer and immune cell types and differential efficacy of Smyd3 ASOs based on cell type (A) Design of mouse experiment. Flank MOC1 tumors were established in C57BL/6 mice, and control or Smyd3 ASO treatment was started with subcutaneous injections. 3 tumors were treated per condition. Mice were sacrificed and tumors harvested 24 days post-implantation (18 days of treatment). (B) UMAP embedding showing 24,400 single cells obtained from MOC1 tumors treated with control (n = 3) or Smyd3 ASOs (n = 3) for 18 days. Cell types were identified using clustering and marker gene expression analysis. (C) Log2 fold change of Smyd3 mRNA levels in individual cell types of MOC1 tumors treated with Smyd3 or control ASOs. ∗p < 0.05, adjusted p-value.
Figure 2
Figure 2
Smyd3 ASO treatment of cancer cells in MOC1 tumors induces the enrichment of type I IFN response pathways and sensitizes MOC1 tumors to anti-PD-1 therapy (A) UMAP of cancer cells. Single-cell RNA sequencing was conducted in control (n = 3) and Smyd3 (n = 3) ASO treated MOC1 tumors. Three distinct transcriptomic clusters were identified: inflamed, mesenchymal/classical, and classical cluster. (B) Dotplot of selected gene markers characterizing each cancer cell cluster. (C) GSEA of all cancer cells of MOC1 tumors treated with Smyd3 versus control ASOs. Enrichment scores (ES) of Gene Ontology Biological Processes (GOBP) gene sets are shown. Red bars indicate positive enrichment; blue bars indicate negative enrichment. (D) Dotplots showing expression of type I IFN response and antigen presentation machinery (APM) genes in cancer cells of MOC1 tumors treated with control or Smyd3 ASOs. (E) Average tumor volume growth curves of NC2 and KO10 (left curve) or NC2 and K013 tumors (right curve) treated with anti-PD-1. C57BL/6 mice were injected with NC2 and KO10 or NC2 and KO13 cells in the right flank, and, once they reached an average tumor volume of 0.01cm3, treatment with anti-PD-1 was started. Number of mice per group is shown in parentheses (N). Data are represented as mean ± SEM. NC2/KO10: unpaired t-test, ∗∗p = 0.002, NC2/KO13: unpaired t-test, ∗p = 0.01.
Figure 3
Figure 3
Smyd3 KO in the cancer cell compartment of MOC1 tumors induces an influx of CD8+ T-cells which are necessary for the anti-tumor efficacy of anti-PD-1 therapy (A–E) Multicolor flow cytometry of control (NC2) and Smyd3 KO (KO13) MOC1 tumors treated or not with anti-PD-1. C57BL/6 mice were injected with NC2 and KO13 cells in the right flank, and, once they reached an average tumor volume of 0.01cm3, treatment with anti-PD-1 was started. 34 days after tumor implantation, mice were sacrificed, and tumors were surgically resected and processed into single-cell suspensions. Cell suspensions were stained with antibodies and multicolor flow cytometry was conducted (day 34 post-tumor implantation, n = 4 per group). Data are represented as mean ± SEM. NC2: control, KO13: Smyd3 KO. (A) % of CD45CD31-PDGFR-H-2Kb+ or PD-L1+ MOC1 cells, (B) % of CD3+ CD45+ cells, (C) % of CD3+CD8+ and CD3+CD8+/PD-1+ of CD45+ cells, (D) % CD3+CD4+ of CD45+ cells, (E) % of CD11b+/CD11c-/F4/80- of CD45+ cells. Unpaired t-tests between NC2 and KO13 or NC2 + anti-PD-1 and KO13 + anti-PD-1 conditions: ∗p < 0.05, ∗∗p < 0.01, ∗∗∗p < 0.001. (F) CD8+ T cell depletion abrogates the anti-tumor efficacy of anti-PD-1 in Smyd3 KO MOC1 tumors. C57BL/6 mice were injected with NC2 and KO10 cells in the right flank, and, once they reached an average tumor volume of 0.01cm3, mice were randomized into three groups, and treatment with anti-PD-1, anti-PD-1, and anti-CD8 or anti-PD-1 and anti-CD4 was started. Unpaired t-test, ∗p = 0.039.
Figure 4
Figure 4
Smyd3 ASO treatment of CD8+ T-cells in MOC1 tumors induces a shift toward an activated/memory phenotype (A) UMAP embedding of T-cells colored by cluster identity in MOC1 tumors treated with control or Smyd3 ASOs (n = 3 per condition). (B) Dot plot showing relative expression of selected T cell genes across identified T cell clusters. Circle color corresponds to scaled average expression; circle size denotes the fraction of cells with non-zero gene expression of the corresponding gene. (C) GSEA of all CD8+ T-cells of MOC1 tumors treated with Smyd3 versus control ASOs. Enrichment scores (ES) of GOBP gene sets are shown. Red bars indicate positive enrichment; blue bars indicate negative enrichment. (D) Violin plots of selected genes expressed in cluster (2) of exhausted CD8+ T-cells and in cluster 7 of central memory/progenitor CD8+ T-cells. (E) GSEA analysis of all CD4+ T-cells in MOC1 tumors treated with Smyd3 versus control ASOs. Enrichment scores (ES) of GOBP gene sets are shown. Red bars indicate positive enrichment; blue bars indicate negative enrichment. (F) Violin plots of selected genes expressed in cluster (5) of Th1 CD4+ T-cells and in cluster 0 of Treg CD4+ T-cells.
Figure 5
Figure 5
Smyd3 ASOs enhance neutrophil activation pathways but may promote an M2 macrophage phenotype in MOC1 tumors (A) UMAP embedding of neutrophils colored by cluster identity in MOC1 tumors treated with control or Smyd3 ASOs (n = 3 per condition). (B) Dot plot showing relative expression of selected genes across identified neutrophil clusters. Circle color corresponds to scaled average expression; circle size denotes the fraction of cells with non-zero gene expression of the corresponding gene. (C) GSEA of all neutrophil clusters of MOC1 tumors treated with Smyd3 versus control ASOs. Enrichment scores (ES) of GOBP gene sets are shown. Red bars indicate positive enrichment; blue bars indicate negative enrichment. (D) Violin plots of selected genes associated with N2 neutrophil differentiation expressed in all neutrophil clusters. (E) GSEA of all mononuclear myeloid cells of MOC1 tumors treated with Smyd3 versus control ASOs. Enrichment scores (ES) of GOBP gene sets are shown. Red bars indicate positive enrichment; blue bars indicate negative enrichment. (F) Dotplot showing relative expression of selected genes across identified mononuclear myeloid clusters. (G) Violin plots of selected genes expressed associated with M2 neutrophil differentiation expressed in all mononuclear myeloid clusters.
Figure 6
Figure 6
Combined Smyd3 ASO and anti-PD-1 treatment induces an inflammatory tumor microenvironment in MOC1 tumors (A) Design of mouse experiment. Flank MOC1 tumors were established in C57BL/6 mice, and control or Smyd3 ASO treatment combined with anti-PD-1 was started with subcutaneous and intraperitoneal injections respectively. MOC1 tumors were captured after 32 days of treatment (day 42 post-implantation). Graph shows the average tumor size of 3 tumors per condition that underwent bulk RNA-seq. Student’s t test, ∗∗∗p = 0.0002. (B) GSEA of MOC1 tumors treated with control or Smyd3 ASOs and anti-PD-1 reveals enrichment with inflammation-related Hallmark pathways. The x axis represents –log10 (p-values). Red bars indicate positive enrichment; blue bars indicate negative enrichment. (C) Interferon α and γ response Hallmark pathways are upregulated in MOC1 tumors treated with Smyd3 ASOs and anti-PD-1 compared to control ASOs and anti-PD-1. (D) Heatmaps of chemokines/cytokines, exhaustion, and T cell activation checkpoints and their respective receptors in MOC1 tumors treated with Smyd3 (n = 3) or control ASOs (n = 3) and anti-PD-1.
Figure 7
Figure 7
Non-responder MOC1 tumors exhibit variable mechanisms of resistance to Smyd3 ASOs and anti-PD-1 (A) GSEA using Hallmark gene sets is shown. The x axis represents –log10 (p-values). The red bars indicate pathways positively enriched in non-responder MOC1 tumors, while the blue bars indicate pathways negatively enriched in non-responder MOC1 tumors compared to responder MOC1 tumors (n = 2). (B) Hallmark pathways and associated heatmaps enriched in non-responders compared to responder MOC1 tumors treated with Smyd3 ASOs and anti-PD-1. (C) UMAP of MOC1 non-responders (1 and 2) and responders (1 and 2) to Smyd3 ASOs and anti-PD-1 treatment. (D) Percentage of cell types in responder and non-responder MOC1 tumors. (E) Violin plots showing genes among the top 30 that were found differentially expressed in non-responder compared to responder MOC1 tumors.

References

    1. Siegel R.L., Miller K.D., Jemal A. Cancer statistics, 2018. CA A Cancer J. Clin. 2018;68:7–30. doi: 10.3322/caac.21442. - DOI - PubMed
    1. Ang K.K., Sturgis E.M. Human papillomavirus as a marker of the natural history and response to therapy of head and neck squamous cell carcinoma. Semin. Radiat. Oncol. 2012;22:128–142. doi: 10.1016/j.semradonc.2011.12.004. - DOI - PubMed
    1. Burtness B., Harrington K.J., Greil R., Soulières D., Tahara M., de Castro G., Jr., Psyrri A., Basté N., Neupane P., Bratland Å., et al. Pembrolizumab alone or with chemotherapy versus cetuximab with chemotherapy for recurrent or metastatic squamous cell carcinoma of the head and neck (KEYNOTE-048): a randomised, open-label, phase 3 study. Lancet. 2019;394:1915–1928. doi: 10.1016/s0140-6736(19)32591-7. - DOI - PubMed
    1. Cao J., Yan Q. Cancer Epigenetics, Tumor Immunity, and Immunotherapy. Trends Cancer. 2020;6:580–592. doi: 10.1016/j.trecan.2020.02.003. - DOI - PMC - PubMed
    1. Peng D., Kryczek I., Nagarsheth N., Zhao L., Wei S., Wang W., Sun Y., Zhao E., Vatan L., Szeliga W., et al. Epigenetic silencing of TH1-type chemokines shapes tumour immunity and immunotherapy. Nature. 2015;527:249–253. doi: 10.1038/nature15520. - DOI - PMC - PubMed