. 2024 Sep 3;27(9):110880.
doi: 10.1016/j.isci.2024.110880. eCollection 2024 Sep 20.

mCAUSE: Prioritizing mitochondrial targets that alleviate pancreatic cancer cell phenotypes

Affiliations

mCAUSE: Prioritizing mitochondrial targets that alleviate pancreatic cancer cell phenotypes

Daisuke Murata et al. iScience. .

Erratum in

Abstract

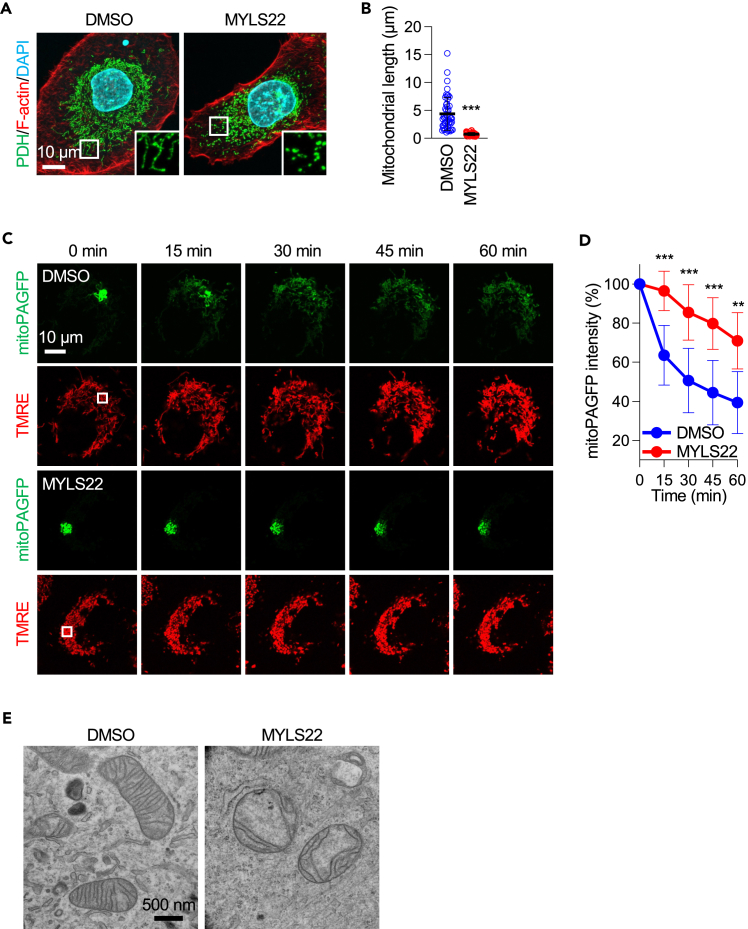
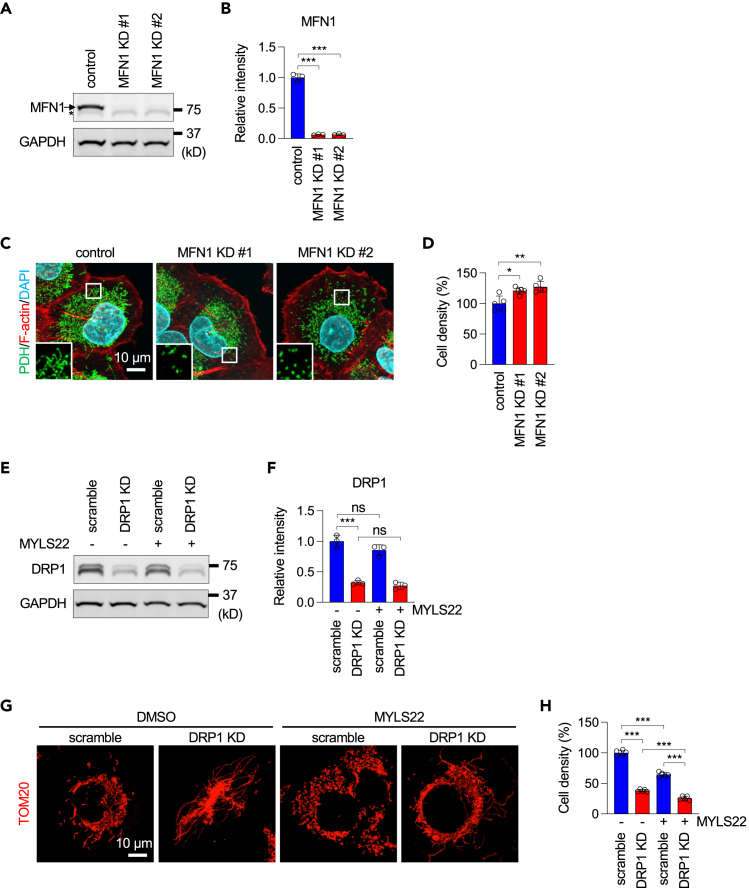
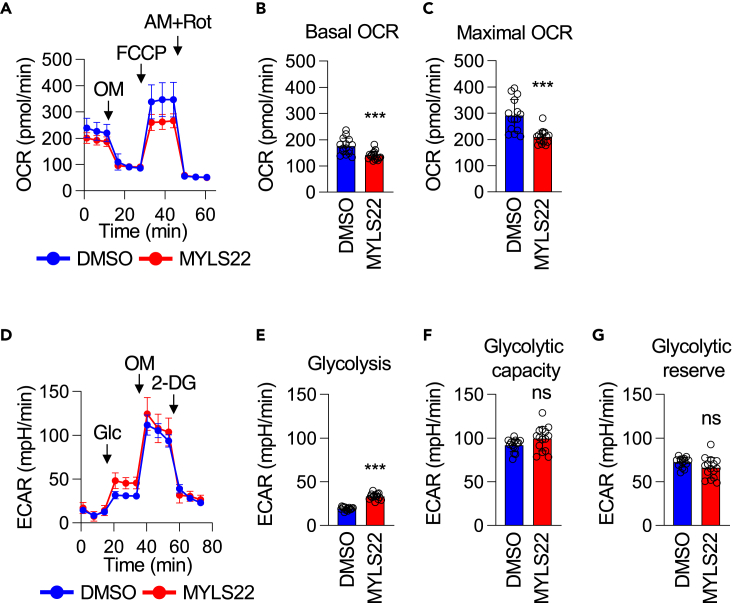
Substantial changes in energy metabolism are a hallmark of pancreatic cancer. To adapt to hypoxic and nutrient-deprived microenvironments, pancreatic cancer cells remodel their bioenergetics from oxidative phosphorylation to glycolysis. This bioenergetic shift makes mitochondria an Achilles' heel. Since mitochondrial function remains essential for pancreatic cancer cells, further depleting mitochondrial energy production is an appealing treatment target. However, identifying effective mitochondrial targets for treatment is challenging. Here, we developed an approach, mitochondria-targeted cancer analysis using survival and expression (mCAUSE), to prioritize target proteins from the entire mitochondrial proteome. Selected proteins were further tested for their impact on pancreatic cancer cell phenotypes. We discovered that targeting a dynamin-related GTPase, OPA1, which controls mitochondrial fusion and cristae, effectively suppresses pancreatic cancer activities. Remarkably, when combined with a mutation-specific KRAS inhibitor, OPA1 inhibition showed a synergistic effect. Our findings offer a therapeutic strategy against pancreatic cancer by simultaneously targeting mitochondria dynamics and KRAS signaling.

Keywords: Cancer; Cell biology; Molecular biology.


Conflict of interest statement

AJE has unlicensed patents related to keratin 14 as a prognostic marker and antibody strategy for anti-cancer therapeutics. AJE is a consultant for BioNTech. AJE’s spouse is an employee of ImmunoCore.

Figures

None
Graphical abstract
Figure 1
Figure 1
Mitochondria-targeted cancer analysis using survival and expression (A) Out of 25,000 proteins in the human proteome, MitoCarta3.0 identified 1136 mitochondrial proteins. Of these, 219 mito-genes exhibited a significant difference in hazard ratio (HR). Specifically, 45 mito-genes were associated with decreased survival in patients with pancreatic cancer when expressed at increased levels. Among these, category A includes 39 genes expressed at higher levels in tumors than in normal tissues. In contrast, when expressed at increased levels, 174 mito-genes were associated with better survival. Category C includes 72 of these genes that are also expressed at higher levels in tumors, while category D comprises 17 genes that are expressed at lower levels in tumors. GO enrichment analysis was performed by PANTHER with Bonferroni correction. Biological processes with a p-value less than 0.05 and greater than 20-fold enrichment are presented. (B and C) PANC-1 cells (B) and MIA PaCa-2 cells (C) were cultured in the presence of the indicated inhibitors for 72 h. Cell density was determined using a crystal violet assay (mean ± SD, n 10). ANOVA with post-hoc Tukey: ∗p < 0.05, ∗∗∗p < 0.001.
Figure 2
Figure 2
MYLS22 blocks mitochondrial fusion and disorganizes inner membrane cristae (A) Mitochondrial morphology. PANC-1 cells were treated with DMSO or MYLS22 for 24 h and subjected to laser confocal immunofluorescence microscopy with anti-PDH antibodies. The boxed regions are magnified. (B) Quantification of mitochondrial length (mean ± SD, n = 50). (C) Mitochondrial fusion. PANC-1 cells expressing mitoPAGFP were incubated with DMSO or MYLS22 for 24 h. Subsequently, cells were stained with 5 nM TMRE. MitoPAGFP was photoactivated using a 405 nm laser in a small region indicated by a square at 0 min. Observations were made at 15-min intervals over 60 min. (D) The fluorescence intensity of mitoPAGFP in the photoactivated region was quantified (mean ± SD, n > 9). (E) PANC-1 cells were treated with DMSO or MYLS22 for 24 h and subjected to transmission electron microscopy. Student’s t-test in (B) and ANOVA followed by Šídák’s test in (D): ∗∗p < 0.01, ∗∗∗p < 0.001.
Figure 3
Figure 3
Mitochondrial fusion is dispensable for cell proliferation (A) Western blotting of PANC-1 cells treated with non-targeting control or two different MFN1 siRNAs for 5 days. An arrow and an asterisk indicate MFN1 and non-specific bands, respectively. (B) Quantification of band intensity (mean ± SD, n = 3). (C) PANC-1 cells were transfected with the indicated siRNAs and subjected to laser confocal immunofluorescence microscopy with anti-PDH antibodies. The boxed regions are magnified. (D) Cell proliferation of the transfectants was examined by a crystal violet assay (mean ± SD, n = 5). (E) PANC-1 cells were infected with lentiviruses expressing scramble or DRP1 shRNAs and then treated with DMSO or MYLS22 for 24 h. Knockdown of DRP1 was confirmed by Western blotting. (F) Quantification of band intensity (mean ± SD, n = 3). (G) Mitochondria were analyzed by immunofluorescence microscopy with anti-TOM20 antibodies. (H) Cell proliferation was analyzed by a crystal violet assay (mean ± SD, n = 5). ANOVA with post-hoc Tukey in (B, D, F, H): ∗p < 0.05, ∗∗∗p < 0.01, ∗∗∗p < 0.001.
Figure 4
Figure 4
Cristae are important for cell proliferation (A) Western blotting of PANC-1 cells treated with non-targeting control or two different MIC60 siRNAs for 5 days. (B) Quantification of band intensity (mean ± SD, n = 3). (C) Mitochondria were analyzed in PANC-1 cells transfected with the indicated siRNAs by electron microscopy. (D) PANC-1 cells were transfected with the indicated siRNAs. Cell proliferation was assessed using a crystal violet assay (mean ± SD, n = 5). (E) Mitochondria were analyzed in PANC-1 cells treated with DMSO or 10 μM miclxin by electron microscopy. (F) PANC-1 cells were cultured with 0–50 μM miclxin for 72 h. Cell density was assessed using a crystal violet assay (mean ± SD, n = 5). ANOVA with post-hoc Tukey in (B, D): ∗∗∗p < 0.001.
Figure 5
Figure 5
MYLS22 alters energy metabolism (A) Mitochondrial respiration was analyzed by measuring the OCRs in PANC-1 cells treated with MYLS22. (B and C) Both basal and maximal OCRs are presented (mean ± SD, n = 15). (D–G) Glycolysis was assessed by measuring the ECARs in the same set of cells. Basal glycolysis (E), glycolytic capacity (F), and glycolytic reserve (G) are shown (mean ± SD, n = 13). Student’s t-test in (B, C, E, F, G): ∗∗∗p < 0.001.
Figure 6
Figure 6
OPA1 inhibition suppresses spheroid growth and cell migration (A) Spheroid growth. Spheroids of PANC-1 cells were cultured in Geltrex for 7 days in the presence of DMSO or 50 μM MYLS22. (B) Quantification of the total and invasion areas (mean ± SD, n > 20). (C) Cell migration. Motility of PANC-1 cells was analyzed using a wound-healing assay. Representative images at 0 h and 72 h are shown. (D) Wound closure was assessed by determining the relative width over the initial width (mean ± SD, n = 5). Student’s t-test in (B, D): ∗∗p < 0.01, ∗∗∗p < 0.001.
Figure 7
Figure 7
MYLS22 promotes the phosphorylation of AKT and ERK in a KRAS-dependent manner (A) PANC-1 cells were treated with DMSO, MRTX1133, MYLS22, or both for 24 h. Whole-cell lysates were subjected to Western blotting using the indicated antibodies. (B) Quantification of band intensity (mean ± SD, n = 3). ANOVA with post-hoc Tukey: ∗p < 0.05, ∗∗p < 0.01, ∗∗∗p < 0.001.
Figure 8
Figure 8
Synergistic effects of MRTX1133 and MYLS22 on cell proliferation and spheroid growth (A and B) PANC-1 cells were cultured with 0–50 μM of MRTX1133 (A) or MYLS22 (B) for 72 h. Cell density was assessed using a crystal violet assay (mean ± SD, n = 5). (C) The IC50 of MRTX1133 for cell proliferation was evaluated in the presence or absence of a sub-effective concentration of MYLS22 (12.5 μM, indicated by an arrow in panel B) (mean ± SD, n = 5). (D) Spheroid growth. Spheroids of PANC-1 cells were cultured in Geltrex for 7 days in the presence or absence of 4 nM MRTX1133 and/or 1 μM MYLS22. (E) Quantification of the total and invasion areas (mean ± SD, n > 20). Student’s t-test in (C) and ANOVA with post-hoc Tukey in (E): ∗p < 0.05, ∗∗∗p < 0.001.

References

    1. Collisson E.A., Bailey P., Chang D.K., Biankin A.V. Molecular subtypes of pancreatic cancer. Nat. Rev. Gastroenterol. Hepatol. 2019;16:207–220. doi: 10.1038/s41575-019-0109-y. - DOI - PubMed
    1. Buscail L., Bournet B., Cordelier P. Role of oncogenic KRAS in the diagnosis, prognosis and treatment of pancreatic cancer. Nat. Rev. Gastroenterol. Hepatol. 2020;17:153–168. doi: 10.1038/s41575-019-0245-4. - DOI - PubMed
    1. Hayashi A., Hong J., Iacobuzio-Donahue C.A. The pancreatic cancer genome revisited. Nat. Rev. Gastroenterol. Hepatol. 2021;18:469–481. doi: 10.1038/s41575-021-00463-z. - DOI - PubMed
    1. Park W., Chawla A., O'Reilly E.M. Pancreatic Cancer: A Review. JAMA. 2021;326:851–862. doi: 10.1001/jama.2021.13027. - DOI - PMC - PubMed
    1. Hosein A.N., Dougan S.K., Aguirre A.J., Maitra A. Translational advances in pancreatic ductal adenocarcinoma therapy. Nat. Can. (Ott.) 2022;3:272–286. doi: 10.1038/s43018-022-00349-2. - DOI - PubMed

LinkOut - more resources