. 2024 Aug 26;27(9):110827.
doi: 10.1016/j.isci.2024.110827. eCollection 2024 Sep 20.

Single-cell transcriptome and crosstalk analysis reveals immune alterations and key pathways in the bone marrow of knee OA patients

Affiliations

Single-cell transcriptome and crosstalk analysis reveals immune alterations and key pathways in the bone marrow of knee OA patients

Paramita Chatterjee et al. iScience. .

Abstract

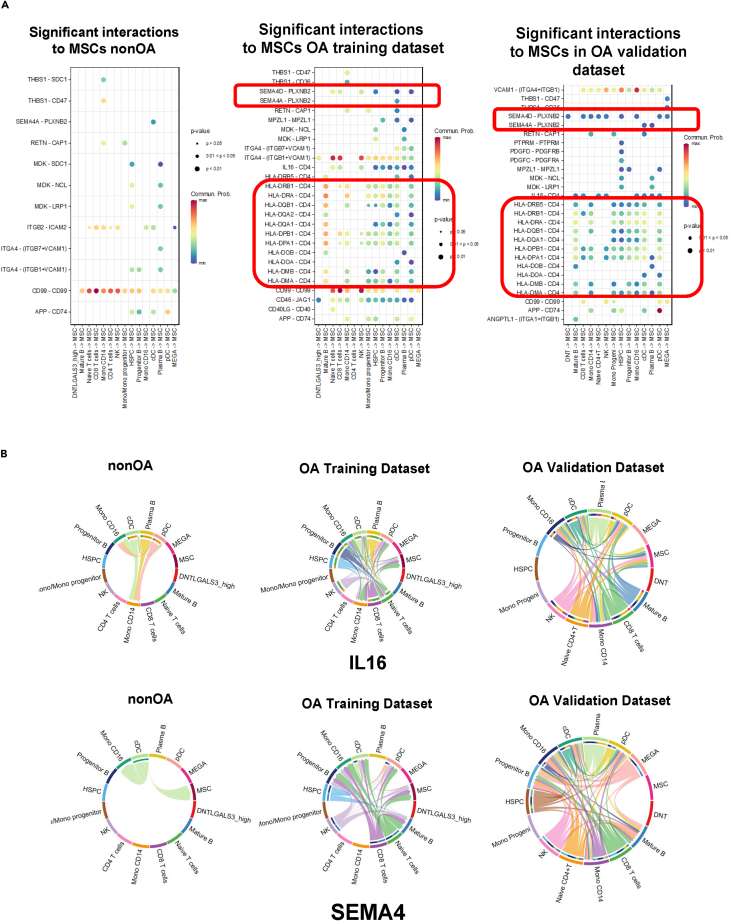
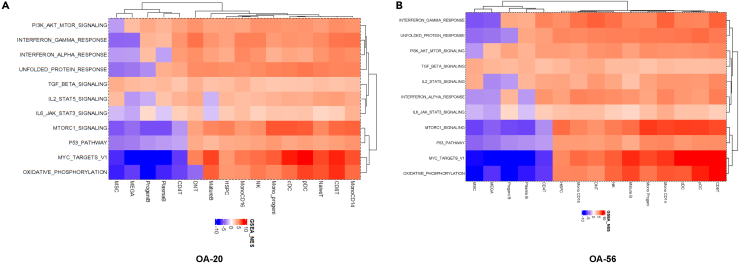
Knee osteoarthritis (OA) is a significant medical and economic burden. To understand systemic immune effects, we performed deep exploration of bone marrow aspirate concentrates (BMACs) from knee-OA patients via single-cell RNA sequencing and proteomic analyses from a randomized clinical trial (MILES: NCT03818737). We found significant cellular and immune alterations in the bone marrow, specifically in MSCs, T cells and NK cells, along with changes in intra-tissue cellular crosstalk during OA progression. Unlike previous studies focusing on injury sites or peripheral blood, our probe into the bone marrow-an inflammation and immune regulation hub-highlights remote organ impact of OA, identifying cell types and pathways for potential therapeutic targeting. Our findings highlight increased cellular senescence and inflammatory pathways, revealing key upstream genes, transcription factors, and ligands. Additionally, we identified significant enrichment in key biological pathways like PI3-AKT-mTOR signaling and IFN responses, showing their potentially crucial role in OA onset and progression.

Keywords: Biopsy sample; Computational bioinformatics; Transcriptomics.


Conflict of interest statement

The authors declare no competing interests.

Figures

None
Graphical abstract
Figure 1
Figure 1
Graphical overview of single-cell omics analysis of patient OA and non-OA bone marrow 1–9 steps illustrating the experimental and analytical schematic process. The cryopreserved cells were processed to generate single cell RNA (scRNAseq) library generation of OA patient bone marrow samples. These samples were parallelly processed for mass cytometry and flow cytometry assessments. After sequencing the scRNAseq libraries, the cell types were identified from cluster generation. DEG, cellular crosstalk, and pathway analyses were performed to correlate and interpret the relevant biological findings.
Figure 2
Figure 2
Single-cell transcriptomics profiling of BMAC cells (A) Cell type identification of OA and non-OA BMAC cells with SEURAT version 4 analytical pipeline. The UMAP shows the cell populations for both groups split showing the cell type clusters. Both OA and nonOA groups have all the major cell types present. (B) A stacked barplot shows the cell type cluster proportions comparing the diseased group (OA) and the non-diseased group (non-OA). The significant changes in the cell proportions are shown with the p value significance. The significance of p value is listed as '∗∗' for less than or equal to 0.01 and '∗∗∗' for less than or equal to 0.001. Overall, we observe an increase of NK cells, megakaryocytes, double-negative T cells (DNT), CD8 T cells, MSCs, and progenitor B cells in the OA cohort. (C) Donor-wise distribution on cell cluster proportion to highlight the cell type variabilities in BMAC donors. (D) Dotplot shows the expression of the key markers to identify cell type for each cell type. Red is nonOA and Blue is OA. The size of the dots represents the expression percentages.
Figure 3
Figure 3
Mass cytometry cell type identifications and abundance analysis of the OA BMAC samples (A) Representative mass cytometry profile of the OA donors with the cell type annotated. (B) The bar plots show cell-type abundances correlation in scRNAseq and mass cytometry side by side for both OA and nonOA cohorts. The error bars on each data point represent the standard error of the mean (SEM) for the cell type frequencies across biological replicates. The SEM provides an estimate of the variability in cell type abundances within each sample group.
Figure 4
Figure 4
Detailed cellular crosstalk analysis in BMAC samples (A) Cellular interaction profiling using CellChat. This panel visualizes the top 20 cellular interactions identified within the OA cohort, across both training and validation datasets. The analysis highlights dynamic communication networks, predominantly featuring interactions between mesenchymal stem cells (MSCs) and other critical immune cells such as NK cells, T cells, and hematopoietic stem and progenitor cells (HSPCs). The graphical representation delineates the complexity of intercellular communications, underlining the enriched signaling pathways that potentially influence therapeutic outcomes. (B) The word cloud illustrates the relative prominence of ligand-receptor pairs in the OA and non-OA groups, emphasizing the differential expression of key molecules. Notable ligands such as LAMA4, LAMB1, BMP5, LAMC1, PTPRM, and SEMA4A are exclusively enriched in the OA cohort, suggesting a unique molecular signature that may be pivotal in OA pathogenesis and progression. (C) Comparative analysis of enriched ligand pathways: presented as a bar plot, this panel quantifies and compares the enriched ligand-receptor pathways between OA and non-OA groups. Color-coded for intuitive interpretation (OA in Blue, non-OA in Red), the plot provides a visual summary of the pathway distribution, highlighting the presence of multiple ligand-receptor interactions unique to the OA group. This differential pathway activity could inform targeted therapeutic strategies.
Figure 5
Figure 5
Analysis of key pathways and gene expressions enriched in OA Using BMAC from OA patients (A) This panel illustrates the ligand-receptor activity specifically associated with mesenchymal stem cells (MSCs) under the OA condition, utilizing Nichenet analysis to pinpoint critical interactions. It shows a detailed comparison across non-OA, OA training, and OA validation datasets, highlighting several key ligand-receptor pairs. Notable among these are antigen-presenting receptors and SEMA4D, which are consistently enriched in both OA datasets, indicating their potential role in the molecular mechanisms underpinning OA. (B) The bar plots in this panel depict the intensity and distribution of IL16 and SEMA4 ligand pathways, revealing significant communication patterns within the MSCs across different study groups. This comparative analysis underscores the heightened activity in both the OA training and validation datasets relative to non-OA controls. The graphical representation provides insights into the differential expression and potential functional implications of these pathways in OA pathophysiology.
Figure 6
Figure 6
Comprehensive analysis of differential gene expression in OA (A) This panel highlights the results of differential expression analysis between OA and non-OA groups, specifically within mesenchymal stem cells (MSCs). It showcases a bar graph depicting the relative number of differentially expressed genes (DEGs), where MSCs exhibit the highest disparity in gene expression, underscoring their pivotal role in OA pathophysiology. (B) This section delves into the specific genes within MSCs that are altered in OA compared to non-OA conditions. The analysis identifies key genes implicated in the pathogenesis of OA, offering insights into the molecular alterations that may drive disease progression. This visualization aids in understanding the gene-level changes and their potential impact on therapeutic targeting. (C) Focusing on toll-like receptors, this panel presents a clear visualization of their differential expression levels in the OA dataset relative to non-OA. The significant upregulation of these receptors in OA suggests their crucial involvement in inflammatory responses and innate immunity within the OA context, potentially contributing to disease mechanisms and symptoms.
Figure 7
Figure 7
Pathway enrichment analysis (A). GSEA pathways enriched in OA from the 20-sample cohort. Positive NES in red and negative NES in blue. The X axis shows the enriched pathways in OA dataset and Y axis shows the cell types. The heatmap color intensity signifies the NES scores for each pathway and celltypes in OA. (B) GSEA pathways enriched in OA from the 56-sample validation cohort. Positive NES in red and negative NES in blue. The X axis shows the enriched pathways in OA dataset and Y axis shows the cell types. The heatmap color intensity signifies the NES scores for each pathway and cell types in OA.

Similar articles

Cited by

References

    1. Glyn-Jones S., Palmer A.J.R., Agricola R., Price A.J., Vincent T.L., Weinans H., Carr A.J. Osteoarthritis. Lancet. 2015;386:376–387. doi: 10.1016/S0140-6736(14)60802-3. - DOI - PubMed
    1. Murphy L., Helmick C.G. The impact of osteoarthritis in the United States: a population-health perspective. Am. J. Nurs. 2012;112:S13–S19. doi: 10.1097/01.NAJ.0000412646.80054.21. - DOI - PubMed
    1. Hunter D.J., Bierma-Zeinstra S. Osteoarthritis. Lancet. 2019;393:1745–1759. doi: 10.1016/S0140-6736(19)30417-9. - DOI - PubMed
    1. Neogi T. The epidemiology and impact of pain in osteoarthritis. Osteoarthritis Cartilage. 2013;21:1145–1153. doi: 10.1016/j.joca.2013.03.018. - DOI - PMC - PubMed
    1. Abed E., Bouvard B., Martineau X., Jouzeau J.Y., Reboul P., Lajeunesse D. Elevated hepatocyte growth factor levels in osteoarthritis osteoblasts contribute to their altered response to bone morphogenetic protein-2 and reduced mineralization capacity. Bone. 2015;75:111–119. doi: 10.1016/j.bone.2015.02.001. - DOI - PubMed