. 2024 Aug 20;27(9):110731.
doi: 10.1016/j.isci.2024.110731. eCollection 2024 Sep 20.

Persistent Mycobacterium tuberculosis bioaerosol release in a tuberculosis-endemic setting

Affiliations

Persistent Mycobacterium tuberculosis bioaerosol release in a tuberculosis-endemic setting

Ryan Dinkele et al. iScience. .

Abstract

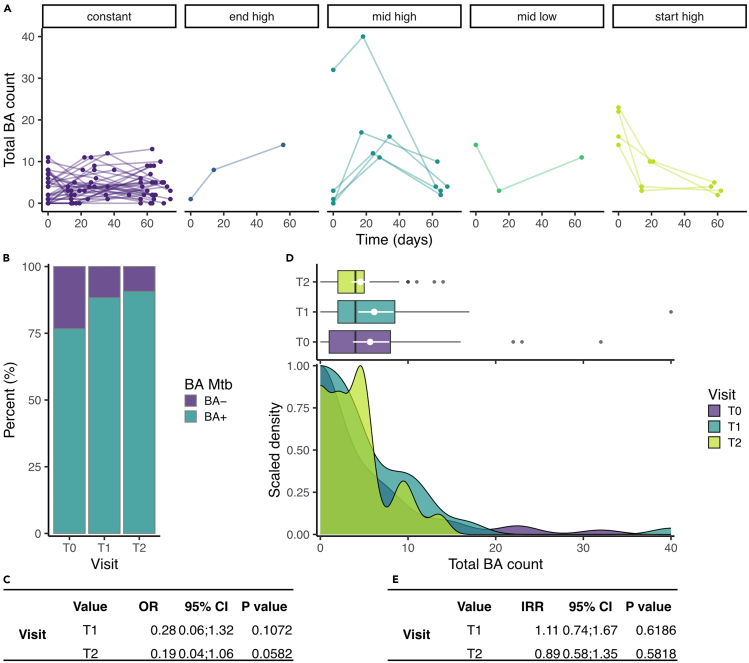
Pioneering studies linking symptomatic disease and cough-mediated Mycobacterium tuberculosis (Mtb) release established the infectious origin of tuberculosis (TB), simultaneously informing the notion that pathology is a prerequisite for Mtb transmission. Our recent work has challenged this assumption: by sampling TB clinic attendees, we detected equivalent release of Mtb-containing bioaerosols by confirmed TB patients and individuals not receiving a TB diagnosis and observed time-dependent reduction in Mtb bioaerosol positivity during 6-month follow-up of both cohorts, irrespective of anti-TB chemotherapy. Now, we report widespread Mtb release in our TB-endemic setting: of 89 randomly recruited community members, 79.8% (71/89) produced Mtb-containing bioaerosols independently of QuantiFERON status, a standard test for Mtb exposure. Moreover, during 2-month longitudinal sampling, only 2% (1/50) were serially Mtb bioaerosol negative. These results necessitate a reframing of the prevailing paradigm of Mtb transmission and TB etiology, perhaps explaining the historical inability to elucidate Mtb transmission networks in TB-endemic regions.

Keywords: Microbiology.


Conflict of interest statement

The authors have no conflicting interests to declare.

Figures

None
Graphical abstract
Figure 1
Figure 1
Participant recruitment and bioaerosol sampling algorithms for the two randomized community cohorts (A) For the initial cross-sectional survey, 39 participants were recruited from randomly selected erfs in Masiphumelele. At a first screening visit, participants produced bioaerosol samples from three respiratory maneuvers: forced vital capacity (FVC), tidal breathing (TiBr), and induced cough. Samples were processed and visualized independently by microscopists blinded to all sample information. Owing to the high prevalence of Mtb bioaerosol positivity, all participants were brought back for a follow-up visit during which blood and sputum were collected for QFT and GXP analysis, respectively. (B) For the longitudinal study of Mtb bioaerosol release, 50 participants were recruited. Blood and sputum samples were collected at baseline for QFT and GXP analyses, respectively. Two equivalent bioaerosol samples were collected during 10 min of tidal breathing with deep breaths taken at 30-s intervals. These samples were processed and imaged independently on nanowell-arrayed microscope slides by microscopists blinded to all sample information. This process was repeated at 2 weeks and 2 months after initial recruitment.
Figure 2
Figure 2
High-prevalence Mtb bioaerosol release in a TB-endemic community independent of respiratory maneuver (A) The percentage of samples in which putative Mtb were detected (turquoise) or absent (purple) from forced vital capacity [FVC (67.6%)], tidal breathing [TiBr (51.4%)], and cough (51.1%). (B) Results of a logistic regression comparing the odds of a positive bioaerosol result compared to TiBr. (C) Box and whisker and equivalent density plots comparing the total number of Mtb detected between the three respiratory maneuvers. White circle and error bars overlayed onto the box and whisker plots represent the mean ±95% CI. (D) Results of a negative binomial regression comparing the number of Mtb detected between the three respiratory maneuvers. OR = odds ratio, IRR = incident rate ratio, CI = confidence interval, BA = bioaerosol.
Figure 3
Figure 3
Altering the bioaerosol sampling algorithm did not reduce Mtb detection efficiency (A) The percentage of samples in which putative Mtb were detected (green) or absent (purple). The odds of a positive bioaerosol sample were equivalent between the two groups (OR = 1.03, 95% CI = 0.36; 2.92, p = 0.952) (B) Box and whisker and equivalent density plots comparing the total number of Mtb detected between the two cohorts. The rates at which Mtb were produced during the two samplings were equivalent (IRR = 0.797, 95% CI = 0.47; 1.33, p = 0.386). White circle and error bars overlayed onto the box and whisker plots represent the mean ±95% CI. OR = odds ratio, IRR = incident rate ratio, CI = confidence interval, BA = bioaerosol.
Figure 4
Figure 4
The consistent production of aerosolized Mtb during two equivalent respiratory maneuvers (A) Plot of the mean Mtb (DMN-tre positive) count from two samples, with error bars representing the range. No lines indicate equal counts, green lines indicate one count = 0, blue lines indicate two counts >0. (B) Plot of the Mtb (DMN-tre positive) counts of the first and second samples at baseline (r = 0.810, p < 0.0001) with a fitted line representing a 1:1 correlation. (C) A Bland-Altman plot indicating the level of agreement between the first and second samples, with a (D) histogram showing the frequency of each count difference. Most samples differed by either 0 or ±1 (60%) and 94% of the samples differed by four or less.
Figure 5
Figure 5
Persistent Mtb release among a randomly selected community cohort is common (A) Total Mtb (DMN-tre positive) counts (sum of the two samples) through time, stratified by time trend. (B) The percentage of samples in which putative Mtb were detected (turquoise) or absent (purple) at each of the visits. (C) Results of a logistic regression comparing the odds of a negative BA result compared to T0. (D) Box and whisker and density plots comparing the total number of Mtb bacilli (DMN-tre positive) detected at each visit. White circle and error bars overlayed onto the box and whisker plots represent the mean ±95% CI. (E) Results of a negative binomial regression comparing the number of Mtb bacilli (DMN-tre positive) detected at each visit. OR = odds ratio, IRR = incident rate ratio, CI = confidence interval, BA = bioaerosol.

Update of

References

    1. Drain P.K., Bajema K.L., Dowdy D., Dheda K., Naidoo K., Schumacher S.G., Ma S., Meermeier E., Lewinsohn D.M., Sherman D.R. Incipient and Subclinical Tuberculosis: a Clinical Review of Early Stages and Progression of Infection. Clin. Microbiol. Rev. 2018;31 doi: 10.1128/CMR.00021-18. - DOI - PMC - PubMed
    1. Barry C.E., Boshoff H.I., Dartois V., Dick T., Ehrt S., Flynn J., Schnappinger D., Wilkinson R.J., Young D. The spectrum of latent tuberculosis: rethinking the biology and intervention strategies. Nat. Rev. Microbiol. 2009;7:845–855. - PMC - PubMed
    1. Lin P.L., Flynn J.L. The End of the Binary Era: Revisiting the Spectrum of Tuberculosis. J. Immunol. 2018;201:2541–2548. doi: 10.4049/jimmunol.1800993. - DOI - PMC - PubMed
    1. Coussens A.K., Zaidi S.M.A., Allwood B.W., Dewan P.K., Gray G., Kohli M., Kredo T., Marais B.J., Marks G.B., Martinez L., et al. Classification of early tuberculosis states to guide research for improved care and prevention: an international Delphi consensus exercise. Lancet Respir. Med. 2024;12:484–498. doi: 10.1016/S2213-2600(24)00028-6. - DOI - PMC - PubMed
    1. Richards A.S., Sossen B., Emery J.C., Horton K.C., Heinsohn T., Frascella B., Balzarini F., Oradini-Alacreu A., Häcker B., Odone A., et al. Quantifying progression and regression across the spectrum of pulmonary tuberculosis: a data synthesis study. Lancet Global Health. 2023;11:e684–e692. doi: 10.1016/S2214-109X(23)00082-7. - DOI - PMC - PubMed

LinkOut - more resources