. 2024 Sep 16:17:6469-6484.
doi: 10.2147/JIR.S473823. eCollection 2024.

Molecular Classification of HNSCC Based on Inflammatory Response-Related Genes - Integrated Single-Cell and Bulk RNA-Seq Analysis

Affiliations

Molecular Classification of HNSCC Based on Inflammatory Response-Related Genes - Integrated Single-Cell and Bulk RNA-Seq Analysis

Yong Zhu et al. J Inflamm Res. .

Abstract

Objective: Tumor cells, inflammatory cells, and chemical factors collaboratively orchestrate a sophisticated signaling network, culminating in the formation of the inflammatory tumor microenvironment (TME). The present study sought to explore the nature of the inflammatory response in HNSCC and to decipher its influence on immunotherapeutic.

Materials and methods: A thorough analysis was performed utilizing the TCGA cohort along with two GEO cohorts. Unsupervised clustering of 200 inflammatory response-related genes (IRGs) was applied using the k-means algorithm to explore the heterogeneity of HNSCC. Additionally, a prognostic signature based on IRGs genes was constructed using Lasso regression. Meanwhiles, the expression of IRGs were identified in tumors and paracancerous tissues at the single-cell level. The crosstalk between IRGs was explored using CellChat and the patterns of incoming and outgoing signals were identified. Finally, qPCR was used to verify the expression of hub genes.

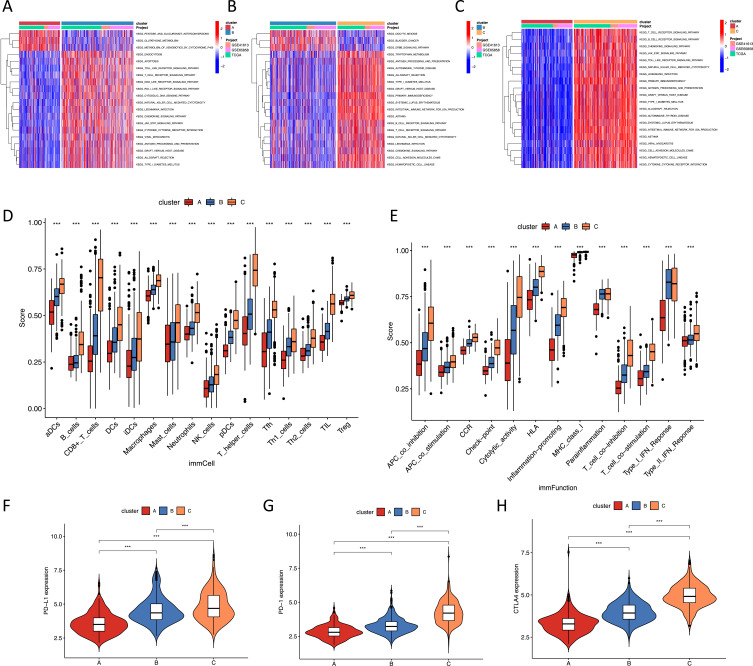
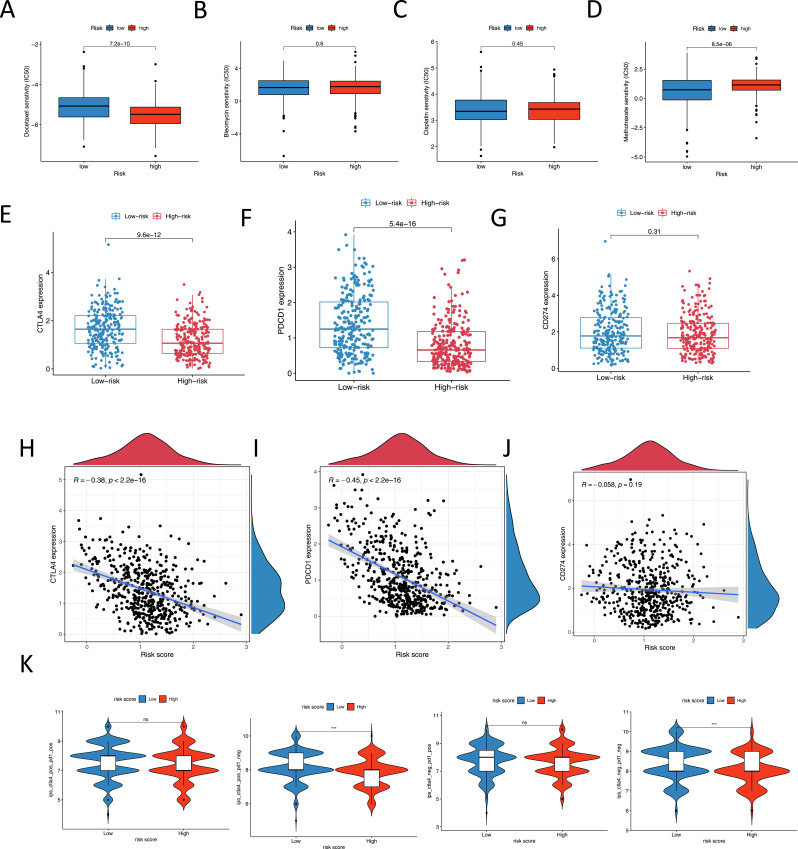
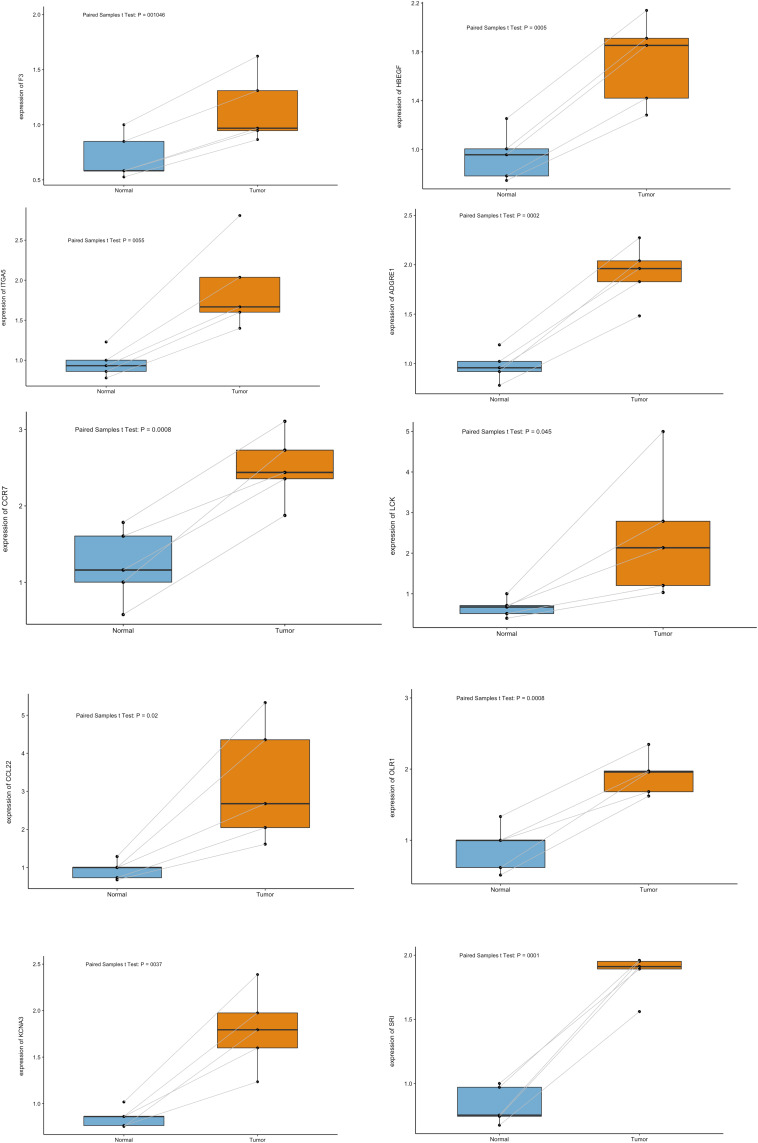
Results: There were significant differences in immune-cell function and immune-cell infiltration among three inflammatory response clusters. Additionally, we also constructed a prognostic model which could predicted the responses of common chemotherapeutic drugs and immunotherapy. Furthermore, qPCR and sc-RNA seq corroborated that the expression profiles of the prognostic genes were largely in alignment with the findings from the bioinformatics analysis. Ultimately, the molecular docking demonstrated favorable binding affinities between the pivotal gene-SCC7 and four chemotherapeutic drugs.

Conclusion: This research has uniquely shed light on the intricate connection between the inflammatory response profiles and the immune infiltration patterns in HNSCC.

Keywords: HNSCC; TME; immunotherapy; inflammatory response; sc-RNA seq.


Conflict of interest statement

The authors report no conflicts of interest in this work.

Figures

Figure 1
Figure 1
Identification of HNSCC subtypes based on IRGs. (A) The k-means algorithm clustering using 200 IRGs. (B) K-M curves for the three inflammatory-related molecular patterns of HNSCC patients in the TCGA-HNSCC and GEO cohorts. (C) Confirming the discrimination of k = 3 using PCA analysis, cluster A (red), cluster B (blue), and cluster C (Orange). (D) The heat map depicts the correlation between the pattern and different clinicopathological characteristics.
Figure 2
Figure 2
Characteristics of cell infiltration in the TME in the different inflammatory response patterns. (AC) GSVA enrichment analysis showing the activation states of KEGG in distinct inflammatory response subtypes. In the heat map, red represents activated pathways, and blue represents inhibited pathways. A cluster A vs cluster B; B cluster B vs cluster C; C cluster A vs cluster C (D, E) Box plots showed the scores of immune infiltrations (D) and immune functions (E) among the inflammatory response patterns. ***p<0.001. (FH) The comparison of the expression of PD-1, PD-L1 and CTLA4 in the different inflammatory response patterns. ***p<0.001.
Figure 3
Figure 3
Identification of IRGs in the TCGA-HNSCCC cohort. (A) Venn diagram shows that 14 genes were identify the prognosis-related DEGs. (B) The heat map depicts 14 overlapping genes expression levels in HNSCC tissues and adjacent normal tissues. (C) Forest plots shows the hazard ratio and 95% confidence intervals (95% CI) of 14 prognosis-related DEGs by univariate Cox regression analysis. (D) The correlation network of 14 overlapping genes.
Figure 4
Figure 4
Construction and assessment of ten inflammatory response-related signature. (A)The risk score distribution of HNSCC patients. (B) Survival time and survival status of HNSCC patients. (C) The heat map depicts the expression of inflammatory response-related and the correlation between the risk group and different clinicopathological characteristics. (D) K-M curves were used to analyze OS in the low and high-risk groups in the TCGA cohort. (E) Principal component analysis (PCA) of the inflammatory response-related signature in TCGA cohort. (F) The 1-year, 2-year, and 3-year ROC curves with AUC values of 0.671, 0.684, and 0.710. (G) A comparison of 3-year AUC values with different clinicopathological characteristics: age, sex, grade, T, N, and M. (HK) K-M curves were used to analyze OS in the low and high-risk groups in 2 GEO cohort(H), GSE41613; (J), GSE65858. AUC time-dependent ROC curves for OS (I), GSE41613; (K), GSE65858.
Figure 5
Figure 5
K-M analysis of overall survival in different subgroups. Patients were classified according to age (age <= 65 and age >65), sex (female and male), T (T1-T2, T3-T4), N (N0, N1-N3).
Figure 6
Figure 6
Different immune infiltration characteristics and enrichment pathways in the high- and low-risk groups. (A and B) GSVA enrichment analysis showing the activation states in the high and low-risk group. In the heat map, red represents activated pathways, and blue represents inhibited pathways. (A) HALLMARK; (B) KEGG. (C and D) Box plots showed the scores of immune infiltrations (C) and immune functions (D) among the high and low-risk groups. Ns: not significant; *p<0.05; **p<0.01; ***p<0.001.
Figure 7
Figure 7
The role of the inflammatory response in predicting responses to common chemotherapeutic drugs and immune responses. (AD) The model acted as a potential predictor for common chemotherapeutic drugs. The low-risk scores were associated with a low IC50 for methotrexate and a high IC50 for docetaxel. (EG) The comparison of the expression of PD-1, PD-L1, and CTLA4 in the different risk scores. (HJ) Scatter plot showing the correlation between risk score and CTLA4, PD-1, and PD-L1 expression. (K) IPS score reflecting the response to ICIs.
Figure 8
Figure 8
The mRNA expression of IRGs between HNSCC tissues and adjacent normal tissues. The mRNA expression analysis by qRT-RCR.
Figure 9
Figure 9
The docking conformation and interaction force analysis between SCC7 and paraplatin, docetaxel, fluorouracil and cetuximab. Color symbols: yellow sticks for drug molecules, blue sticks for amino acid residues, blue lines for hydrogen bonding, and gray dashed lines for hydrophobic interaction.
Figure 10
Figure 10
scRNA-seq analysis of IRGs in HNSCC. (A) UMAP clustering colored by groups in normal tissue (NL) and primary cancer (CA). (B and C) Comparisons of overall changes in cell-cell communication between NL and CA, including the number or weight of interactions (left) in NL, number or weight of interactions (medium) in CA and differential interaction strength (right) between CA and NL. (D) Differences in the overall signaling pathway between NL and CA. (E and F) The heatmap demonstrated the incoming signaling patterns and outgoing f signaling patterns in CA. (G) Communication probabilities of important ligand-receptor pairs in CA.

Similar articles

References

    1. Muzaffar J, Bari S, Kirtane K, Chung C. recent advances and future directions in clinical management of head and neck squamous cell carcinoma. Cancers. 2021;13(2):338. doi:10.3390/cancers13020338 - DOI - PMC - PubMed
    1. Thorsson V, Gibbs D, Brown S, et al. The immune landscape of cancer. Immu. 2018;48:812–830. doi:10.1016/j.immuni.2018.03.023 - DOI - PMC - PubMed
    1. Kitamura N, Sento S, Yoshizawa Y, Sasabe E, Kudo Y, Yamamoto T. Current trends and future prospects of molecular targeted therapy in head and neck squamous cell carcinoma. Int J Mol Sci. 2020;22(1):240. doi:10.3390/ijms22010240 - DOI - PMC - PubMed
    1. Fulcher C, Haigentz M, Ow T. AHNS series: Do you know your guidelines? Principles of treatment for locally advanced or unresectable head and neck squamous cell carcinoma. Head Neck. 2018;40:676–686. doi:10.1002/hed.25025 - DOI - PMC - PubMed
    1. Dlamini Z, Alaouna M, Mbatha S, et al. Genetic drivers of head and neck squamous cell carcinoma: Aberrant splicing events, mutational burden, hpv infection and future targets. Genes. 2021;12(3):422. doi:10.3390/genes12030422 - DOI - PMC - PubMed

LinkOut - more resources