. 2024 Dec;15(6):2595-2607.
doi: 10.1002/jcsm.13604. Epub 2024 Sep 23.

LRRK2G2019S Gene Mutation Causes Skeletal Muscle Impairment in Animal Model of Parkinson's Disease

Affiliations

LRRK2G2019S Gene Mutation Causes Skeletal Muscle Impairment in Animal Model of Parkinson's Disease

Yiying Hu et al. J Cachexia Sarcopenia Muscle. 2024 Dec.

Abstract

Background: While the gradually aggravated motor and non-motor disorders of Parkinson's disease (PD) lead to progressive disability and frequent falling, skeletal muscle impairment may contribute to this condition. The leucine-rich repeat kinase2 (LRRK2) is a common disease-causing gene in PD. Little is known about its role in skeletal muscle impairment and its underlying mechanisms.

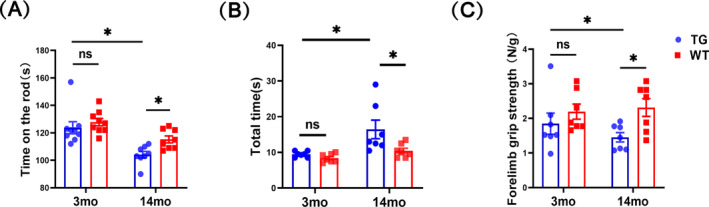
Methods: To investigate whether the mutation in LRRK2 causes skeletal muscle impairment, we used 3-month-old (3mo) and 14-month-old (14mo) LRRK2G2019S transgenic (TG) mice as a model of PD, compared with the age-matched littermate wild-type (WT) controls. We measured the muscle mass and strength, ultrastructure, inflammatory infiltration, mitochondrial morphology and dynamics dysfunction through behavioural analysis, electromyography (EMG), immunostaining, transmission electron microscopy (TEM) and other molecular biology techniques.

Results: The 3mo-TG mice display mild skeletal muscle impairment with spontaneous potentials in EMG (increased by 130%, p < 0.05), myofibre necrosis (p < 0.05) and myosin heavy chain-II changes (reduced by 19%, p < 0.01). The inflammatory cells and macrophage infiltration are significantly increased (CD8a+ and CD68+ cells up 1060% and 579%, respectively, both p < 0.0001) compared with the WT mice. All of the above pathogenic processes are aggravated by aging. The 14mo-TG mice EMG examinations show a reduced duration (by 31%, p < 0.01) and increased polyphasic waves of motor unit action potentials (by 28%, p < 0.05). The 14mo-TG mice present motor behavioural deficits (p < 0.05), muscle strength and mass reduction by 37% and 8% (p < 0.05 and p < 0.01, respectively). A remarkable increase in inflammatory infiltration is accompanied by pro-inflammatory cytokines in the skeletal muscles. TEM analysis shows muscle fibre regeneration with the reduced length of sarcomeres (by 6%;p < 0.05). The muscle regeneration is activated as Pax7+ cells increased by 106% (p < 0.0001), andmyoblast determination protein elevated by 71% (p < 0.01). We also document the morphological changes and dynamics dysfunction of mitochondria with the increase of mitofusin1 by 43% (p < 0.05) and voltage-dependent anion channel 1 by 115% (p < 0.001) in the skeletal muscles of 14mo-TG mice.

Conclusions: Taken together, these findings may provide new insights into the clinical and pathogenic involvement of LRRK2G2019 mutation in muscles, suggesting that the diseases may affect not only midbrain dopaminergic neurons, but also other tissues, and it may help overall clinical management of this devastating disease.

Keywords: LRRK2G2019S mutation; Parkinson's disease; electromyography; mitochondrial impairment; skeletal muscle impairment.


Conflict of interest statement

The authors declare no conflicts of interest.

Figures

FIGURE 1
FIGURE 1
Motor performance in LRRK2G2019S mice. (A) The latency to fall from rotarod. (B) The total time including turn around and climbing down from the top to the ground. (C) Forelimb grip strength standardization by body weight. n = 7–9 mice per group. Data were analysed by two‐way ANOVA and presented as the mean ± SEM. ns, non‐significant, *p < 0.05, **p < 0.01.
FIGURE 2
FIGURE 2
The EMG tracing with the age‐dependent myogenic‐like changes in the gastrocnemius muscles of LRRK2G2019S mice. (A) The representative images of spontaneous potential discharges include fibrillation potentials (Fibs), positive sharp waves (PSWs), and CRDs. Quantitative analysis of the number of spontaneous potential discharges. (B) The representative images of MUAPs and recruitment. Quantitative analysis of the mean duration, the mean phase of MUAPs, and the amplitude of recruitment. (C) The representative images of RNS. Quantitative analysis of RNS at 3, 5, and 15 Hz of 3‐ and 14‐month‐old mice. (D) The representative images of motor conduction velocity of sciatic nerves. Quantitative analysis of the amplitude, latency and conduction velocity. 3‐month‐old, n = 3 mice per group; 14‐month‐old, n = 6–8 mice per group. Data were analysed by two‐way ANOVA and presented as the mean ± SEM. ns, non‐significant, *p < 0.05, **p < 0.01.
FIGURE 3
FIGURE 3
LRRK2G2019S mice display age‐dependent muscle mass reduction and myofibre necrosis. (A) Morphology of gastrocnemius muscles of TG and WT mice at 3 and 14 months. Scale bars 1 cm. Quantitative analysis of the gastrocnemius muscle mass, body weight and gastrocnemius muscle mass/body weight (g/kg). n = 6 gastrocnemius muscles from 3 mice per group. (B) Representative images of H&E staining of biceps femoris sections. H&E staining showed the necrosis of the myofibres (black arrows). n = 6 slices per mouse and 3 mice per group; scale bars 50 μm. Quantification of the myofibres with inflammatory infiltration, average myofibre size. Data were analysed by two‐way ANOVA and presented as the mean ± SEM. ns, non‐significant, *p < 0.05, **p < 0.01, ***p < 0.001.
FIGURE 4
FIGURE 4
Structure changes in the skeletal muscles of LRRK2G2019S mice during aging. (A) Immunofluorescence analysis for MyHC‐II expression in biceps femoris muscles (Red) together with Laminin β1 (Green). The nucleus was labelled with DAPI (Blue). n = 7–14 slices per mouse and 3 mice per group, scale bars 50 μm. Quantification of the mean integrated density of MyHC‐II, Laminin β1. (B) TEM images of the gastrocnemius muscles, double arrow: sarcomere (S), A band (A); red line: I band (I), H zone (H); black arrow: Z disk (Z) and M line (M). Quantification of the sarcomere, A band, I band, H zone, Z disk and M line. Scale bar 2 μm. n = 10–12 slices per mouse and 3 mice per group. IF data were analysed by two‐way ANOVA; TEM data were analysed using Student's t‐test. All data were presented as the mean ± SEM. ns, non‐significant, *p < 0.05, **p < 0.01, ***p < 0.001.
FIGURE 5
FIGURE 5
Macrophages, lymphocyte infiltration and pro‐inflammatory cytokines levels in the biceps femoris muscles of LRRK2G2019S mice. (A) Immunohistochemistry of CD4+T‐cell, CD8a+T‐cell and CD68+‐cell expression in biceps femoris muscles, scale bars 50 μm. n = 10–12 slices per mouse and 3 mice per group. Quantification of CD4+T‐cell, CD8a+T‐cell and CD68+‐cell. (B) Western blot detecting pro‐inflammatory cytokines of COX‐2, IL‐1β, IL‐6, TNF‐α and LRRK2 protein expressions in gastrocnemius muscles. n = 4 mice per group. Experiments were repeated three times. Quantification of IL‐1β, IL‐6, TNF‐α, COX‐2 and LRRK2 protein expressions relative to GAPDH. Data were analysed by two‐way ANOVA and presented as the mean ± SEM. ns, non‐significant, *p < 0.05, **p < 0.01, ***p < 0.001.
FIGURE 6
FIGURE 6
Activated satellite cells and muscle regeneration in the biceps femoris muscles of LRRK2G2019S mice. (A) Immunofluorescence of PAX7+cell in biceps femoris muscles (green), the nuclei were labelled with DAPI (Blue). Quantification of mean integrated density of PAX7. (B) Immunofluorescence of MyoD (green) and LRRK2 (red), nucleus was labelled with DAPI (Blue). Quantification of the integrated density of MyoD, and LRRK2. Scale bar 50 μm. n = 10–14 slices per mouse and 3 mice per group. (C) Western blot analysis for PAX7, MyoG, MyoD, LRRK2 and GAPDH in gastrocnemius muscles, n = 4 mice per group. Experiments were repeated three times. Quantification of PAX7, MyoG, MyoD and LRRK2 protein expressions relative to GAPDH. Data were analysed by two‐way ANOVA and presented as the mean ± SEM. ns, non‐significant, *p < 0.05, **p < 0.01, ***p < 0.001.
FIGURE 7
FIGURE 7
Mitochondrial morphology changes in the skeletal muscles of LRRK2G2019S mice. (A) The representative images of MGT staining of biceps femoris sections show the ragged red fibres (black arrow). Scale bar 50 μm, n = 6–8 slices from 3 mice per genotype. (B) The representative TEM images of the mitochondria (red arrow). Scale bar 2 μm, n = 10–12 slices per mouse and 3 mice per group. Quantification of the mean number, the proportion of vacuolar damaged, the mean area and mean perimeter of mitochondria. Data were analysed using Student's t‐test, presented as the mean ± SEM. ns, non‐significant, *p < 0.05, **p < 0.01.
FIGURE 8
FIGURE 8
LRRK2G2019S mice display mitochondrial dynamics dysfunction in the skeletal muscles. (A) Western blot analysis for TOMM20, TIMM23, VDAC1, LRRK2 and GAPDH in gastrocnemius muscles, n = 4 mice per group. Quantification of TOMM20, TIMM23, VDAC1 and LRRK2 protein expression relative to GAPDH. (B) Western blot analysis for MFN1, MFN2, OPA1, DRP1, FIS1 and GAPDH in gastrocnemius muscles, n = 4 mice per group. Quantification of MFN1, MFN2, OPA1, DRP1 and FIS1 protein expression relative to GAPDH. Experiments were repeated three times. Data were analysed by two‐way ANOVA, presented as the mean ± SEM. ns, non‐significant, *p < 0.05, **p < 0.01, ***p < 0.001.

References

    1. Tolosa E., Garrido A., Scholz S. W., and Poewe W., “Challenges in the Diagnosis of Parkinson's Disease,” Lancet Neurology 20 (2021): 385–397. - PMC - PubMed
    1. Samii A., Nutt J. G., and Ransom B. R., “Parkinson's Disease,” Lancet 363 (2004): 1783–1793. - PubMed
    1. Siciliano M., Trojano L., Santangelo G., De Micco R., Tedeschi G., and Tessitore A., “Fatigue in Parkinson's Disease: A Systematic Review and Meta‐Analysis,” Movement Disorders 33 (2018): 1712–1723. - PubMed
    1. Tinazzi M., Recchia S., Simonetto S., et al., “Muscular Pain in Parkinson's Disease and Nociceptive Processing Assessed With CO2 Laser‐Evoked Potentials,” Movement Disorders 25 (2010): 213–220. - PubMed
    1. Cruz‐Jentoft A. J. and Sayer A. A., “Sarcopenia,” Lancet 393 (2019): 2636–2646. - PubMed

Substances