. 2025 Jan 4;16(1):49-63.
doi: 10.1093/procel/pwae052.

PDHX acetylation facilitates tumor progression by disrupting PDC assembly and activating lactylation-mediated gene expression

Affiliations

PDHX acetylation facilitates tumor progression by disrupting PDC assembly and activating lactylation-mediated gene expression

Zetan Jiang et al. Protein Cell. .

Abstract

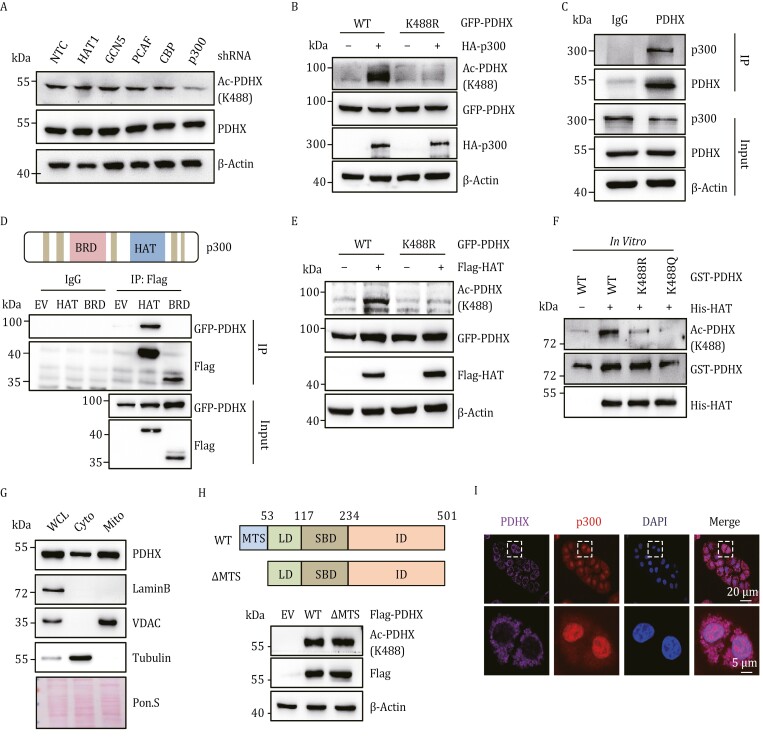
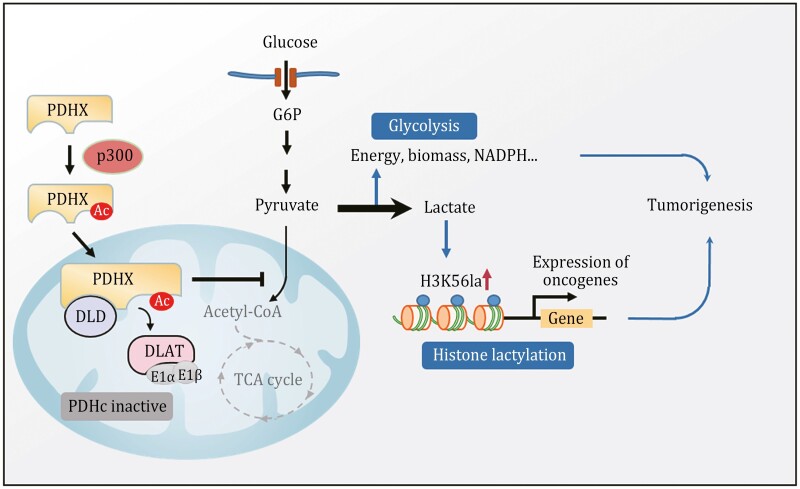
Deactivation of the mitochondrial pyruvate dehydrogenase complex (PDC) is important for the metabolic switching of cancer cell from oxidative phosphorylation to aerobic glycolysis. Studies examining PDC activity regulation have mainly focused on the phosphorylation of pyruvate dehydrogenase (E1), leaving other post-translational modifications largely unexplored. Here, we demonstrate that the acetylation of Lys 488 of pyruvate dehydrogenase complex component X (PDHX) commonly occurs in hepatocellular carcinoma, disrupting PDC assembly and contributing to lactate-driven epigenetic control of gene expression. PDHX, an E3-binding protein in the PDC, is acetylated by the p300 at Lys 488, impeding the interaction between PDHX and dihydrolipoyl transacetylase (E2), thereby disrupting PDC assembly to inhibit its activation. PDC disruption results in the conversion of most glucose to lactate, contributing to the aerobic glycolysis and H3K56 lactylation-mediated gene expression, facilitating tumor progression. These findings highlight a previously unrecognized role of PDHX acetylation in regulating PDC assembly and activity, linking PDHX Lys 488 acetylation and histone lactylation during hepatocellular carcinoma progression and providing a potential biomarker and therapeutic target for further development.

Keywords: PDC; PDHX; acetylation; lactylation; liver cancer.


Conflict of interest statement

The authors declare that they have no conflict of interest.

Figures

Figure 1.
Figure 1.
PDHX acetylation at Lys 488 is upregulated in HCC and correlated with poor clinical prognosis. (A) Pathway and process enrichment (top10) bubble plot derived from data of nano LC–MS/MS. (B) Immunoprecipitation (IP) assay was performed in HEK293T cells transfected with GFP-tagged PDHA1, PDHA2, PDHB, DLAT, or PDHX plasmids. Cells were treated with TSA (5 μmol/L, 16 h) and NAM (10 mmol/L, 8 h). (C) IP assay was performed in HEK293T cells transfected with GFP-PDHX-WT (WT), GFP-PDHX-K194R (K194R), GFP-PDHX-K488R (K488R) or GFP-PDHX-K491R (K491R) plasmids. Cells were treated with or without TSA (5 μmol/L, 16 h) and NAM (10 mmol/L, 8 h). (D) Immunoblotting analysis of PDHX Lys 488 acetylation and PDHX expression in the paired tumor-adjacent noncancerous liver tissues (P) and human HCC tissues (T) (n = 11). Calnexin served as a loading control. (E) Representative IHC images of PDHX and PDHX Lys 488 acetylation staining in normal liver tissue (normal) and HCC specimens of different clinical stages (I–IV); scale bars, 50 μm. Insets: 4-fold magnification; scale bars, 12.5 μm. (F and G) Statistical quantification of MOD values for PDHX Lys 488 acetylation (F) and PDHX staining (G) in IHC assays between normal liver tissues and HCC specimens at clinical stages I–IV (healthy donors, n = 13; patients with HCC, stage I (n = 10), II (n = 73), III (n = 26) and IV (n = 9)). Data presented as mean ± SEM Statistical significance was determined by two-tailed unpaired Student’s t-test., *P < 0.05, compared with normal (N) group. #, not significant. (H and I) Kaplan–Meier curves with univariate analyses of patients with low versus high expression of PDHX Lys 488 acetylation (H) (high PDHX Lys 488 acetylation, n = 59 patients; low PDHX Lys 488 acetylation, n = 59 patients) or PDHX (I) (high PDHX, n = 59 patients; low PDHX, n = 59 patients). High and low expression is defined by the median value calculated from IHC staining data of HCC patient samples. Statistical significance was determined by log-rank test.
Figure 2.
Figure 2.
PDHX Lys 488 is acetylated by p300 in the cytoplasm. (A) Immunoblotting analysis of PDHX Lys 488 acetylation and PDHX protein levels in HepG2 cells expressing NTC or shRNA targeting p300, CBP, PCAF, HAT1 or GCN5. (B) HEK293T cells were transfected with GFP-PDHX-WT or GFP-PDHX-K488R, followed by further transfection with EV or HA-p300. Immunoblotting analysis of PDHX Lys 488 acetylation, HA and GFP levels. (C) Endogenous IP was performed using anti-PDHX antibody or IgG in HepG2 cells. Immunoblotting analysis of PDHX and p300 levels. (D) Co-IP assay in HEK293T cells co-transfected with GFP-PDHX and Flag-tagged BRD or HAT domain plasmids. (E) Immunoblotting analysis of PDHX Lys 488 acetylation, Flag and GFP levels in HEK293T cells co-transfected with GFP-PDHX-WT or GFP-PDHX-K488R and Flag-HAT. (F) His-HAT and GST-tagged PDHX WT, K488R and K488Q were purified from E. coli, and then in vitro acetylation analyses were performed by mixing purified His-HAT with the purified GST-PDHX WT, K488R and K488Q proteins in the presence of Ac-CoA. (G) Immunoblotting analysis of PDHX, LaminB1, VDAC and Tubulin in whole-cell lysates (WCL), cytoplasm lysates (Cyto) and mitochondria lysates (Mito) from HepG2 cells. Ponceau staining served as the loading control. (H) A schematic diagram of the Flag-PDHX-WT and Flag-PDHX-ΔMTS (upper panel). Immunoblotting analysis of PDHX Lys 488 acetylation and Flag in HepG2 cells infected with viruses expressing Flag-PDHX-WT or Flag-PDHX-ΔMTS (lower panel). (I) Representative images of immunofluorescence staining for p300 and PDHX in PLC cells. The nucleus was stained with DAPI. Scale bars, 20 μm. Insets: fourfold magnification; scale bars, 5 μm.
Figure 3.
Figure 3.
PDHX Lys 488 acetylation-induced dissociation between PDHX and DLAT inhibits PDC assembly and activity. (A) PDC activity measurements in HepG2 cells expressing with PDHX-WT, PDHX-K488R or PDHX-K488Q. Data are presented as the mean ± SD of three independent experiments (n = 3). *, P < 0.05, compared with K488R group. (B) The ECAR was measured by successive injections of Glucose, oligomycin (Oligo) and 2-DG in HepG2 cell expressing with PDHX-WT, PDHX-K488R or PDHX-K488Q. Data are presented as the mean ± SD of three independent experiments (n = 3). (C) PDC activity measurements in the paired tumor-adjacent noncancerous liver tissues (P) and human HCC tissues (T) (mean ± SEM of n = 12 biologically independent experiments). *P < 0.05, compared with HCC tissues (T) group. (D) A schematic diagram of the PDC. (E) IP was performed using anti-Flag antibody or IgG in HepG2 cells expressing Flag-PDHX-WT, Flag-PDHX-K488R or Flag-PDHX-K488Q and Immunoblotting analysis of Flag, DLD, and DLAT. (F) Different GST-PDHX mutants were purified from E. coli, and then pull-down assay was performed. (G) IP was performed using anti-Flag antibody or IgG in HepG2 or THLE3 cells overexpressing Flag-PDHX-WT. Immunoblotting analysis of DLAT, DLD, PDHX Lys 488 acetylation and Flag levels. (H) HepG2 cells overexpressing Flag-DLD were further infected with viruses expressing PDHX-WT, PDHX-K488R or PDHX-K488Q. IP was performed using anti-Flag antibody or IgG. (I) A schematic diagram of the PDHX-WT, N-terminal, C-terminal and C-terminal with K488R mutation (left panel). IP was performed using anti-Flag antibody or IgG in HEK293T cells transfected with Flag-tagged PDHX-WT, N-terminal, C-terminal and C-terminal with K488R mutation (right panel). (J) IP was performed using anti-Flag antibody or IgG in HepG2 cells overexpressing Flag-PDHX-WT or Flag-PDHX-Δ488 (delete Lys 488). (K) HepG2 cells overexpressing Flag-PDHX-WT or Flag-PDHX-K488Q were further infected with viruses expressing NTC or shp300. IP was performed using anti-Flag antibody or IgG. (L) HepG2 cells overexpressing Flag-PDHX-WT or Flag-PDHX-K488Q were further infected with viruses expressing NTC or shp300. The ECAR was measured by successive injections of Glucose, oligomycin (Oligo) and 2-DG. (M) HepG2 cells stably expressing NTC or p300 shRNA were further infected with viruses for expression of Flag-EV or Flag-p300-HAT. IP was performed using PDHX antibody or IgG.
Figure 4.
Figure 4.
PDHX Lys 488 acetylation promotes H3K56 lactylation and gene expression. (A) HepG2 cells were transfected with NTC or shRNA targeting PDHX, followed by measurement of lactate production in culture medium. Data are presented as the mean ± SD of three independent experiments (n = 3). *P < 0.05, compared with NTC group. (B) Immunoblotting analysis of pan lactylation in HepG2 cells transfected with NTC or shRNA for PDHX. (C) Immunoblotting analysis of histone lactylation in HepG2 cells transfected with NTC or shRNA for PDHX. (D) HepG2 cells with endogenous PDHX knockdown were subsequently infected with viruses of EV, PDHX-WT or PDHX-K488R followed by measurement of lactate production in culture medium. Data are presented as the mean ± SD of three independent experiments (n = 3). *P < 0.05, between the indicated groups. (E) HepG2 cells with endogenous PDHX knockdown were subsequently infected with viruses of EV, PDHX-WT, PDHX-K488R or PDHX-K488R with Nalac treatment. Immunoblotting analysis of H3K56 lactylation. (F) RNA-seq analysis of HepG2 cells expressing NTC or shPDHX. Candidate genes were plotted based on mean log2-fold change of RNA counts compared to control NTC group. Blue dots indicate downregulated genes whereas red dots indicate upregulated genes by shPDHX (fold-change > 1.5) (upper panel). RNA-seq analysis of HepG2 cells with endogenous PDHX knockdown further expressing PDHX-WT or PDHX-K488R. Candidate genes were plotted based on mean log2 fold-change of RNA counts compared to control WT group. Blue dots indicate downregulated genes whereas red dots indicate upregulated genes by PDHX K488R (fold-change > 1.5) (lower panel). (G) Venn diagram of the RNA-seq data showing the genes regulated by both PDHX and PDHX Lys 488 acetylation (left panel). The mRNA levels of indicated oncogenes were determined by quantitative real-time PCR (qRT–PCR) in the HepG2 cells expressing PDHX-WT or K488R (right panel). Data are presented as the mean ± SD of three independent experiments (n = 3). *P < 0.05, compared with WT group. (H) CUT&tag assay analysis of the occupancy of H3K56la on the indicated gene promoters in the HepG2 cells expressing PDHX-WT or K488R. Data are presented as the mean ± SD of three independent experiments (n = 3). *P < 0.05, between the indicated groups. (I) The indicated proteins were assessed by immunoblotting in the HepG2 cells used in (H).
Figure 5.
Figure 5.
PDHX Lys 488 acetylation contributes to the progression of glycolytic tumor. (A) Relative growth curve of HepG2 cells with or without PDHX knockdown. Data are presented as the mean ± SD of three independent experiments (n = 3). *P < 0.05, compared with NTC group. Knockdown efficiency in HepG2 cells was verified by immunoblotting. (B) Relative growth curve of HepG2 cells with endogenous PDHX knockdown and further expressing PDHX-WT, PDHX-K488R or PDHX-K488Q. Data are presented as the mean ± SD of three independent experiments (n = 3). Expression efficiency in HepG2 cells was verified by immunoblotting. *P < 0.05, compared with K488R group. (C) HepG2 cells overexpressing PDHX-WT, PDHX-K488R or PDHX-K488Q were further treated with DCA for 48 h, followed by measurement of cell numbers. Data are presented as the mean ± SD of three independent experiments (n = 3). *P < 0.05, compared with control (H2O) group. ns, not significant. (D) Measurement of PDC activity in HepG2 cells used in (C), Data are presented as the mean ± SD of three independent experiments (n = 3). *P < 0.05, compared with control (H2O) group. ns, not significant. (E, F) HepG2 cells (5 × 106) used in (B) were injected subcutaneously into BALB/c nude mice (n = 5, each group). Mice were treated with DCA (156 mg/kg body weigh) or PBS every three days starting from 9 days after inoculation. Tumor growth curves were measured starting from 12 days after inoculation. Data are presented as the mean ± SD of five independent experiments (n = 5). *P < 0.05, between the indicated groups. ns, not significant. (G) Immunoblotting analysis of Flag in the extracted tumors in (F), Calnexin was used as the loading control. (H) The tumor volume of the extracted tumors in (F) was measured. Data are presented as mean ± SD (n = 5, each group). Group differences are analyzed by the two-tailed Student’s t-test. *P < 0.05, between the indicated groups. ns, not significant. (I) The tumor weight of the extracted tumors in (F) was measured. Data are presented as mean ± SD (n = 5, each group). Group differences are analyzed by the two-tailed Student’s t-test. *P < 0.05, between the indicated groups. ns, not significant. (J) The PDC activity of the extracted tumors in (F) was measured. Data are presented as mean ± SD (n = 3, each group). Group differences are analyzed by the two-tailed Student’s t-test. *P < 0.05, between the indicated groups. ns, not significant.
Figure 6.
Figure 6.
Working model: PDHX acetylation promotes tumor progression by disrupting PDC assembly and activating lactylation-mediated gene expression. Working model shows that PDHX is acetylated by p300 at K488, then impedes the PDC assembly by inhibiting the interaction between PDHX and DLAT, contributing to the aerobic glycolysis and H3K56 lactylation-mediated gene expression, ultimately facilitating tumor progression.

References

    1. An S, Yao Y, Hu H. et al. PDHA1 hyperacetylation-mediated lactate overproduction promotes sepsis-induced acute kidney injury via Fis1 lactylation. Cell Death Dis 2023;14:457. - PMC - PubMed
    1. Bian XL, Chen HZ, Yang PB. et al. Nur77 suppresses hepatocellular carcinoma via switching glucose metabolism toward gluconeogenesis through attenuating phosphoenolpyruvate carb oxykinase sumoylation. Nat Commun 2017;8:14420. - PMC - PubMed
    1. Cai Z, Li CF, Han F. et al. Phosphorylation of PDHA by AMPK drives TCA cycle to promote cancer metastasis. Mol Cell 2020;80:263–278.e7 e267. - PMC - PubMed
    1. Certo M, Tsai CH, Pucino V. et al. Lactate modulation of immune responses in inflammatory versus tumour microenvironments. Nat Rev Immunol 2021;21:151–161. - PubMed
    1. Chen Y, Wu J, Zhai L. et al. Metabolic regulation of homologous recombination repair by MRE11 lactylation. Cell 2024;187:294–311.e21. - PMC - PubMed

MeSH terms