. 2024 Dec 2;84(23):3936-3952.
doi: 10.1158/0008-5472.CAN-24-0857.

Single-Cell Transcriptomic Analysis Identifies Senescent Osteocytes That Trigger Bone Destruction in Breast Cancer Metastasis

Affiliations

Single-Cell Transcriptomic Analysis Identifies Senescent Osteocytes That Trigger Bone Destruction in Breast Cancer Metastasis

Japneet Kaur et al. Cancer Res. .

Abstract

Breast cancer bone metastases increase fracture risk and are a major cause of morbidity and mortality among women. Upon colonization by tumor cells, the bone microenvironment undergoes profound reprogramming to support cancer progression, which disrupts the balance between osteoclasts and osteoblasts and leads to bone lesions. A deeper understanding of the processes mediating this reprogramming could help develop interventions for treating patients with bone metastases. Here, we demonstrated that osteocytes (Ot) in established breast cancer bone metastasis develop premature senescence and a distinctive senescence-associated secretory phenotype (SASP) that favors bone destruction. Single-cell RNA sequencing identified Ots from mice with breast cancer bone metastasis enriched in senescence, SASP markers, and pro-osteoclastogenic genes. Multiplex in situ hybridization and artificial intelligence-assisted analysis depicted Ots with senescence-associated satellite distension, telomere dysfunction, and p16Ink4a expression in mice and patients with breast cancer bone metastasis. Breast cancer cells promoted Ot senescence and enhanced their osteoclastogenic potential in in vitro and ex vivo organ cultures. Clearance of senescent cells with senolytics suppressed bone resorption and preserved bone mass in mice with breast cancer bone metastasis. These results demonstrate that Ots undergo pathological reprogramming by breast cancer cells and identify Ot senescence as an initiating event triggering lytic bone disease in breast cancer metastases. Significance: Breast cancer cells remodel the bone microenvironment by promoting premature cellular senescence and SASP in osteocytes, which can be targeted with senolytics to alleviate bone loss induced by metastatic breast cancer. See related commentary by Frieling and Lynch, p. 3917.


Conflict of interest statement

Conflict of interest: The authors declare no potential conflicts of interest.

Figures

Figure 1.
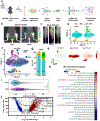
Figure 1.. Single-cell transcriptomic profiling of osteoblastic cells in established breast cancer bone metastasis.
(a) Schematic of experimental design. (b) Tumor bioluminescence and (c) osteolytic lesions in X-Ray (yellow arrows) seven and fourteen days after intratibial tumor inoculation. Representative images per group are shown. Uniform Manifold Approximation and Projection (UMAP) plot representations of osteoblastic cells isolated from control (naïve) or mice with established breast cancer bone metastasis (BCa) showing (d) three clusters, osteocytes (Ots), osteoblasts (Obs), and pre-osteoblasts (pre-Obs), (e) the expression density plots with gene markers defining cluster identities, (f) cluster cell distribution by group. Each dot represents a single cell, and cells sharing the same color code indicate discrete populations of transcriptionally similar cells (d) or from the same group (f). (g) The proportion of cells from each cluster in the naïve vs. BCa group. (h) Gene ontology (GO) enrichment analysis in genes differentially expressed between naïve vs. BCa osteoblastic cells (Ots + Obs + pre-Obs). Positive values represent GO term enrichment in the BCa vs. naïve group. (i) Comparison of the senescence score in osteoblastic cells (Ots + Obs + pre-Obs) from naïve vs. BCa mice. (j) Volcano plot ranking genes according to their relative abundance (log2 fold change) and statistical value (-log10 p-value). Dots show significant upregulated (red) and down-regulated (blue) genes from naïve vs. BCa mice in osteoblastic cells (Ots + Obs + pre-Obs).
Figure 2.
Figure 2.. Osteocytes from bones with breast cancer tumors exhibit upregulation of genes associated with cellular senescence.
(a) Polar plot showing osteocyte gene markers identified in our dataset compared to those previously reported by Agoro et al., Wang et al., and Youlten et al. Functional enrichment analysis results of osteocyte (Ot) genes signature from different published resources. (b) Volcano plot ranking genes according to their relative abundance (log2 fold change) and statistical value (-log10 p-value). Dots show significant upregulated (red) and down-regulated (blue) genes in osteocytes from control (naïve) vs. mice with established breast cancer metastasis (BCa). (c) Gene expression heatmap of the top 15 differentially expressed genes in osteocytes from naïve vs. BCa mice. (d) Gene ontology (GO) enrichment analysis in genes differentially expressed in osteocytes from naïve vs. BCa mice. Positive values represent GO term enrichment in osteocytes from the BCa vs. naïve group. (e) Comparison of the senescence score in osteocytes from naïve vs. BCa mice. (f) Uniform Manifold Approximation and Projection (UMAP) plot representations of osteocytes isolated from naïve or BCa mice showing the senescence score distribution by group. Each dot represents a single osteocyte, and the color intensity is proportional to the senescence score. (g) Bubble plot comparing expression of selected senescent markers in osteocytes (Ots), osteoblasts (Obs), and pre-osteoblasts (pre-Obs) from naïve vs. BCa mice. Bubble size is proportional to the percentage of cells in each cluster expressing a gene, and color intensity is proportional to average scaled gene expression within a cluster.
Figure 3.
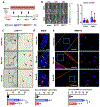
Figure 3.. Breast cancer cells provoke cellular senescence in osteocyte-like cells.
(a) Expression of senescence markers p16Ink4a and p21Cip1 and SASP-related genes Mmp13, Spp1, Il6, and Mmp9, (b-c) prevalence and representative images of SA-β-Gal+ cells, and (d) P16Ink4a protein levels in Ocy454 cells treated with vehicle or conditioned media (CM) from murine EO771 breast cancer cells for five (protein) or nine days. (e) Expression of senescence markers p16Ink4a and p21Cip1 and SASP-related genes Mmp13, Spp1, Il6, and Mmp9, (f-g) prevalence and representative images of SA-β-Gal+ cells, and (h) P16Ink4a protein levels in Ocy454 cells treated with vehicle or CM from human MDA-MB-231 breast cancer cells for five (protein) or nine days. n=3-4/group. *p<0.05 (0.032 to <0.0001) vs. vehicle by Student's t-test. Scale bars (c,g), 200 μm.Data are shown as mean ± SD; each dot represents an independent sample; representative experiments out of two are shown.
Figure 4.
Figure 4.. Breast cancer cells increase the expression of senescence markers and SASP factors in primary murine osteocytes.
(a) Experimental design, (b) representative images (scale bars, 50 μm), and (c) prevalence of p16Ink4a positive primary osteocytes in bones treated with vehicle or conditioned media (CM) from murine EO771 breast cancer cells cultured ex vivo for five days. (d) Expression of senescence markers and SASP-related genes in bones treated with vehicle or CM from murine EO771 breast cancer cells, in the presence/absence of the senolytics Dasatinib and Quercetin (DQ), cultured ex vivo for five days. n=3-5/group. *p<0.05 (0.035 to <0.0001) vs. vehicle by Student's t-test (c) or vs. vehicle by One-Way ANOVA (d). Data are shown as mean ± SD; each dot represents an independent sample; representative experiments out of two are shown.
Figure 5.
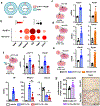
Figure 5.. Breast cancer cells upregulate senescence and SASP-related genes in human bones.
(a) Representative in vivo bioluminescence images of mice with established MDA-MB-231 breast cancer bone metastasis. (b) Osteolytic lesions in X-ray images (yellow arrows) 4 weeks after tumor inoculation. Representative images per group are shown. (c) Representative images and prevalence of telomere-associated foci (TAF)+ primary osteocytes in limbs injected with human MDA-MB-231 breast cancer cells compared to the saline-injected contralateral leg. Scale bars, 2 μm. White arrows indicate TAF events. White dashed lines indicate the nuclei's contour. n=3-4 mice/group. (d) Expression of senescence markers and SASP-related genes in human bones treated with vehicle or CM from human MDA-MB-231 breast cancer cells cultured ex vivo for five days. (e) Ex vivo human bone-breast cancer cell organ cultures established with human MDA-MB-231-luciferase cancer cells and femoral head bone fragments from healthy human donors. Representative bioluminescence images of bones bearing MDA-MB-231 cells two and four days after cell implantation. Expression of senescence markers and SASP-related genes in human bones bearing human MDA-MB-231 breast cancer cells or saline cultured ex vivo for five days. n=3-5/group. *p<0.05 (0.060 to 0.0001) vs. vehicle by Student's t-test. (f) Representative images of 1) a bone biopsy from a breast cancer patient with established bone metastasis showing breast cancer cells (red), senescent osteocytes (green), and normal osteocytes (orange), 2) a blow-out of the AI-assisted analysis of the distance distribution from each osteocyte to the closest breast cancer cell in the marrow, and 3) a histological section stained for CK19-CK7 (orange), P16Ink4a (red), SPP1 (white), and DAPI (blue). Scale bars, 500 μm, 20μm (inserts). White arrows point to P16Ink4a+SPP1+ osteocytes, and red arrows point to P16Ink4−SPP1 osteocytes. (g) AI-assisted quantitative analysis of the distance to breast cancer cells (CK7/CK19+) distribution for SPP1+, P16Ink4a+, P16Ink4a+SPP1+, and P16Ink4a−SPP1 osteocytes, n=4. P values were calculated using the Kolmogorov-Smirnov test. Data are shown as mean ± SD; each dot represents an independent sample; representative experiments out of two are shown.
Figure 6.
Figure 6.. Senolytic therapy blunts the increase in senescent osteocytes in mice with established breast cancer bone metastasis.
(a) Experimental design. (b) Representative in vivo bioluminescence images and luminescence quantification in control mice (naïve) vs. mice with established EO771 breast cancer bone metastasis (BCa) treated with vehicle (veh) or the senolytics Dasatinib and Quercetin (DQ). n=10 mice/group. (c) Representative images and prevalence of p16Ink4a+ primary osteocytes in bones from naïve and BCa mice receiving veh or DQ three weeks after tumor inoculation. Black arrows indicate p16Ink4a+ osteocytes. Scale bars, 50μm. Blue dashed lines indicate the bone surface. n=5-8 mice/group. (d) Representative images and prevalence of senescence-associated distension of satellites (SADS)+ primary osteocytes in bones from naïve and BCa mice receiving veh or DQ three weeks after tumor inoculation. Scale bars, 2 μm. Yellow arrows indicate SADS events. Blue dashed lines indicate the nuclei's contour. C-FISH: centromere-FISH. n=3 mice/group. (e) Representative images and prevalence of MMP13+ primary osteocytes in bones from naïve and BCa mice receiving veh or DQ three weeks after tumor inoculation. Scale bars, 20 μm. Yellow dashed lines indicate the bone surface. n=3/group. *p<0.05 (0.0009 to <0.0001) vs. vehicle by One Way ANOVA. Data are shown as mean ± SD; each dot represents an independent sample.
Figure 7.
Figure 7.. Pharmacologic depletion of senescent cells mitigates the osteolytic bone loss in established breast cancer skeletal metastasis.
(a) Representative X-ray longitudinal images of bones from control mice (naïve) and mice with established EO771 breast cancer bone metastasis (BCa) treated with vehicle (veh) or the senolytics Dasatinib and Quercetin (DQ). Yellow arrows indicate lytic lesions. (b) Representative microCT 3D reconstruction longitudinal images of tibiae and (c) cancellous bone mass and microarchitecture in bones from naïve and BCa mice receiving veh or DQ three weeks after tumor inoculation. Bone volume/tissue volume (BV/TV), trabecular number (Tb.N.), trabecular thickness (Tb. Th.), and trabecular separation (Tb. Sp.). n=10/group. (d) Ex vivo murine bone-breast cancer cell organ cultures established with murine EO771-luciferase cancer cells and murine tibias. (e) Representative bioluminescence images of tibiae bearing with EO771 cells four days after cell injection. (f) Expression of the senescence marker p16Ink4a in bones injected with EO771 breast cancer cells or saline cultured ex vivo for five days in the presence/absence of DQ. (g) Level of the bone resorption marker (CTX) and the formation marker (P1NP) in the culture media of bones injected with EO771 breast cancer cells or saline cultured ex vivo for five days in the presence/absence of DQ. n=5-6/group. *p<0.05 (0.002 to <0.0001) vs. vehicle by One Way ANOVA. Data are shown as mean ± SD; each dot represents an independent sample.
Figure 8.
Figure 8.. Breast cancer cells enhance osteocyte's osteoclastogenic potential via cellular senescence.
(a) Prevalence of double positive p16Ink4a-Rankl in cells isolated from control mice (naïve) and mice with established breast cancer bone metastasis (BCa) in the scRNAseq dataset. (b) Bubble plot comparing expression of selected pro-osteoclastogenic markers in primary osteocytes (Ots) isolated from naïve vs. BCa mice. Bubble size is proportional to the percentage of cells in each cluster expressing a gene, and color intensity is proportional to average scaled gene expression within a cluster. Rankl expression in Ocy454 (c), MLOA-5 (d), and MLOY-4 (e) cells treated with conditioned media (CM) from murine EO771 (left) or human MDA-MB-231 (right) breast cancer cells for two days. n=3/group. (f) Expression of p16Ink4a, Rankl, Mmp13, and Cthrc1 in Ocy454 osteocytes treated with vehicle or CM from EO771 breast cancer cells cultured in the presence/absence of the senolytic agents Dasatinib and Quercetin (DQ) for two days. n=6/group. (g) Representative images and quantification of TRAP+ cells in pre-osteoclast cultures treated with CM from control or senescent Ocy454 osteocytes. n=4/group. Scale bars, 100 μm. *p<0.05 (0.030 to <0.0001) vs. vehicle by Student's t-test (c-e, and g) or vs. vehicle by One-Way ANOVA (f). Data are shown as mean ± SD; each dot represents an independent sample; representative experiments out of two are shown.

Update of

References

    1. Croucher PI, McDonald MM, and Martin TJ. Bone metastasis: the importance of the neighbourhood. Nat Rev Cancer. 2016;16(6):373–86. - PubMed
    1. Guise TA. The vicious cycle of bone metastases. J Musculoskelet Neuronal Interact. 2002;2(6):570–2. - PubMed
    1. Bonewald LF. The Amazing Osteocyte. J Bone Miner Res. 2011;26(2):229–38. - PMC - PubMed
    1. Sabol HM, Amorim T, Ashby C, Halladay D, Anderson J, Cregor M, et al. Notch3 signaling between myeloma cells and osteocytes in the tumor niche promotes tumor growth and bone destruction. Neoplasia. 2022;28:100785. - PMC - PubMed
    1. Delgado-Calle J, Anderson J, Cregor MD, Condon KW, Kuhstoss SA, Plotkin LI, et al. Genetic deletion of Sost or pharmacological inhibition of sclerostin prevent multiple myeloma-induced bone disease without affecting tumor growth. Leukemia. 2017;31(12):2686–94. - PMC - PubMed

MeSH terms