. 2024 Oct 16;481(20):1449-1473.
doi: 10.1042/BCJ20240456.

CDS2 expression regulates de novo phosphatidic acid synthesis

Affiliations

CDS2 expression regulates de novo phosphatidic acid synthesis

Daniel M Collins et al. Biochem J. .

Abstract

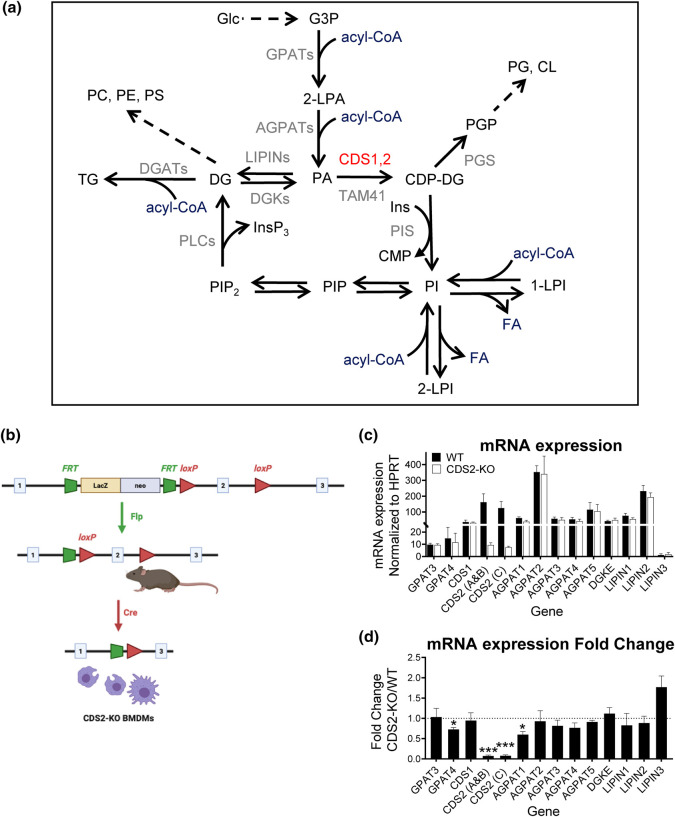
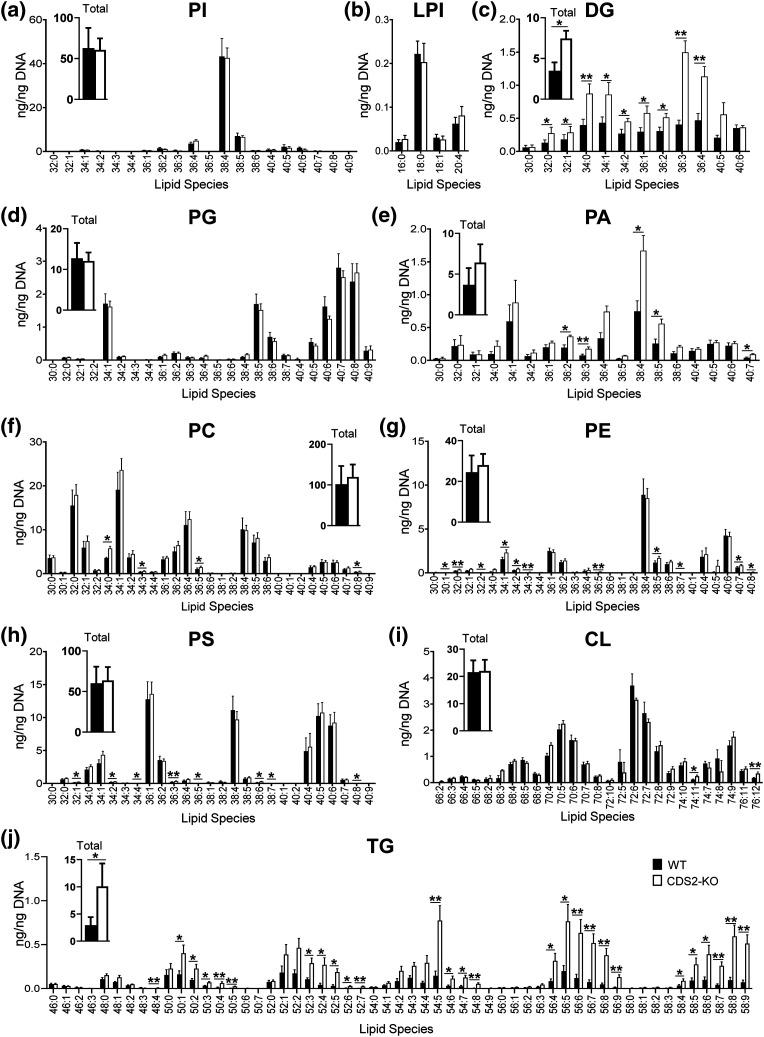
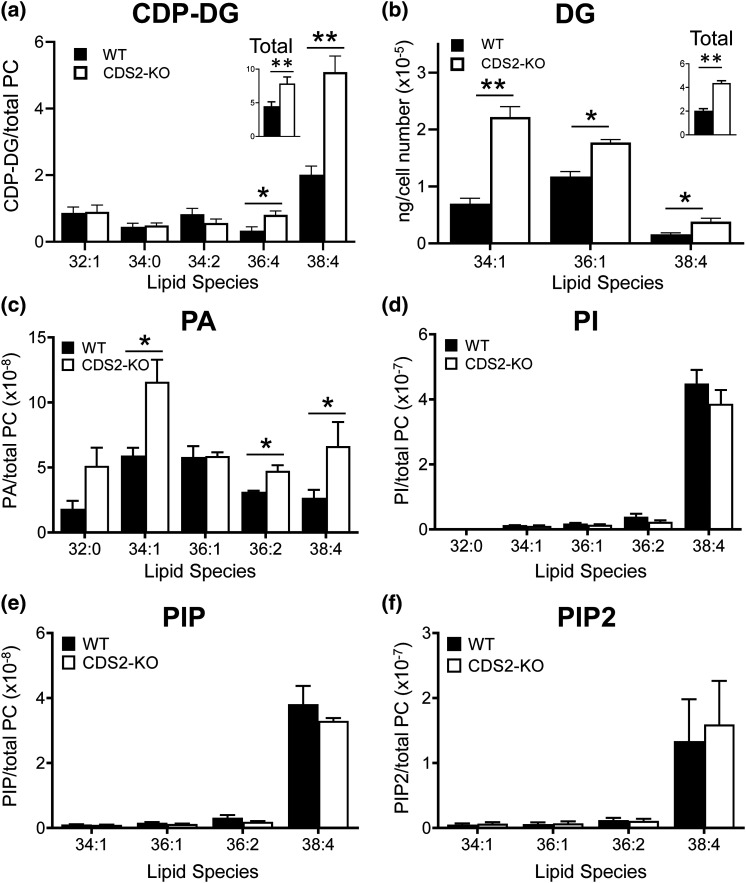
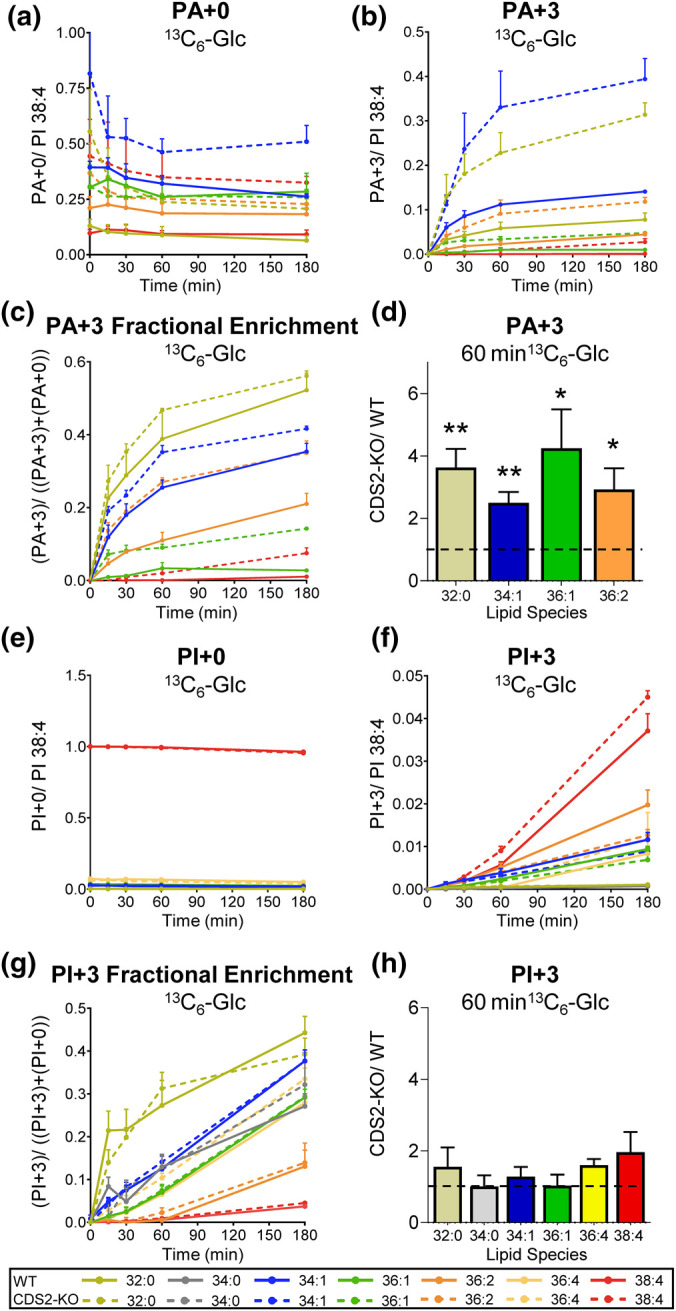
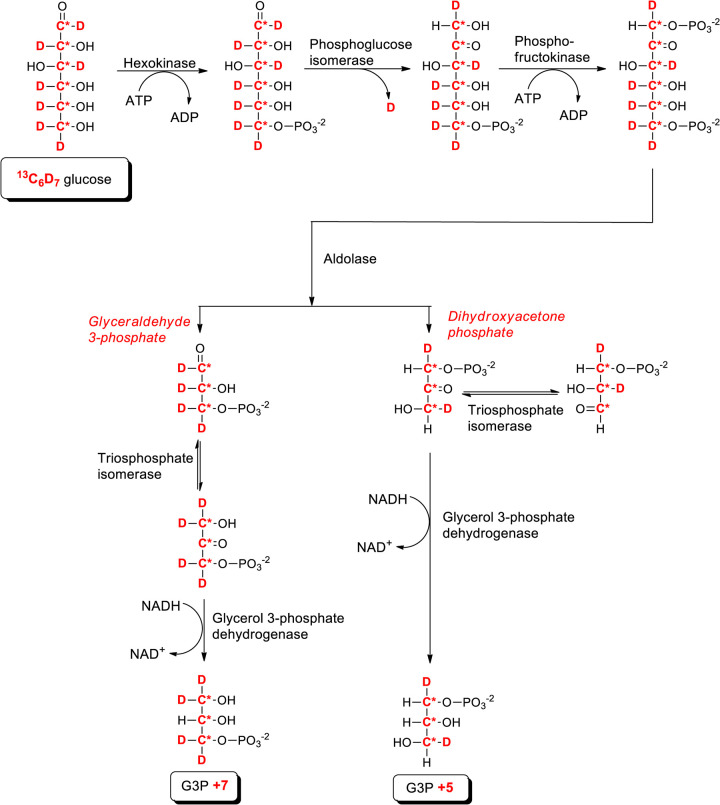
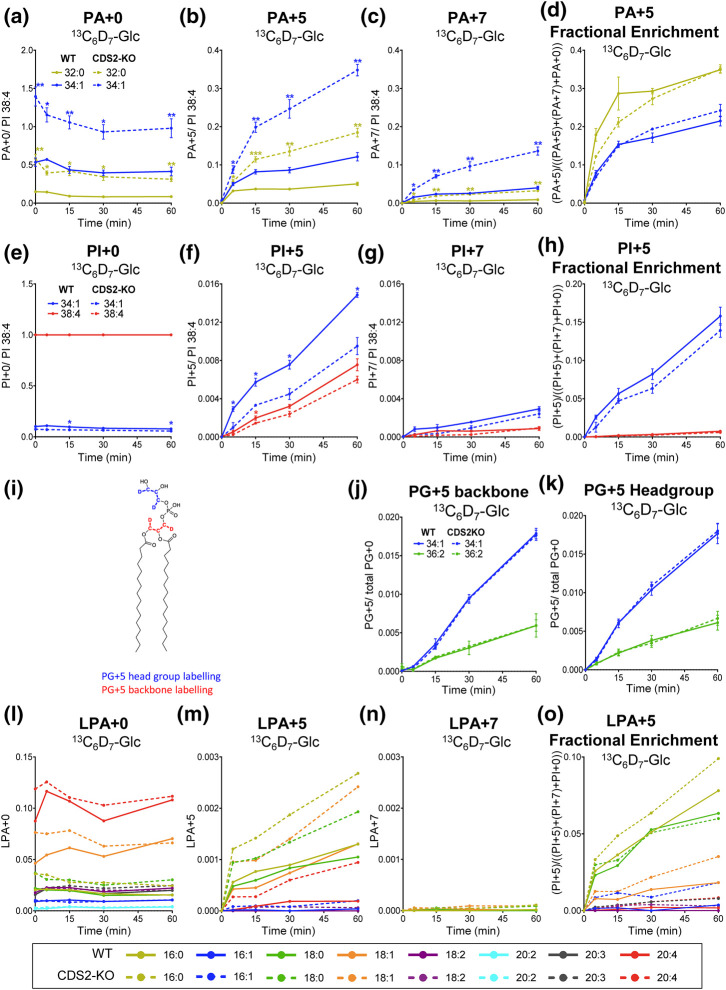
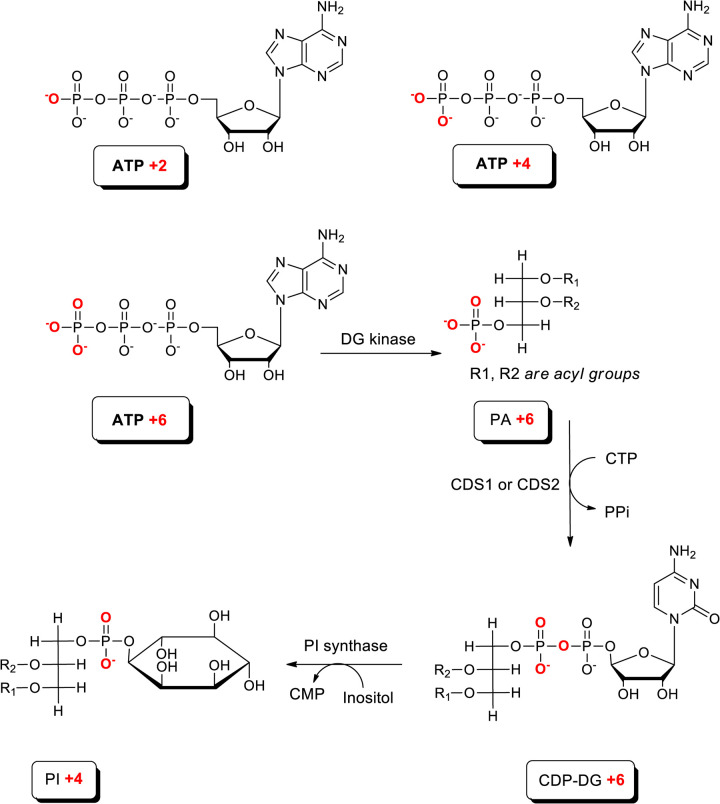
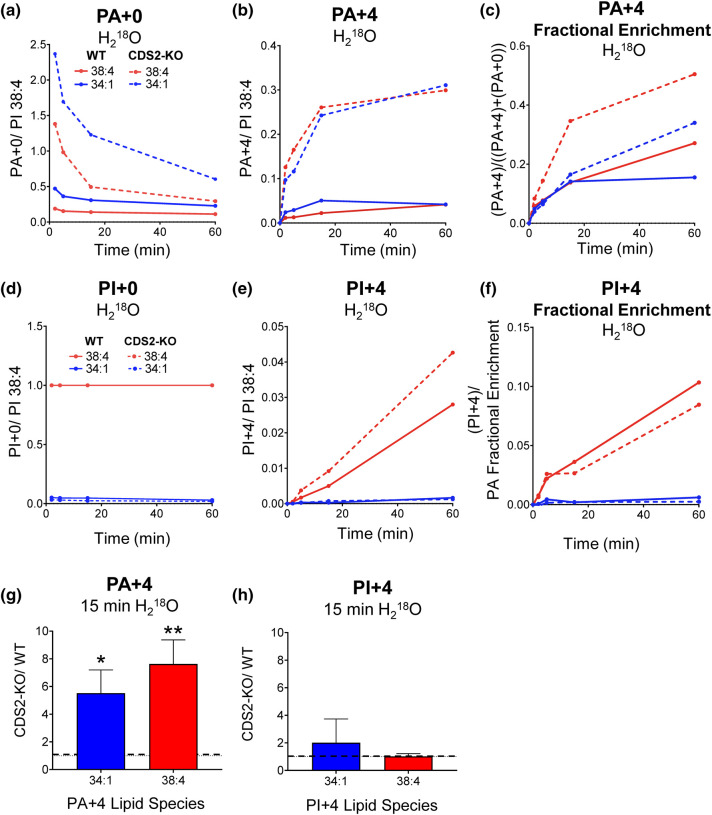
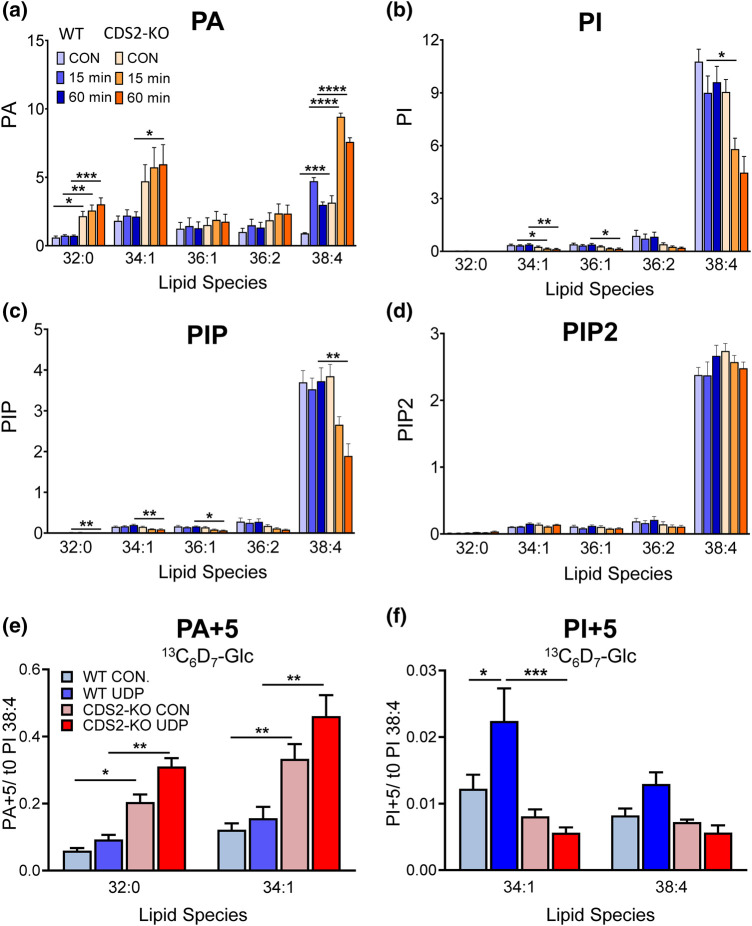
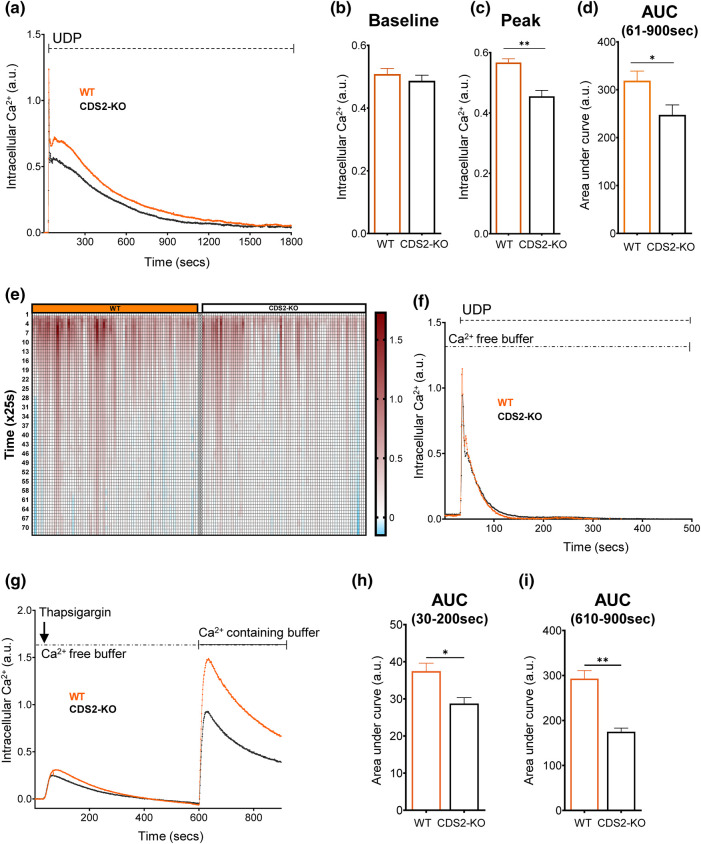
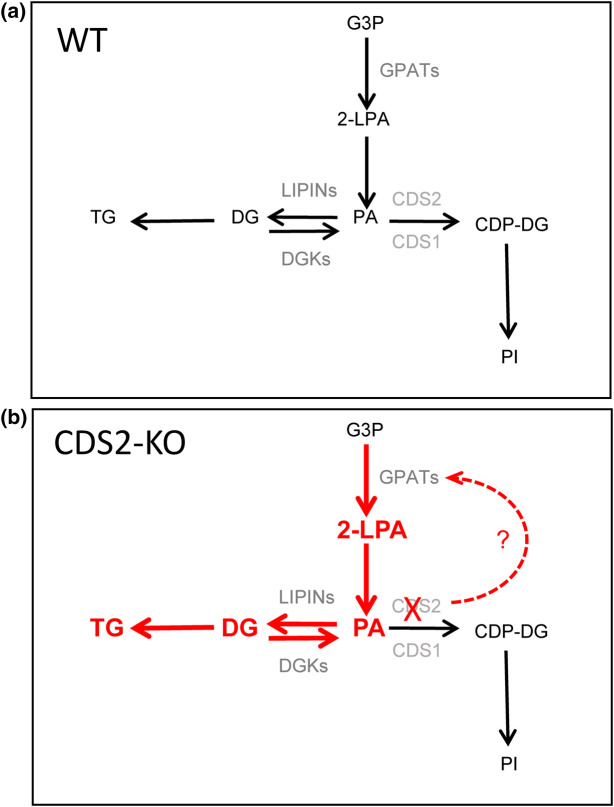
CDS enzymes (CDS1 and 2 in mammals) convert phosphatidic acid (PA) to CDP-DG, an essential intermediate in the de novo synthesis of PI. Genetic deletion of CDS2 in primary mouse macrophages resulted in only modest changes in the steady-state levels of major phospholipid species, including PI, but substantial increases in several species of PA, CDP-DG, DG and TG. Stable isotope labelling experiments employing both 13C6- and 13C6D7-glucose revealed loss of CDS2 resulted in a minimal reduction in the rate of de novo PI synthesis but a substantial increase in the rate of de novo PA synthesis from G3P, derived from DHAP via glycolysis. This increased synthesis of PA provides a potential explanation for normal basal PI synthesis in the face of reduced CDS capacity (via increased provision of substrate to CDS1) and increased synthesis of DG and TG (via increased provision of substrate to LIPINs). However, under conditions of sustained GPCR-stimulation of PLC, CDS2-deficient macrophages were unable to maintain enhanced rates of PI synthesis via the 'PI cycle', leading to a substantial loss of PI. CDS2-deficient macrophages also exhibited significant defects in calcium homeostasis which were unrelated to the activation of PLC and thus probably an indirect effect of increased basal PA. These experiments reveal that an important homeostatic response in mammalian cells to a reduction in CDS capacity is increased de novo synthesis of PA, likely related to maintaining normal levels of PI, and provides a new interpretation of previous work describing pleiotropic effects of CDS2 deletion on lipid metabolism/signalling.

Keywords: CDP-DG; CDS2; lipidomics; metabolism; phosphatidic acids; phosphatidylinositol.


Conflict of interest statement

The authors declare that there are no competing interests associated with the manuscript.

Figures

Figure 1.
Figure 1.. Creation of CDS2-KO mouse macrophages.
(a) The position of CDS2 in the metabolic pathways of lipid biosynthesis. (b) A schematic overview of the generation of CDS2-KO mouse macrophages. CDS2-targetted embryonic stem cells were purchased from the UCDAVIS KOMP Repository (KOMP ES cell line Cds2tm1a(KOMP)Wtsi). Mice generated from these stem cells were first crossed with mice expressing FLPe, resulting in the excision of the LacZ-neo selection cassette. The offspring of this cross were then further crossed with LysM-Cre-expressing mice, resulting in the myeloid-selective deletion of exon-2 of the CDS2 gene and subsequent generation of a frameshift mutation during bone marrow differentiation into mature macrophages. (c) qRT-PCR analysis of the mRNA levels for relevant genes in bone marrow-derived macrophages. CDS2 (A,B and C) refer to different potential transcripts of the CDS2 gene, as described in Supplementary Figure S1. Values for mRNA expression were normalised to the HPRT gene and are represented as means ± S.E.M (n = 3). (d) mRNA levels represented as fold changes between WT and CDS2-KO macrophages. Statistical significance was assessed using one sample t-test of three independent biological experiments (n = 3) and represented as mean ± S.E.M (*P <0.05, **P <0.01, ***P <0.001).
Figure 2.
Figure 2.. A broad overview of the steady-state levels of major lipid species in WT and CDS2-KO macrophages.
PI, DG, PG, PA, PC, PE, PS, CL, and TG molecular species in WT (black filled bars) or CDS2-KO (open bars) macrophages were analysed by untargeted mass spectrometry using an Orbitrap coupled to liquid chromatography (LC–MS). The total levels for the lipid subclasses measured are included as insets in the relevant panels. LPI was analysed using a Triple Quad coupled to liquid chromatography (LC–MS/MS). Data is presented in nanograms (ng) of lipid (calculated as the ratio of the area of each molecular species to the area of a known quantity of internal standard) normalised to the DNA concentration in the initial cellular extract and represent means ± S.E.M (n = 4). Statistical significance was assessed using paired student's t-test for total lipid levels and ratio-paired student's t-test for individual molecular species of four independent biological experiments (*P < 0.05, **P < 0.01).
Figure 3.
Figure 3.. A targeted mass spectrometry analysis of selected lipid species in WT and CDS2-KO macrophages.
The indicated lipid species in WT or CDS2-KO macrophages were analysed by targeted mass spectrometry using a Triple Quad coupled to liquid chromatography (LC–MS/MS). Data are either response ratios (peak areas corrected for the recovery of the internal standard) normalised to peak areas for total PC (for PA, PI, PIP, PIP2; trial experiments indicated this was the most robust normalisation method to compare different WT and CDS2-KO macrophage cultures derived from independent mice, see Supplementary Figure S3; n = 3), or peak areas normalised to peak areas for total PC (for CDP-DG; no internal standard for CDP-DG was available; n = 4), or ng corrected to cell number (for DG; ng calculated from a standard curve using known amounts of DG standard; PC was not measured in these lipid extracts; n = 3) and are means ± S.E.M. Statistical significance was assessed using a ratio-paired student's t-test (*P < 0.05, **P < 0.01).
Figure 4.
Figure 4.. The rates of de novo synthesis of PA and PI in WT and CDS2-KO macrophages assessed by labelling with 13C6-Glc.
13C6-Glucose was added at t =0 and the incorporation of 13C3 (+3 Da) into the glycerol backbone of the major PA and PI species in WT and CDS2-KO macrophages was analysed by LC–MS/MS at the times indicated. Data for the indicated isotopologues (+0=unlabelled; +3=labelled) are response ratios (peak areas corrected to the recovery of the PI internal standard) normalised to the levels of PI 38:4 at t =0 and represent means±S.E.M (n =3). ‘Fractional enrichment’ is defined as the ratio of the indicated +3-isotopologue divided by the sum of labelled and unlabelled isotopologues. Statistical significance was assessed using a one sample t-test (n =3–9) (*P <0.05, **P <0.01).
Figure 5.
Figure 5.. Proposed biosynthetic pathways for the incorporation of heavy isotopes from 13C6D7-Glucose into triose phosphates.
The potential metabolic pathways for incorporation of 13C and 2H (D) nuclei (labelled in red) from 13C6D7-glucose into glycerol 3-phosphate via glycolysis.
Figure 6.
Figure 6.. The rates of de novo synthesis of PA, PI, LPA and PG in WT and CDS2-KO macrophages assessed by labelling with 13C6D7-Glc.
13C6D7-glucose was added at t =0 and the incorporation of either +5 or +7 Da into the indicated isotopologues in WT and CDS2-KO macrophages were analysed by LC–MS/MS at the times indicated. Data are response ratios (peak areas corrected for the recovery of the relevant PA, PI, or LPA internal standards) normalised to PI 38:4 at t =0 (a–c, e–g, l,m), or peak areas (for PG, no PG internal standard was available) normalised to total PG at t =0 (j,k) and represent means±S.E.M (n =3–4). ‘Fractional enrichment’ is defined as the ratio of the indicated +3-isotopologue divided by the sum of labelled and unlabelled isotopologues. Statistical significance was assessed using multiple paired t-test (*P <0.05, **P <0.01). Diagram (i) illustrates the locations of 13C and 2H (D) incorporation (from G3P; see Figure 5) into the PG backbone and headgroup.
Figure 7.
Figure 7.. Proposed pathways for incorporation of heavy isotopes from H218O into PA and PI.
The potential metabolic pathways for incorporation of 18O nuclei (labelled in red) from H218O into PA and PI. Rapid phosphotransferase reactions in the cell lead to the random incorporation of 18O nuclei into the non-bridging oxygens (ie those oxygens not in the phosphate anhydride linkage) in the gamma-phosphate of ATP, to generate ATP+2, +4, or +6 isotopologues. The utilization of these isotopologues of ATP then generates the requisite isotopologues of PA (+2/+4/+6), CDP-DG (+2/+4/+6) and PI (+2/+4); only the utilization of ATP+6 is shown for clarity. In practice, the different potential isotopologues of PA and PI behaved very similarly in our experiments but only data for PA+4 and PI+4 are presented because they represented the most robust measurements with the least signal/noise.
Figure 8.
Figure 8.. The rates of total synthesis of PA and in WT and CDS2-KO macrophages assessed by labelling with H218O.
H218O was added at t =0 and the incorporation of 18O2 (+4 Da) into the 34:1-and 38:4-species of PA and PI in WT or CDS2-KO macrophages were analysed by LC–MS/MS at the times indicated. Data are response ratios (peak areas corrected for the recovery of the relevant PA or PI internal standards) normalised to PI 38:4 at t =0 and show one representative experiment of three that produced similar results (a,b, d,e). ‘Fractional Enrichment’ for PA is defined as the ratio of the +4-isotopologue divided by the sum of labelled and unlabelled isotopologues (c) or ‘Fractional Enrichment’ for PI is defined as the ratio of the +4-isotopologue divided by the ‘PA Fractional Enrichment’ (to correct for the change in precursor PA labelling between WT and CDS2-KO (f). Fold change of PA+4 (g) and PI+4 (corrected for ‘PA Fractional Enrichment’; (h) at 15 min labelling represent means ± S.E.M (n = 7). Statistical significance was assessed using one sample t-test (*P <0.05, **P <0.01).
Figure 9.
Figure 9.. The effect of CDS2 deletion on a UDP-stimulated PI cycle.
(a–d) WT or CDS2-KO macrophages were incubated with or without 100 µM UDP for 15 or 60 min before analysis of the major species of PA, PI, PIP and PIP2 by LC–MS/MS. Data are response ratios (peak areas corrected for the recovery of the relevant internal standards) normalised to the mean of each vehicle control for PI 38:4 (except for PA, where the t = 15 min UDP mean was used because it exhibited less variation between biological replicates). Statistical significance was assessed using two-way ANOVA with Šídák's test to correct for multiple comparisons of four independent biological experiments (n =4) and data represented as mean ± S.E.M. (*P < 0.05, **P < 0.01, ***P < 0.001). (e,f) WT or CDS2-KO macrophages were labelled with 13C6D7-glucose for 30 min prior to incubation with or without 100 µM UDP for 30 min and then incorporation of +5 Da into the indicated isotopologues of PA and PI in WT analysed by LC–MS/MS (data for the analogous +7 isotopologues are shown in Supplementary Figure S5). Data are response ratios (peak areas corrected for the recovery of the relevant internal standards) normalised to PI 38:4 at t =0 and represent means ± S.E.M. (n = 3). Statistical significance was assessed using a two-way ANOVA with Tukey's test to correct for multiple comparisons (*P <0.05, **P <0.01, ***P <0.001).
Figure 10.
Figure 10.. The effect of loss of CDS2 on a UDP-stimulated Ca2+ response.
(a) WT or CDS2-KO macrophages preloaded with Fura-PE3/AM were incubated in Ca2+-containing medium and their intracellular Ca2+ concentration analysed by fluorescent imaging. One hundred micromolars of UDP was added at t =30 s and incubations continued for the times indicated. Data are line traces representing the mean intracellular Ca2+ concentration from four independent biological experiments, after subtraction of the baseline value (average value before addition of UDP). (b–d) Baseline (average value pre-stimulation), peak height (maximum value after addition of UDP, within the time range of 36–50 s, baseline subtracted) and integrated Ca2+ responses (area under curve, between 61 and 900 s after addition of UDP, baseline subtracted) in WT or CDS2-KO BMDMs for experiments described in (a). Data are means ± S.E.M. (n = 4). Statistical significance was assessed using student's paired t-test (*P < 0.05, **P < 0.01, ***P < 0.001). (e) A representative spaghetti plot illustrating the heterogeneity in Ca2+responses of single cells taken from one experiment described in (a) (y-axis in time x25 s). (f) WT or CDS2-KO macrophages preloaded with Fura-PE3/AM were incubated in Ca2+-free medium and their intracellular Ca2+ concentration analysed by fluorescent imaging. One hundred micromolars of UDP was added at t = 30 s and incubations continued for the times indicated. Data are line traces representing the mean intracellular Ca2+ concentration from four independent biological experiments (baseline subtracted). (g) WT or CDS2-KO macrophages preloaded with Fura-PE3/AM were incubated in Ca2+-free medium before addition of 2.5 µM Thapsigargin at t = 30 s. Incubations were continued until t = 600 s, at which point the medium was replaced by a wash-in of Ca2+-containing medium (in the absence of Thapsigargin). Data are line traces representing the mean of three independent biological experiments (baseline subtracted). (h,i) Area-under-curve values for the indicated time frames from experiments described in (g). Data are means ± S.E.M. (n = 3). Statistical significance was assessed using student's paired t-test (*P < 0.05, **P < 0.01, ***P < 0.001).
Figure 11.
Figure 11.. The effect of CDS2 deletion on basal lipid metabolism.
(a,b) illustrate the effect of CDS2-deletion on relevant elements of basal lipid metabolism (see Figure 1a for the wider context). Loss of CDS2 is suggested to increase GPAT activity by an unknown mechanism, leading to increased flux through the de novo synthesis pathways marked in red. The increased levels of PA in CDS2-KO macrophages drives increased CDS1 activity, compensating for loss of CDS2 and maintaining basal levels of PI. This increased synthesis of PA also drives increased flux through LIPINs, leading to increased synthesis of DG and TG.

References

    1. Blunsom, N.J. and Cockcroft, S. (2020) CDP-diacylglycerol synthases (CDS): gateway to phosphatidylinositol and cardiolipin synthesis. Front. Cell Dev. Biol. 8, 63 10.3389/fcell.2020.00063 - DOI - PMC - PubMed
    1. Balla, T. (2013) Phosphoinositides: tiny lipids with giant impact on cell regulation 93, 1019–1137 10.1152/physrev.00028.2012 - DOI - PMC - PubMed
    1. Dickson, E.J. and Hille, B. (2019) Understanding phosphoinositides: rare, dynamic, and essential membrane phospholipids. Biochem. J. 476, 1–23 10.1042/bcj20180022 - DOI - PMC - PubMed
    1. Hammond, G.R.V. and Burke, J.E. (2020) Novel roles of phosphoinositides in signaling, lipid transport, and disease. Curr. Opin. Cell Biol. 63, 57–67 10.1016/j.ceb.2019.12.007 - DOI - PMC - PubMed
    1. Blunsom, N.J., Gomez-Espinosa, E., Ashlin, T.G. and Cockcroft, S. (2017) Mitochondrial CDP-diacylglycerol synthase activity is due to the peripheral protein, TAMM41 and not due to the integral membrane protein, CDP-diacylglycerol synthase 1. Biochim. Biophys. Acta 1863, 284–298 10.1016/j.bbalip.2017.12.005 - DOI - PMC - PubMed

Publication types

MeSH terms

LinkOut - more resources