. 2024 Sep 3;24(9):15.
doi: 10.1167/jov.24.9.15.

The preferred retinal loci when the eyes converge

Affiliations

The preferred retinal loci when the eyes converge

Norick R Bowers et al. J Vis. .

Abstract

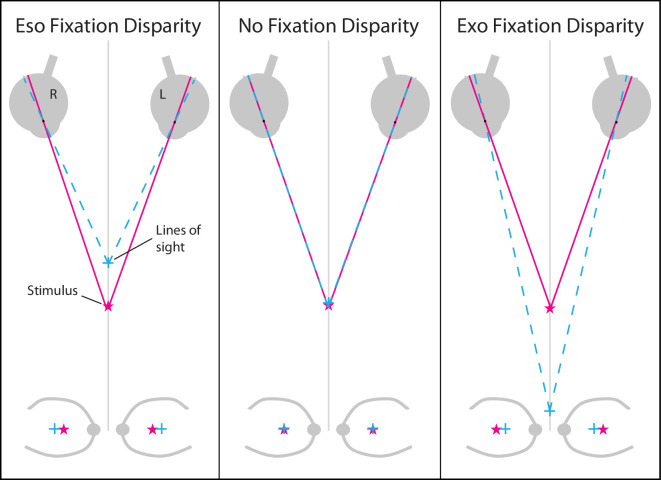
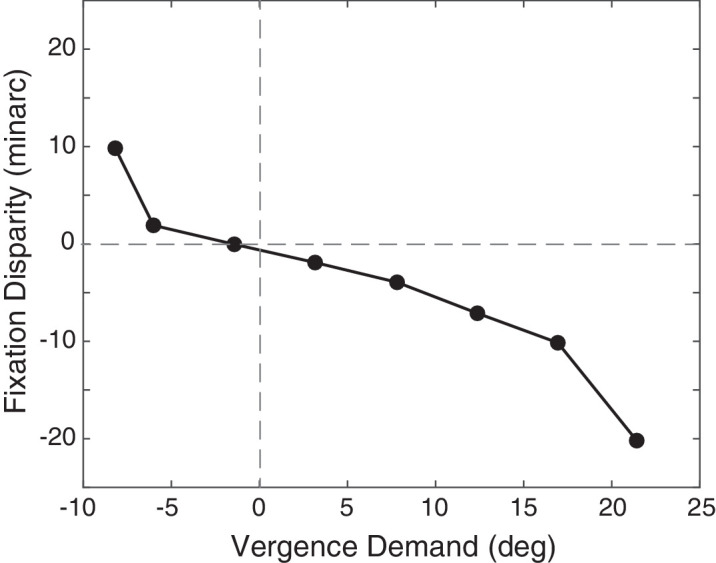
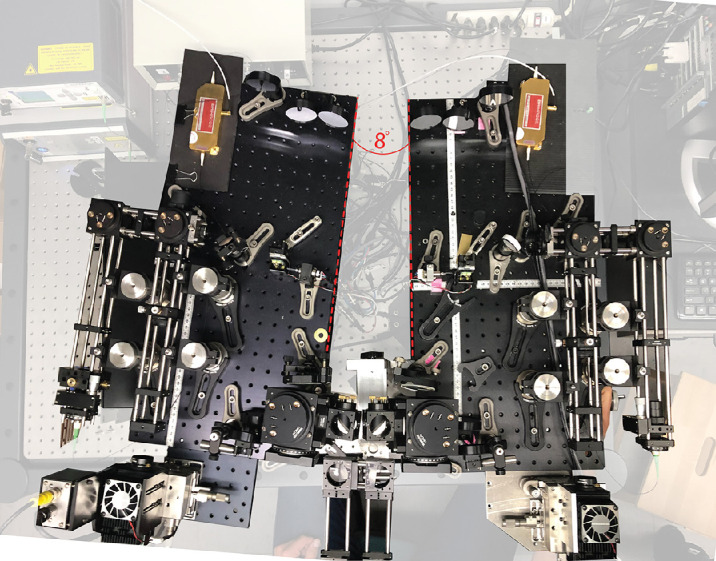
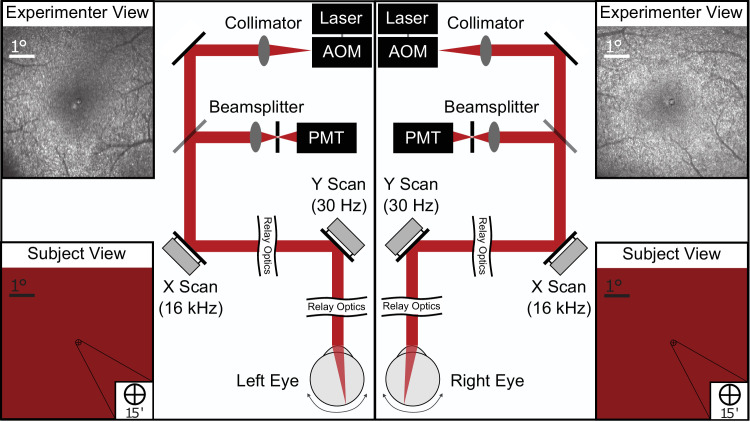
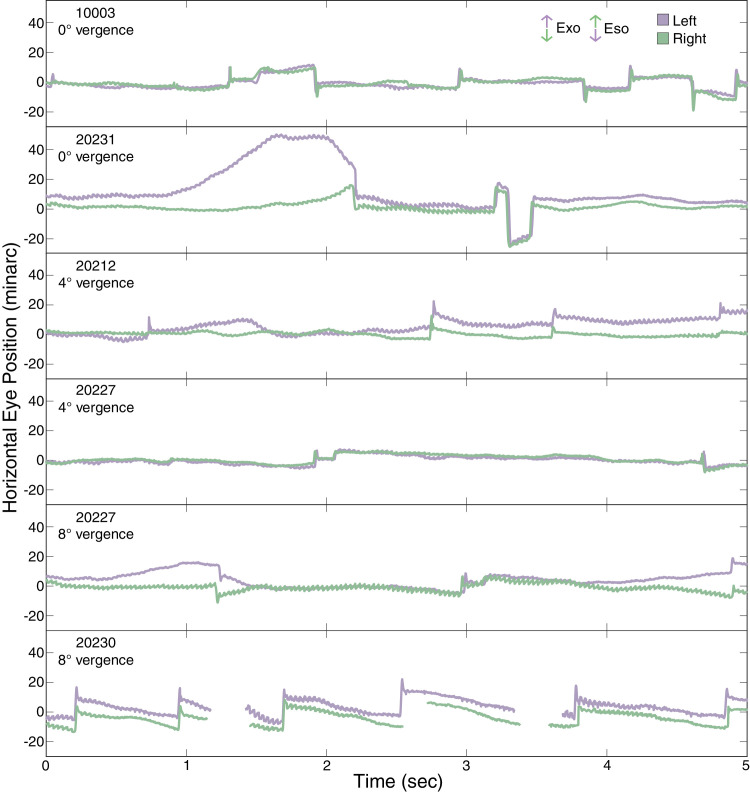
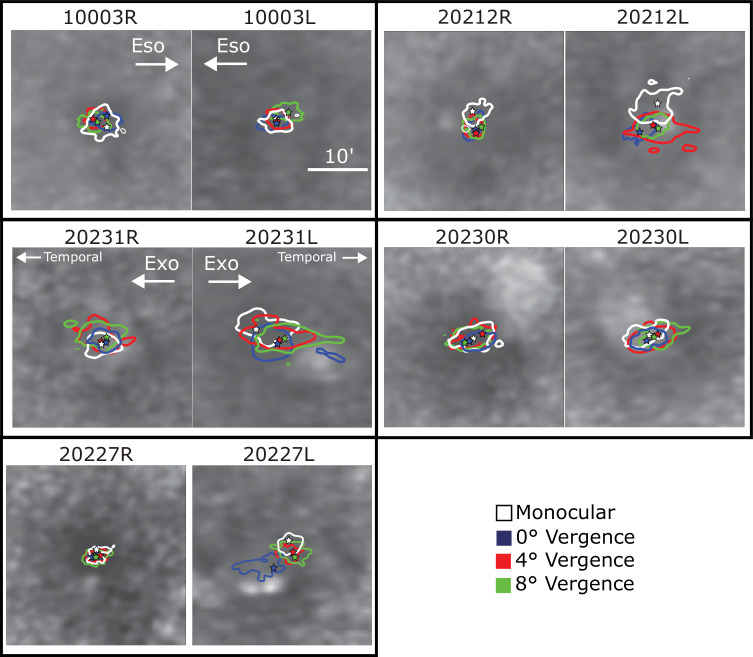
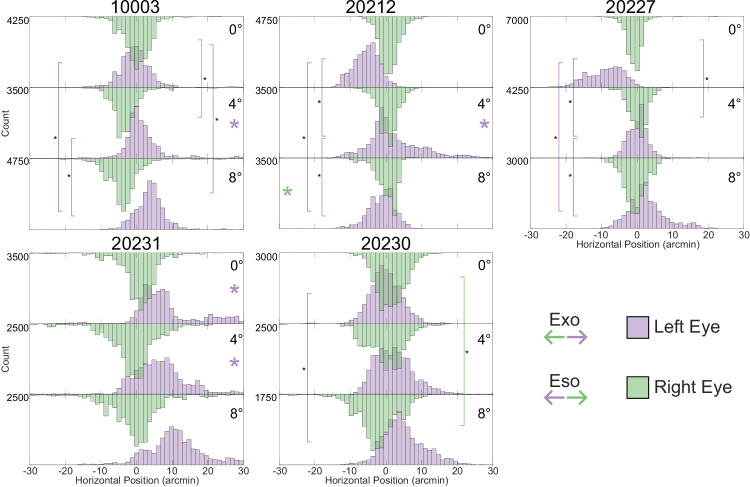
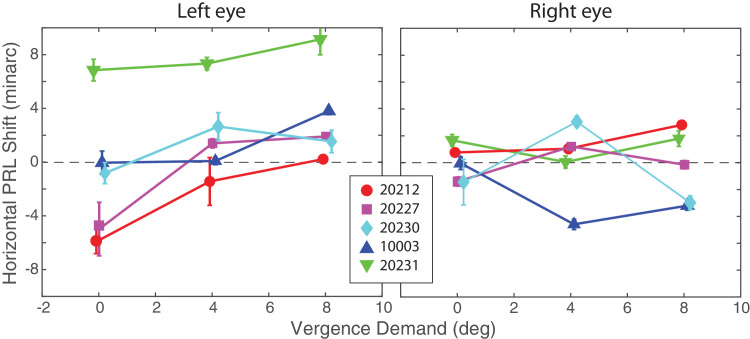
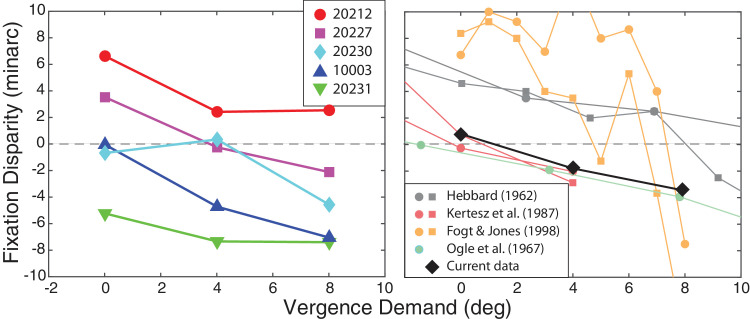
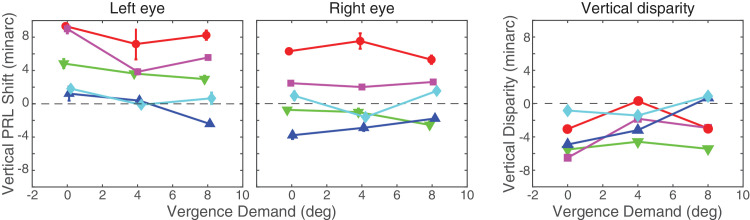
The preferred retinal locus (PRL) is the position on the retina to which humans direct stimuli during fixation. In healthy normal eyes, it has been shown to be very stable across time and between different tasks. Previous measurements of the PRL have been made under monocular viewing conditions. The current study examines where the PRLs in the two eyes' retinas are when subjects fixate binocularly and whether they shift when the demand for the eyes to converge is changed. Our apparatus allows us to see exactly where binocular stimuli fell on the two retinas during binocular fixation. Thus, our technique bypasses some of the issues involved in measuring binocular alignment with subjective techniques and previous objective techniques that use conventional eye trackers. These results show that PRLs shift slightly but systematically as the demand for convergence increases. The shifts cause under-convergence (also called exo fixation disparity) for near targets. They are not large enough to cause a break in binocular fusion. The fixation disparity we observed with increasing vergence demand is similar to fixation disparity observed in previous reports.


Figures

Figure 1.
Figure 1.
Schematic of eso and exo fixation disparity in the world and their respective projections on the retina. The panels from left to right illustrate, respectively, eso fixation disparity, no fixation disparity, and exo fixation disparity. In the upper panels the pink stars indicate the position of the stimulus in space, and the cyan crosses where the lines of sight from the two eyes intersect. The lower plots are schematic retinal images in conventional fundus-view orientation with the optic nerve and major blood vessels shown for reference. The fovea (cross) and the projection of the stimulus (star) are shown in each case. During eso fixation disparity (left), the eyes over-converge, causing the images of the stimulus to be shifted nasally (i.e., leftward in the left eye and rightward in the right eye). During exo fixation disparity (right), the eyes under-converge, which causes temporal shifting of the images of the stimulus.
Figure 2.
Figure 2.
Fixation disparity measured subjectively using dichoptic nonius lines. Negative values of fixation disparity indicate exo disparity and positive values indicate eso disparity. Positive vergence demand indicates convergence. Fixation disparity in minutes of arc is plotted as a function of vergence demand in degrees. Subjects maintain good alignment for a range of vergence demands before fixation disparity becomes large. Adapted from (Ogle et al., 1967).
Figure 3.
Figure 3.
The Binocular TSLO with an 8° vergence demand. The red, dashed lines indicate the angle of rotation.
Figure 4.
Figure 4.
Schematic of the binocular TSLO. Two separate TSLO systems are temporally synced to present images to the two eyes independently. In both cases, a point source of light from the 840nm superluminescent diode is routed through the acousto-optic modulator and sent to the subject’s retina after reflecting off mirrors attached to the two scanners (fast horizontal scan and slow vertical scan). The reflected light is descanned through the optical path and sent to the PMT for imaging. The laser can be turned off at specific points in the raster scan to project a decrement stimulus onto the retinal surface directly. Along the sides of each schematic are examples of the experimenter’s view of the subject’s retina (top) and the subject’s view of the raster and decrement stimuli (bottom). All retinal images are in fundus view. Note that during the experiment the two images of the raster were fused (i.e., seen as a single display). Subjects did not report diplopia during the experiment, but this was not explicitly measured.
Figure 5.
Figure 5.
Binocular eye traces. Examples of eye motion for the left (purple) and right (green) eyes from all subjects and all conditions. Horizontal eye position in minutes of arc is plotted across time in seconds. Vergence demands for each example are indicated. Each eye trace is plotted relative to the PRL identified in the monocular condition: that is, 0 represents the monocular PRL horizontal location.
Figure 6.
Figure 6.
Isoline contours for each subject and vergence demand. The contours that enclose the central 68% of the fixated stimulus locations are plotted on the associated retinal images. Different panels show the data for different subjects and demands. White represents the contours from the monocular condition. Blue, red, and green represent, respectively, the contours for the 0°, 4°, and 8° vergence demands in the binocular condition. The central stars represent the peaks of the kernel density functions; this is a measure of the PRL.
Figure 7.
Figure 7.
Horizontal eye positions in left and right eyes. The upward (purple) histograms are for the left eye and the downward (green) histograms are for the right eye. Shifts consistent with exo and eso fixation disparity directions are indicated in the legend. The 0 point in each histogram represents the monocular PRL for each subject. The central tendency for the distributions shift in such a way that the subject would be increasingly underconverging on the target as the vergence demand increases (exo fixation disparity). This trend can be difficult to discern from these figures, but is discussed in more detail below. The small colored asterisks on the histograms indicate distributions that had high skewness (>0.5). The asterisk is on the right for positive skewness and on the left for negative. The vertical stems indicate statistically significant changes. Significance was tested by a sign-rank test with a post-hoc Bonferonni correction, wherein 100 samples were taken from each distribution and tested against each other in a pairwise fashion for each subject. This was done 1,000 times to obtain 1,000 p values. Significance is only flagged if the entire range of the 95% confidence interval from these 1,000 p values fall below the significance threshold. There were generally more significant differences in the left (nondominant) eye compared to the right.
Figure 8.
Figure 8.
Horizontal PRL shifts in left and right eyes. Horizontal position of the PRL under binocular viewing is plotted for different vergence demands relative to the position under monocular viewing. Left panel shows the shifts in the left eye and right panel shows them in the right eye. Positive values correspond to rightward shifts in the fundus view. The data from each of the five subjects is plotted separately (see legend). Error bars represent the horizontal interquartile range of each PRL estimate (25th–75th percentile). Each distribution was bootstrapped with 1% of the original data, 400 times. Over each new distribution composed of 400 bootstrapped PRLs, the IQR was computed along each horizontal marginal.
Figure 9.
Figure 9.
Fixation disparity. (Left) Mean fixation disparity for each subject in the current study. Fixation disparity in minutes of arc is plotted as a function of vergence demand in degrees. Data from each subject are plotted with different colors and symbols (see legend). We defined fixation disparity for each vergence demand as the difference between the horizontal PRLs in the two eyes, identified at the peak of the kernel density estimation, relative to the monocular PRLs. Positive values indicate an eso fixation disparity (over-convergence) while negative values indicate an exo fixation disparity (under-convergence). (Right) Mean fixation disparity from our experiment compared to the mean fixation disparity from previous experiments. Fixation disparity is plotted as a function of vergence demand. Data from each study is plotted in a different color (see legend). Our data averaged across subjects are represented by black diamonds. Data from the other studies have been averaged across subjects. Circles represent data obtained with subjective methods and squares data obtained with objective methods. The Hebbard (1962) data are from one subject, the Kertesz (1987) data from four, the Fogt (1998a) data from four, and the Ogle (1958) data from one.
Figure 10.
Figure 10.
Vertical PRL shifts. (Left and center) Mean vertical PRL shifts relative to PRLs with monocular viewing. The left panel shows the data for the left eyes and the center panel those from the right eyes. Each color represents the data from one of our subjects as indicated in Figure 9. Vergence demand is the stimulus for horizontal vergence. (Right) The vertical disparity resulting from the left- and right-eye shifts. The error bars represent the vertical interquartile range of the PRL estimates (see Figure 8).

Similar articles

References

    1. Agaoglu, M. N., Sit, M., Wan, D., & Chung, S. T. L. (2018). ReVAS: An open-source tool for eye motion extraction from retinal videos obtained with scanning laser ophthalmoscopy. Investigative Ophthalmology & Visual Science, 59(9), 2161.
    1. Banks, M. S., Van Ee, R., & Backus, B. T. (1997). The computation of binocular visual direction: A re-examination of Mansfield and Legge (1996). Vision Research, 50(2), 1605–1610, 10.1016/s0042-6989(97)83122-7. - DOI - PubMed
    1. Blakemore, C. (1970). The range and scope of binocular depth discrimination in man. Journal of Physiology, 211(3), 599–622, 10.1113/jphysiol.1970.sp009296. - DOI - PMC - PubMed
    1. Botev, Z. I., Grotowski, J. F., & Kroese, D. P. (2010). Kernel density estimation via diffusion. Annals of Statistics, 38(5), 2916–2957, 10.1214/10-AOS799. - DOI
    1. Bowers, N. R., Boehm, A. E., & Roorda, A. (2019). The effects of fixational tremor on the retinal image. Journal of Vision, 19(11), 8, 10.1167/19.11.8. - DOI - PMC - PubMed