. 2024 Nov 4;147(11):3933-3948.
doi: 10.1093/brain/awae224.

Multiple lines of evidence for disruption of nuclear lamina and nucleoporins in FUS amyotrophic lateral sclerosis

Affiliations

Multiple lines of evidence for disruption of nuclear lamina and nucleoporins in FUS amyotrophic lateral sclerosis

Kensuke Okada et al. Brain. .

Abstract

Advanced pathological and genetic approaches have revealed that mutations in fused in sarcoma/translated in liposarcoma (FUS/TLS), which is pivotal for DNA repair, alternative splicing, translation and RNA transport, cause familial amyotrophic lateral sclerosis (ALS). The generation of suitable animal models for ALS is essential for understanding its pathogenesis and developing therapies. Therefore, we used CRISPR-Cas9 to generate FUS-ALS mutation in the non-classical nuclear localization signal (NLS), H517D (mouse position: H509D) and genome-edited mice. Fus WT/H509D mice showed progressive motor impairment (accelerating rotarod and DigiGait system) with age, which was associated with the loss of motor neurons and disruption of the nuclear lamina and nucleoporins and DNA damage in spinal cord motor neurons. We confirmed the validity of our model by showing that nuclear lamina and nucleoporin disruption were observed in lower motor neurons differentiated from patient-derived human induced pluripotent stem cells (hiPSC-LMNs) with FUS-H517D and in the post-mortem spinal cord of patients with ALS. RNA sequence analysis revealed that most nuclear lamina and nucleoporin-linking genes were significantly decreased in FUS-H517D hiPSC-LMNs. This evidence suggests that disruption of the nuclear lamina and nucleoporins is crucial for ALS pathomechanisms. Combined with patient-derived hiPSC-LMNs and autopsy samples, this mouse model might provide a more reliable understanding of ALS pathogenesis and might aid in the development of therapeutic strategies.

Keywords: FUS; amyotrophic lateral sclerosis; nuclear lamina; nuclear pore complex.


Conflict of interest statement

H.O. reports grants and personal fees as a Chief Scientific Officer from K Pharma, Inc. during the conduct of the study; personal fees from Sanbio Co. Ltd., outside the submitted work. In addition, H.O. has a patent on a therapeutic agent for amyotrophic lateral sclerosis and composition for treatment licensed to K Pharma, Inc. The other authors have declared that no conflict of interest exists.

Figures

Figure 1
Figure 1
Generation of FusWT/H509D genome-edited mice. (A) Alignment of amino acids in the nuclear localization signal (NLS) of fused in sarcoma (FUS) in different mammalian species. The NLS is highly conserved between humans and rodents. Red indicates the H517 residue. (B) Design of single-stranded oligodeoxynucleotides (ssODN) in the CRISPR-Cas9-based genome editing approach. Silent mutations without amino acid mutations were inserted (in bold and red) to prevent re-cleavage by the guide ribonucleic acid (gRNA) after genome editing. The mouse position corresponding to human H517 is H509. (C) Sequence of NLS of Fus in wild-type (WT) and FusWT/H509D mice. (D) Expression of FUS in the mouse spinal cord. Tissues from wild-type and FusWT/H509D mice at 25 months were blotted using an FUS antibody. β-Actin was used as the loading control. (E) Ratio of FUS/β-actin in the spinal cord from wild-type and FusWT/H509D mice at 25 months (overlaid bar graph and dot plot). Data are presented as the mean ± SEM. Student’s t-test was used to calculate statistical significance. ***P < 0.001.
Figure 2
Figure 2
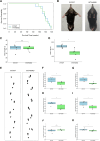
Phenotypes of FusWT/H509D mice. (A) Kaplan–Meier survival analysis of wild-type (WT) and FusWT/H509D mouse lines (n = 10, male = 5 and female = 5 for each group). Statistical significance was calculated using the log-rank test. No significant difference was observed in the survival curves between wild-type and FusWT/H509D mice. (B) Representative picture of an abnormal limb posture in FusWT/H509D mice. At 12 months, FusWT/H509D mice exhibited abnormal reflexes. (C and D) Body weight and accelerating rotarod test of wild-type and FusWT/H509D mice (25 months, n = 5 per genotype, male). No significant difference was observed in body weight between wild-type and FusWT/H509D mice (C); however, mutant mice exhibited motor deficits in the accelerating rotarod test (D). (E) Footprints of wild-type and FusWT/H509D mice at 25 months. (FK) DigiGait analysis in wild-type and FusWT/H509D mice (25 months, n = 5 per genotype, male). Graphs represent quartiles (boxes), 50th percentile (centreline) and 1.5 times the interquartile range (whiskers). Student’s t-test was used to calculate statistical significance. *P < 0.05 and **P < 0.01. n.s. = no statistical significance.
Figure 3
Figure 3
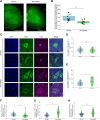
Motor neuron loss and FUS mislocalization into the cytoplasm in the spinal cord of FusWT/H509D mice. (A) Immunofluorescence images of the spinal cord with choline-acetyltransferase (ChAT) (green) staining in wild-type (WT) and FusWT/H509D mice at 18 months. Scale bars = 200 μm. (B) Boxplot showing the number of ChAT+ neurons in the anterior horn of the spinal cord in wild-type and FusWT/H509D mice (18 months, n = 3 per genotype, six sections per individual, male). Graphs represent quartiles (boxes), 50th percentile (centreline) and 1.5 times the interquartile range (whiskers). The Wilcoxon signed-rank test was used to calculate statistical significance. ***P < 0.001. (C) Immunofluorescence images of the spinal cord with ChAT (green) and FUS (magenta) staining in wild-type and FusWT/H509D mice at 18 months. Scale bars = 20 μm. (D and E) Box plots showing quantification of the area of the nucleus (D) and cytoplasm (E) in ChAT+ neurons in the anterior horn of the spinal cord (18 months, n = 3 per genotype, 46 cells wild-type; 48 cells FusWT/H509D, male). ***P < 0.001. (FH) Box plots showing quantification in the nucleus of FUS (F), in the cytoplasm of FUS (G) and total cellular FUS (H) in ChAT+ neurons in the anterior horn (18 months, n = 3 per genotype, 46 cells wild-type; 48 cells FusWT/H509D, male). **P < 0.01 and ***P < 0.001.
Figure 4
Figure 4
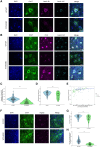
Disruption of the nuclear Lamina B1 and Lamin A/C and nucleoporins in FusWT/H509D mice. (A) Immunofluorescence images of the spinal cord with anti-ChAT (green), Lamin B1 (magenta) and Lamin A/C (cyan) antibodies in wild-type (WT) and FusWT/H509D mice at 18 months. Images are representative of n = 3 experiments. Scale bars = 20 μm. (B) Immunofluorescence images of the spinal cord with anti-ChAT (green), FUS (magenta) and Lamin A/C (cyan) antibodies in wild-type and FusWT/H509D mice at 18 months. Images are representative of n = 3 experiments. Scale bars = 20 μm. (C) Violin plot showing the quantification of Lamin B1 intensity in ChAT+ neurons in the anterior horn of the spinal cord in wild-type and FusWT/H509D mice (18 months, n = 3 per genotype, 84 cells wild-type, 81 cells FusWT/H509D, male). Graphs represent quartiles (boxes), 50th percentile (centreline) and 1.5 times the interquartile range (whiskers). Student’s t-test was used to calculate statistical significance. ***P < 0.001. (D) Violin plot showing the quantification of nuclear lamina circularity in ChAT+ neurons in the anterior horn in wild-type and FusWT/H509D mice (18 months, n = 3 per genotype, 103 cells wild-type, 86 cells FusWT/H509D, male). (E) Scatter plot showing circularity of Lamin A/C and nucleus/cytoplasm (N/C) ratio of FUS adjusted by area in ChAT+ neurons in the anterior horn (18 months, n = 3 per genotype, 46 cells wild-type, 48 cells FusWT/H509D, male). Simple linear regression slope. ***P < 0.001. (F) Immunofluorescence images of the spinal cord with ChAT (green) and Nup62 (magenta) staining in wild-type and FusWT/H509D mice at 18 months. Scale bars = 20 μm. (G and H) Violin plots showing the quantification of nucleoporin (Nup62) circularity (G) and intensity ratio (H) in ChAT+ neurons in the anterior horn (18 months, n = 3 per genotype, 110 cells wild-type, 97 cells FusWT/H509D, male). ***P < 0.001. ChAT = choline acetyltransferase.
Figure 5
Figure 5
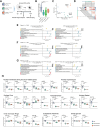
RNA sequencing analyses revealed decreased expression levels of the nuclear lamina and nucleoporins in human induced pluripotent stem cell-derived lower motor neurons with FUS-H517D. (A) Schematic diagram illustrating the generation of induced pluripotent stem cell-derived motor neurons (iPSC-MNs) from healthy donor-derived iPSCs (n = 3), patients with familial amyotrophic lateral sclerosis and FUSWT/H517D-derived iPSCs (n = 2), and iPSCs with the homozygous FUSH517D/H517D mutation derived from healthy donor iPSCs (n = 1). After 2 days of incubation, neurite length was measured from Days 3 to 14, and RNA was collected on Day 14 of incubation. (B) The normalized maximum neurite length in iPSC-LMNs. Graphs represent quartiles (boxes), 50th percentile (centreline) and 1.5 times the interquartile range (whiskers). Dunnett’s test was used to calculate statistical significance. **P < 0.01 and ***P < 0.001. (C and D) Principal component (PC) analysis results for transcriptomes in Healthy-, H517D hetero- and H517D homo-LMNs (C) and Pearson correlation analysis (D) (purple, Healthy; green, H517D hetero-1 or -2; orange, H517D homo). (EG) Results of gene expression analysis in Healthy-, H517D hetero-1- and 2- and H517D homo-LMNs. Significant differences in expression levels were observed between groups of different classes (alphabets) (the size of the expression levels was not considered). Results of functional analysis of gene group with significantly increased (E, left) or decreased (E, right) expression in H517D hetero- and H517D homo-LMNs compared with Healthy-LMNs, gene group with significantly increased (F, left) or decreased (F, right) expression in H517D homo-LMNs compared with H517D hetero- and Healthy-LMNs, and gene group whose expression was upregulated (G, left) or downregulated (G, right) in Healthy-, H517D hetero- and H517D homo-LMNs, in that order. The top three terms for each biological pathway, cellular component, molecular function and KEGG pathway are listed. Balloon size represents the number of genes belonging to each term. (H) Comparison of expression levels of the representative nuclear lamina, nuclear pore complex (NPC; scaffold, core and peripheral) and other interested genes. The vertical axis represents the relative expression of normalized count data to Healthy-LMNs (Benjamini–Hochberg method). *P < 0.05, **P < 0.01 and ***P < 0.001. n.s. = no statistical significance.
Figure 6
Figure 6
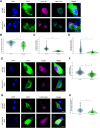
Disruption of the nuclear lamina, nucleoporins and nucleocytoplasmic transport in lower motor neurons differentiated from human induced pluripotent stem cell-derived lower motor neurons with FUS-H517D. (A) Immunofluorescence images of human induced pluripotent stem cell-derived lower motor neurons (hiPSC-LMNs) with anti-ChAT (green), Lamin B1 (magenta) and Lamin A/C (cyan) antibodies in Healthy-LMNs (201B7) and H517D hetero-1-LMNs on Day 14 of differentiation. Images are representative of n = 3 independent experiments. Scale bars = 10 μm. (B) Violin plot showing quantification of the nuclear lamina circularity (Lamin B1) in ChAT+ neurons (n = 3 for each, 90 cells Healthy, 73 cells H517D hetero). Graphs represent quartiles (boxes), 50th percentile (centreline) and 1.5 times the interquartile range (whiskers). Student’s t-test was used to calculate statistical significance. ***P < 0.001. (C and D) Violin plots showing quantification of the intensity of Lamin B1 and Lamin A/C in ChAT+ neurons (n = 3 for each, 90 cells Healthy, 73 cells H517D hetero). ***P < 0.001. (E) Immunofluorescence images of iPSC-MNs with anti-ChAT (green) and Nup62 (magenta) antibodies in Healthy- and H517D hetero-1-MNs on Day 14 of differentiation. Scale bars = 10 μm. (F) Quantification nucleus/cytoplasm (N/C) ratio of Nup62 intensity in ChAT+ neurons (n = 3 per each, 150 cells Healthy, 155 cells H517D hetero). ***P < 0.001. (G) Immunofluorescence images of iPSC-MNs with anti-ChAT (green) antibody and S-tdTomato (magenta) in Healthy- and H517D hetero-1-MNs on Day 14 of differentiation. Scale bars = 10 μm. (H) Quantification of nucleus/cytoplasm (N/C) ratio of S-tdTomato intensity in ChAT+ neurons (n = 3 per each, 31 cells Healthy, 32 cells H517D hetero). ***P < 0.001.
Figure 7
Figure 7
Disruption of the nuclear lamina and nucleoporins in sporadic amyotrophic lateral sclerosis and familial amyotrophic lateral sclerosis of human post-mortem spinal cord. (A) Immunohistochemistry of Lamin B1 in human post-mortem spinal cord. Images are representative of n = 6–8 staining experiments. Scale bar = 50 μm. (B) The ratio of Lamin B1 irregular immunohistochemistry patterns in control and amyotrophic lateral sclerosis (ALS) of human post-mortem spinal cord. Graphs represent quartiles (boxes), 50th percentile (centreline) and 1.5 times the interquartile range (whiskers). The Mann–Whitney U-test was used to calculate statistical significance. ***P < 0.001. (C) Immunohistochemistry of Nup62 in human post-mortem spinal cord. Images are representative of n = 6–8 staining experiments. Scale bar = 50 μm. (D) The ratio of Nup62 irregular immunohistochemistry patterns in control and ALS of human post-mortem spinal cord. Mann–Whitney U-test was used to calculate statistical significance. ***P < 0.001. FALS = familial amyotrophic lateral sclerosis; SALS = sporadic amyotrophic lateral sclerosis.

References

    1. Feldman EL, Goutman SA, Petri S, et al. Amyotrophic lateral sclerosis. Lancet. 2022;400:1363–1380. - PMC - PubMed
    1. Goutman SA, Hardiman O, Al-Chalabi A, et al. Emerging insights into the complex genetics and pathophysiology of amyotrophic lateral sclerosis. Lancet Neurol. 2022;21:465–479. - PMC - PubMed
    1. Mackenzie IR, Rademakers R, Neumann M. TDP-43 and FUS in amyotrophic lateral sclerosis and frontotemporal dementia. Lancet Neurol. 2010;9:995–1007. - PubMed
    1. Suzuki N, Nishiyama A, Warita H, Aoki M. Genetics of amyotrophic lateral sclerosis: Seeking therapeutic targets in the era of gene therapy. J Hum Genet. 2023;68:131–152. - PMC - PubMed
    1. Zou Z-Y, Liu M-S, Li X-G, Cui L-Y. Mutations in FUS are the most frequent genetic cause in juvenile sporadic ALS patients of Chinese origin. Amyotroph Lateral Scler Frontotemporal Degener. 2016;17(3–4):249–252. - PubMed

MeSH terms