. 2024 Sep 23;20(9):e1011411.
doi: 10.1371/journal.pgen.1011411. eCollection 2024 Sep.

NEMF mutations in mice illustrate how Importin-β specific nuclear transport defects recapitulate neurodegenerative disease hallmarks

Affiliations

NEMF mutations in mice illustrate how Importin-β specific nuclear transport defects recapitulate neurodegenerative disease hallmarks

Jonathan Plessis-Belair et al. PLoS Genet. .

Abstract

Pathological disruption of Nucleocytoplasmic Transport (NCT), such as the mis-localization of nuclear pore complex proteins (Nups), nuclear transport receptors, Ran-GTPase, and RanGAP1, are seen in both animal models and in familial and sporadic forms of amyotrophic lateral sclerosis (ALS), frontal temporal dementia and frontal temporal lobar degeneration (FTD\FTLD), and Alzheimer's and Alzheimer's Related Dementias (AD/ADRD). However, the question of whether these alterations represent a primary cause, or a downstream consequence of disease is unclear, and what upstream factors may account for these defects are unknown. Here, we report four key findings that shed light on the upstream causal role of Importin-β-specific nuclear transport defects in disease onset. First, taking advantage of two novel mouse models of NEMF neurodegeneration (NemfR86S and NemfR487G) that recapitulate many cellular and biochemical aspects of neurodegenerative diseases, we find an Importin-β-specific nuclear import block. Second, we observe cytoplasmic mis-localization and aggregation of multiple proteins implicated in the pathogenesis of ALS/FTD and AD/ADRD, including TDP43, Importin-β, RanGap1, and Ran. These findings are further supported by a pathological interaction between Importin-β and the mutant NEMFR86S protein in cytoplasmic accumulations. Third, we identify similar transcriptional dysregulation in key genes associated with neurodegenerative disease. Lastly, we show that even transient pharmaceutical inhibition of Importin-β in both mouse and human neuronal and non-neuronal cells induces key proteinopathies and transcriptional alterations seen in our mouse models and in neurodegeneration. Our convergent results between mouse and human neuronal and non-neuronal cellular biology provide mechanistic evidence that many of the mis-localized proteins and dysregulated transcriptional events seen in multiple neurodegenerative diseases may in fact arise primarily from a primary upstream defect in Importin- β nuclear import. These findings have critical implications for investigating how sporadic forms of neurodegeneration may arise from presently unidentified genetic and environmental perturbations in Importin-β function.


Conflict of interest statement

The authors have declared that no competing interests exist.

Figures
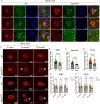
Fig 1
Fig 1. Motor Neuron Degeneration is associated with Progressive Nuclear loss of mutant NEMF in Lumbar Spinal Cord.
A) Lumbar spinal cords were isolated from 21-day old Wild Type and NemfR86S mice. Motor neurons in the ventral horn were immunostained for the nucleus (DAPI, blue), a motor neuron marker (ChAT, green) and NEMF (top row red), Importin-β (middle row red), or TDP-43 (bottom row red). B-D) Nuclear/Cytoplasmic ratios of proteins in A. Data analyzed by unpaired two-tailed t-test. (E-F) Immunostaining of NEMF and TDP-43 (red) in WT, and NemfR487G lumbar spinal cord motor neurons at 21 days, 6 months and 12 months. G-H) Nuclear/Cytoplasmic ratios of protein of interests in WT and NemfR487G. Data analyzed by two-way ANOVA with Šídák’s multiple comparisons test. Individual colors in plots represents one animal. Arrow indicates cytoplasmic puncta. Scale bars are 10μm. (n = 30–44 cells) (ns p>0.05, **** p<0.0001).
Fig 2
Fig 2. NemfR86S exhibits specific Importin-β nuclear import defects.
A) Expression of turbo GFP and turbo GFP in-frame with three Canonical SV-40 Nuclear Localization Signal (3X-NLS) (green) in WT and NemfR86S MEFs, and in LTN1 and NEMF siRNA treated WT MEFs. Nuclear stain is DAPI (blue). B) Nuclear/Cytoplasmic Ratios of GFP and GFP-3X-NLS in WT and NemfR86S MEFs. Data Analyzed by one-way ANOVA with Tukey’s multiple comparisons test (n = 28–32 cells) C) Expression of mCherry in frame with a Proline-Tyrosine Transportin-1 Nuclear Localization Signal (PY-NLS) and mCherry in frame with a PY-NLS and a pKI Exportin-1 Nuclear Export Signal (PY-NLS-PKI-NES) (red) in WT and NemfR86S MEFs. Nuclear stain is DAPI (blue). D) Nuclear/Cytoplasmic Ratios of PY-NLS and PY-NLS-PKI-NES in WT and NemfR86S MEFs. Data analyzed by two-way ANOVA with Šídák’s multiple comparisons test. (n = 40–46) Individual colors in plots represent one trial. Scale bars are 10μm. (ns p>0.05, ** p<0.0001, **** p<0.0001).
Fig 3
Fig 3
RQC nonstop and poly (A) stalling reporters fail to localize to the nucleus in NemfR86S MEFs A) Expression of GFP-Stop, GFP-Nonstop, and GFP-PolyK-(AAA)10 (green) co-stained with Importin-β (red) in WT and NemfR86S MEFs. Nuclear stain is DAPI (blue). B) Nuclear/Cytoplasmic Ratios of GFP-Stop, GFP-Nonstop, and GFP-PolyK-(AAA)10 in WT and NemfR86S MEFs. Data Analyzed by two-way ANOVA with Šídák’s multiple comparisons test. Scale bars are 10μm. (n = 39–46). C) Western Blot Analysis of GFP-Stop, GFP-Nonstop, and GFP-PolyK-(AAA)10 expression in WT and NemfR86S MEFs. D) Schematic of Puromycin (Puro) inclusion into translated nascent chains polypeptides (NCPs) resulting in the inhibition of NEMF and the release of the nascent chain into the cytoplasm. The NCPs are transiently imported into the nucleus and accumulate into nucleoli. E) Immunostaining of puromycylated NCPs (OP-Puro, green) and Lamin A/C as a nuclear marker (red) in WT, NemfR86S MEFs, and IPZ-treated WT MEFs. F) Nuclear/Cytoplasmic Ratios of puromycylated NCPs in WT, NemfR86S MEFs, and IPZ-treated WT MEFs. Data analyzed by ordinary one-way ANOVA with Tukey’s multiple comparison test. Individual colors in plots represent one trial. Scale bars are 5μm. (n = 35–43 cells) (ns p>0.05, *** p<0.001, **** p<0.0001).
Fig 4
Fig 4. In Situ Proximity Ligation Assay (PLA) reveals cytoplasmic NEMF R86S interaction with Importin-β.
A) Immunofluorescent staining of NEMF (green) and Importin-β (red) in WT and NemfR86S MEFs. Nuclear stain is DAPI (blue). Scale bars are 5μm. B-D) Quantification of Importin-β granules, area of granules (square microns), percent of NEMF positive Importin-β granules (n = 3). E) Schematic of PLA adapted from Hegazy et al., 2020 [49]. F) PLA of NEMF and Importin-B (red). Nuclear stain is DAPI (blue). Scale bars are 20um. G-H) Quantification of Mean PLA frequency and PLA Intensity (n = 3). All data was analyzed by unpaired two-tailed t-test. (ns p>0.05, **p<0.01, *p<0.05, ****p<0.0001).
Fig 5
Fig 5. NemfR86S MEFs display cytoplasmic aggregates.
A) Immunofluorescent Staining of NEMF, Ran, TDP-43, and RanGAP1 with Importin-β in WT and NemfR86S MEFs. Nuclei Labeled with DAPI (blue). Scale bars are 20μm. B) Immunofluorescent Staining of pTDP-43 in WT and NemfR86S MEFs. Scale bars are 10μm. C) Percentage of cells with pTDP-43 cytoplasmic inclusions in WT and NemfR86S MEFs (n = 3). D) Western Blot Analysis of sarkosyl soluble and insoluble TDP-43 in WT and NemfR86S MEFs E) Ratio of Soluble versus Insoluble TDP-43 protein levels (n = 3). J) Immunofluorescent staining of phospho-TDP-43 (red), ChAT (green) in WT, and NemfR86S lumbar spinal cord motor neurons at 21 days. Nuclei Labeled with DAPI (blue). Scale bars are 20μm. G) Percentage of ChAT+ cells with pTDP-43 cytoplasmic inclusions in WT and NemfR86S mice (n = 3). Individual colors in plots represent one trial. Arrow indicates cytoplasmic puncta. (*p<0.05, ***p<0.001,****p<0.0001).
Fig 6
Fig 6. NemfR86S mice display altered expression of neurodegenerative disease related genes.
A) Volcano plot of upregulated (red) and downregulated (blue) genes of bulk RNA-seq in NemfR86S MEFs relative to WT MEFs. (Log2foldchange threshold <-1, >1, p<0.05). B) Heatmap of significantly dysregulated genes commonly observed in neurodegeneration. (C-F) qPCR relative fold change of Stmn2, Apoe, Chmp2b, and Fig 4 in MEFs, spinal cord, brain in WT and NemfR86S mice. Data analyzed by two-way ANOVA with Šídák’s multiple comparisons test. (n = 3). G) Western Blot Analysis of STMN2 protein levels in MEFs, Spinal Cord, and Brain. J-L) Quantification of STMN2 protein levels normalized to GAPDH levels. Data analyzed by unpaired two-tailed t-test. (n = 3) (ns p>0.05, *p<0.05, **, p<0.01, *** p<0.001, **** p<0.0001).
Fig 7
Fig 7. A transient nuclear import block recapitulates transcriptional downregulation of Stmn2.
A) Immunofluorescent staining of TDP-43 and pTDP-43 (green) in WT and Importazole-treated (IPZ) MEFs. Nuclei Labeled with DAPI (blue). Scale bars are 10μm. B) Quantification of Nuclear/Cytoplasmic Ratio of TDP-43 (n = 92–99). Data analyzed by unpaired two-tailed t-test. C-D) qPCR relative fold change in DMSO Control and IPZ and Ivermectin (IVM) treated MEFs for indicated genes (n = 3). E) Volcano plot of upregulated (red) and downregulated (blue) genes of bulk RNA-seq in IPZ-treated WT MEFs relative to WT MEFs. (Log2foldchange threshold <-1, >1, p<0.05). F) Stmn2 transcripts per million values for WT, NemfR86S, and IPZ-treated MEFs. G) Heatmap of significant commonly dysregulated genes in WT, NemfR86S, and IPZ-treated MEFs. (n = 3) H-I) qPCR relative fold change of Stmn2 or Apoe in WT or NemfR86S MEFs treated with Ltn1 or Nemf siRNAs (n = 3). Data analyzed by one-way ANOVA with Tukey’s multiple comparison test. J) Exogenous expression of Importin-β-GFP (green) co-stained with TDP-43 (red) in WT and NemfR86S MEFs. Nuclei Labeled with DAPI (blue). Asterisks indicate GFP-positive cells. K) Percentage of cells with pTDP-43 cytoplasmic inclusions in WT and NemfR86S MEFs. Data Analyzed by two-way ANOVA with Šídák’s multiple comparisons test (n = 3) L-M) qPCR relative fold change of Stmn2 or Apoe in WT or NemfR86S MEFs with or without overexpression of Importin-β (Importin-β OE). Data Analyzed by two-way ANOVA with Šídák’s multiple comparisons test (n = 3). Arrows indicate cytoplasmic inclusions. Individual colors in plots represent one trial. (ns p>0.05, *p<0.05, **, p<0.01, *** p<0.001, **** p<0.0001).

References

    1. Kim HJ, Taylor JP. Lost in Transportation: Nucleocytoplasmic Transport Defects in ALS and Other Neurodegenerative Diseases. Neuron. 2017;96(2):285–97. doi: 10.1016/j.neuron.2017.07.029 ; PubMed Central PMCID: PMC5678982. - DOI - PMC - PubMed
    1. Prpar Mihevc S, Darovic S, Kovanda A, Bajc Česnik A, Župunski V, Rogelj B. Nuclear trafficking in amyotrophic lateral sclerosis and frontotemporal lobar degeneration. Brain. 2016;140(1):13–26. doi: 10.1093/brain/aww197 - DOI - PubMed
    1. Boeynaems S, Bogaert E, Van Damme P, Van Den Bosch L. Inside out: the role of nucleocytoplasmic transport in ALS and FTLD. Acta Neuropathol. 2016;132(2):159–73. Epub 20160606. doi: 10.1007/s00401-016-1586-5 ; PubMed Central PMCID: PMC4947127. - DOI - PMC - PubMed
    1. Nigg EA. Nucleocytoplasmic transport: signals, mechanisms and regulation. Nature. 1997;386(6627):779–87. doi: 10.1038/386779a0 - DOI - PubMed
    1. Frey S, Richter RP, Görlich D. FG-rich repeats of nuclear pore proteins form a three-dimensional meshwork with hydrogel-like properties. Science. 2006;314(5800):815–7. doi: 10.1126/science.1132516 . - DOI - PubMed

MeSH terms

LinkOut - more resources