. 2024 Oct;121(40):e2405117121.
doi: 10.1073/pnas.2405117121. Epub 2024 Sep 23.

Septo-dentate gyrus cholinergic circuits modulate function and morphogenesis of adult neural stem cells through granule cell intermediaries

Affiliations

Septo-dentate gyrus cholinergic circuits modulate function and morphogenesis of adult neural stem cells through granule cell intermediaries

Ze-Ka Chen et al. Proc Natl Acad Sci U S A. 2024 Oct.

Abstract

Cholinergic neurons in the basal forebrain play a crucial role in regulating adult hippocampal neurogenesis (AHN). However, the circuit and molecular mechanisms underlying cholinergic modulation of AHN, especially the initial stages of this process related to the generation of newborn progeny from quiescent radial neural stem cells (rNSCs), remain unclear. Here, we report that stimulation of the cholinergic circuits projected from the diagonal band of Broca (DB) to the dentate gyrus (DG) neurogenic niche promotes proliferation and morphological development of rNSCs, resulting in increased neural stem/progenitor pool and rNSCs with longer radial processes and larger busy heads. Interestingly, DG granule cells (GCs) are required for DB-DG cholinergic circuit-dependent modulation of proliferation and morphogenesis of rNSCs. Furthermore, single-nucleus RNA sequencing of DG reveals cell type-specific transcriptional changes in response to cholinergic circuit stimulation, with GCs (among all the DG niche cells) exhibiting the most extensive transcriptional changes. Our findings shed light on how the DB-DG cholinergic circuits orchestrate the key niche components to support neurogenic function and morphogenesis of rNSCs at the circuit and molecular levels.

Keywords: adult neural stem cells; cholinergic circuit; dentate gyrus; diagonal band of Broca; granule cells.


Conflict of interest statement

Competing interests statement:The authors declare no competing interest.

Figures

Fig. 1.
Fig. 1.
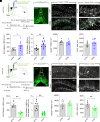
DB and MS cholinergic neurons exhibit distinct projection patterns to the DG. (A) AAVs targeting scheme using dual fluorophores (eYFP:DB, mCherry:MS). (B) AAV injection to the MS/DB. (Scale bar, 200 µm.) (C) Colocalization of ChAT+ cells with reporter fluorophores in the MS and DB. (Scale bar, 50 µm.) (D) ChAT+ cells in DB and MS. Each dot represents averaged number of ChAT+ cells from three sections per animal (n = 3 animals). P = 0.0097 by Student’s t test. (E) AAV-labeled cells in DB and MS. Each dot represents averaged number of ChAT+ cells from three sections per animal (n = 3 animals). P = 0.0002 by Student’s t test. (F) Percent AAV-labeled cells per ChAT+ cells in DB and MS (n = 3 animals). (G) Venn diagram of AAV-labeled DB cells (Green) and MS cells (Red). Yellow represents overlapped expression. Brackets represent the proportion of each component to the total. (H) Hippocampal ROIs drawn around respective subregions, for analysis of (I) (Scale bar, 100 µm.) (I) Projection densities (normalized to the region volume). MS-DG or DB-DG cholinergic projections were normalized to the number of MS mCherry+ or DB eYFP+ cholinergic neurons. P = 0.0072, q = 0.0366, by multiple t tests with Bonferroni correction. Data were presented as mean ± SEM.
Fig. 2.
Fig. 2.
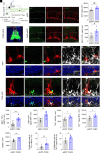
DB-DG cholinergic circuits bidirectionally regulate rNSC proliferation. (A) Experimental paradigm. (B) DB targeting by AAVs expressing ChR2. (Scale bar, 100 µm.); Bottom. (C) rNSC proliferation with Nestin and EdU. (Scale bar, 100 µm.) (D) Zoomed images of proliferating rNSCs with colocalization of Nestin and EdU (arrowheads.) (Scale bar, 20 µm.) (E) Density of proliferating rNSCs. n = 8 animals for eYFP and 9 animals for ChR2. P = 0.0155, Student’s t test. (F) Percent of proliferating rNSCs. n = 8 animals for eYFP and 9 animals for ChR2. P =0.0037, Student’s t test. (G) Density of rNSCs. n = 8 animals for eYFP and 9 animals for ChR2. P = 0.05012, Student’s t test. (H) Density of overall proliferating progeny. n = 8 animals for eYFP and 9 animals for ChR2. P = 0.1765, Student’s t test. (I) Experimental paradigm. (J) DB targeting by AAVs expressing Arch3.0. (Scale bar, top,100 µm.) (K) rNSC proliferation with Nestin and EdU. (Scale bar, 100 µm.) (L) Zoomed images of proliferating rNSCs with colocalization of Nestin and EdU (arrowheads). (Scale bar, 20 µm.) (M) Density of proliferating rNSCs. n = 7 animals for eYFP and 8 animals for Arch. P = 7.1 × 10⁻⁶, Student’s t test. (N) Percent of proliferating rNSCs. n = 7 animals for eYFP and 8 animals for Arch. P = 0.0003, Student’s t test. (O) Density of rNSCs. n = 7 animals for eYFP and 8 animals for Arch. P = 0.5364, Student’s t test. (P) Density of overall proliferating progeny. n = 7 animals for eYFP and 8 animals for Arch. P = 0.0028, Student’s t test. Data were presented as mean ± SEM.
Fig. 3.
Fig. 3.
Stimulation of DB-DG cholinergic circuits during early neurogenesis stages leads to increased neural stem/progenitor cells. (A) Experimental paradigm. (B) AAV-ChAT-ChR2-eGFP expression in DB neurons. (Scale bar, 200 μm.) (C) tdTomato+ cells (Red), Ki67+ cells (Green) after optogenetic stimulation of DB-DG cholinergic projections. (Scale bar, 100 μm.) (D) Density of tdTomato+ cells. P = 0.0078, Student’s t test. (E) Density of tdTomato+/Ki67+ cells. P = 0.019, Student’s t test. (F) Proliferative/nonproliferative rNSCs and nonradial type 2 NPs in eGFP and ChR2-eGFP groups. rNSCs were identified as tdTomato+ cells containing a GFAP+ radial process. Activated rNSCs coexpress Ki67 (Yellow arrowheads). Type 2 NPs were counted as tdTomato+Sox2+ cells without a GFAP+ radial process. Activated NPs were determined by coexpression of Ki67 (blue arrowheads). (Scale bar, 20 μm.) (G) Density of activated rNSCs. n = 6 animals for eGFP and 6 animals for ChR2. P = 0.0016, Student’s t test. (H) Density of proliferating type 2 NPs. n = 6 animals for eGFP and 6 animals for ChR2. P = 0.0035 by Student’s t test. (I) Density of total rNSCs. n = 6 animals for eGFP and 6 animals for ChR2. P = 0.0285, Student’s t test. (J) Density of total type 2 NPs. n = 6 animals for eGFP and 6 animals for ChR2. P = 0.0297, Student’s t test. (K) Density of total rNSCs. n = 6 animals for eGFP and 6 animals for ChR2. P = 0.0036, Student’s t test. (L) Proliferating rate of rNSCs, quantified as Ki67+Tdt+ rNSCs/total Tdt+ rNSCs. n = 6 animals for eGFP and 6 animals for ChR2. P = 0.009, Student’s t test. (M) Proliferating rate of type 2 NPs, quantified as Ki67+Tdt+ Sox2+ NPs/total Tdt+ Sox2+ NPs. n = 6 animals for eGFP and 6 animals for ChR2. P = 0.048, Student’s t test. Data were presented as mean ± SEM.
Fig. 4.
Fig. 4.
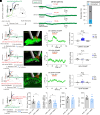
DG GCs are required for cholinergic circuit activity-dependent regulation of rNSC proliferation. (A) Electrophysiological recording scheme from a Nestin-GFP-positive cells. (B) Light evoked inward current in GFP+ rNSCs upon optogenetic stimulation (10 Hz, 2 s) of DB-DG cholinergic projections. (C) Light-evoked inward current in GFP+ rNSCs in the presence of atropine (10 µM). (D) Light-evoked inward current in GFP+ rNSCs in the presence of atropine (10 µM), APV (100 µM), and NBQX (20 µM). (E) Proportion of Nestin-GFP cells functionally connected to DB Cholinergic afferents. (F, G, and H) Experimental paradigm for optogenetic stimulation of DB-DG cholinergic projections and simultaneous photometry recording of GCs (F), interneurons (G), or astrocytes (H). (I, J, and K) Expression of AAV-CaMKII-GCaMP6f (I), AAV-mDlx-GCaMP6f (J), AAV-GFAP-GCaMP8s (K) along with optic fiber implantation in the DG. (Scale bar, 100 μm.) (L, M, and N) Population calcium activity of DG GCs (L), interneurons (M), or astrocytes (N) in response to optogenetic stimulation of DB-DG cholinergic projections. (L) n = 31 episodes from 6 animals; (M) n = 43 episodes from 8 animals; (N) n = 22 episodes from 6 animals. (O, P, and Q) Average fluorescence of DG cells before, during, and after optostimulation of DB-DG cholinergic projections. (O) GCs, n = 6 animals, one-way ANOVA between each state, F2,15 = 10.81, P < 0.001, followed by Dunnett’s multiple comparisons test; (P) interneurons, n = 8 animals, F2,21 = 3.37, P = 0.0537; (Q) astrocytes, n = 6 animals, F2,15 = 1.18, P =0.3346. (R) Experimental paradigm. (S) Density of proliferating rNSCs. n = 7 animals for mCherry and 9 animals for hM4Di. P = 0.0489 by Student’s t test. (T) Percent of proliferating rNSCs. n = 7 animals for mCherry and 9 animals for hM4Di. P = 0.0386 by Student’s t test. (U) Density of rNSCs. n = 7 animals for mCherry and 9 animals for hM4Di. (V) Density of overall proliferating progeny. n = 7 animals for mCherry and 9 animals for hM4Di. Data were presented as mean ± SEM.
Fig. 5.
Fig. 5.
Dentate GCs are required for cholinergic circuit activity-dependent regulation of rNSC morphogenesis. (A) Experimental paradigm. (B) rNSC bushy heads from a ChAT-Cre::Nestin-GFP animal after optogenetic activation of DB-DG cholinergic terminals. (Left Scale bar, 20 µm, Right Scale bar, 2 µm.) (C) Mean length of rNSCs. mCherry: n = 80 cells from 3 animals; ChR2-mCherry, n = 80 cells from 3 animals, P = 0.0074. (D) Volume of rNSC bushy heads. mCherry: n = 9 slices from 3 animals; ChR2-mCherry, 9 slices from 3 animals, P = 0.0003. (E) Experimental paradigm. (F) rNSC bushy heads from a ChAT-Cre::Nestin-GFP animal after simultaneous chemogenetic inhibition of DG GCs and optogenetic activation of DB-DG cholinergic terminals. (Left Scale bar, 20 µm, Right Scale bar, 2 µm.) (G) Mean length of rNSCs. mCherry: n = 80 cells from 3 animals; ChR2-mCherry, n = 80 cells from 4 animals, P < 0.0001. (H) Volume of rNSC bushy heads. mCherry: n = 9 slices from 3 animals; hM4Di: n = 12 slices from 4 animals, P = 0.0010. Data were presented as mean ± SEM.
Fig. 6.
Fig. 6.
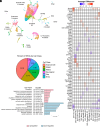
DG GCs exhibit the most transcriptional changes in response to cholinergic circuit stimulation. (A) UMAP dimension reduction analysis of 42 DG clusters identified from snRNA-seq. (B) Percentage of DEGs by cell class. (C) Heatmap of the most significant DEGs in each direction (Wilcoxon rank-sum test P < 0.01, log10-fold change > 0.1). (D) Most significant GO terms from the top two most responsive neuronal clusters. Up-regulated (pink) and down-regulated (light blue) with −log10(FDR) > 1.5.
Fig. 7.
Fig. 7.
Cholinergic circuit stimulation induces transcriptomic changes in rNSCs related to activity, proliferation, and morphogenesis. (A) Slingshot pseudotime analysis of clusters from the neurogenic cell class and the most proximal GC cluster. (B) Marker gene expression in neurogenic cell class clusters, from refs. , , and . (C) Differentially up-regulated genes in the combined, both eYFP (control) and ChR2 (treatment) rNSC cluster (red) and NP/NB cluster (blue). (D) Ten most significant up-regulated and down-regulated DEGs in the rNSC cluster.

References

    1. Hasselmo M. E., The role of acetylcholine in learning and memory. Curr. Opin. Neurobiol. 16, 710–715 (2006). - PMC - PubMed
    1. Winkler J., Suhr S. T., Gage F. H., Thal L. J., Fisher L. J., Essential role of neocortical acetylcholine in spatial memory. Nature 375, 484–487 (1995). - PubMed
    1. Green A., et al. , Muscarinic and nicotinic receptor modulation of object and spatial n-back working memory in humans. Pharmacol. Biochem. Behav. 81, 575–584 (2005). - PubMed
    1. Buccafusco J. J., Letchworth S. R., Bencherif M., Lippiello P. M., Long-lasting cognitive improvement with nicotinic receptor agonists: Mechanisms of pharmacokinetic-pharmacodynamic discordance. Trends Pharmacol. Sci. 26, 352–360 (2005). - PubMed
    1. Christian K. M., Song H., Ming G. L., Functions and dysfunctions of adult hippocampal neurogenesis. Annu. Rev. Neurosci. 37, 243–262 (2014). - PMC - PubMed