. 2024 Nov 1;134(21):e175147.
doi: 10.1172/JCI175147.

Egfl6 promotes ovarian cancer progression by enhancing the immunosuppressive functions of tumor-associated myeloid cells

Affiliations

Egfl6 promotes ovarian cancer progression by enhancing the immunosuppressive functions of tumor-associated myeloid cells

Sarah Hamze Sinno et al. J Clin Invest. .

Abstract

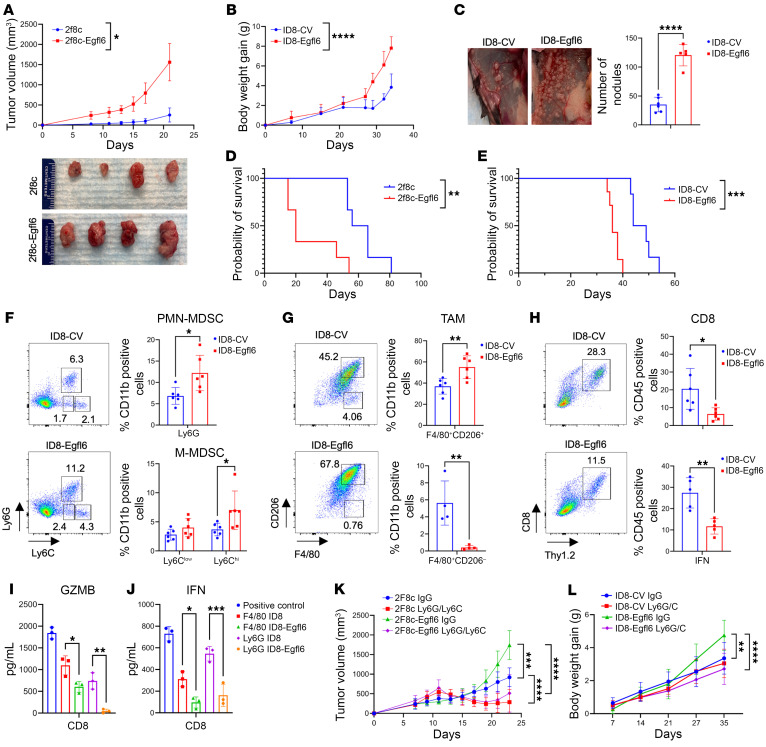
Tumor-associated macrophages (TAMs) and myeloid-derived suppressor cells (MDSCs) play a critical role in resistance to immunotherapy. In this study, we identified epidermal growth factor-like 6 (Egfl6) as a regulator of myeloid cell functions. Our analyses indicated that Egfl6, via binding with β3 integrins and activation of p38 and SYK signaling, acts as a chemotactic factor for myeloid cell migration and promotes their differentiation toward an immunosuppressive state. In syngeneic mouse models of ovarian cancer (OvCa), tumor expression of Egfl6 increased the intratumoral accumulation of polymorphonuclear (PMN) MDSCs and TAMs and their expression of immunosuppressive factors, including CXCL2, IL-10, and PD-L1. Consistent with this, in an immune 'hot' tumor model, Egfl6 expression eliminated response to anti-PD-L1 therapy, while Egfl6 neutralizing antibody decreased the accumulation of tumor-infiltrating CD206+ TAMs and PMN-MDSCs and restored the efficacy of anti-PD-L1 therapy. Supporting a role in human tumors, in human OvCa tissue samples, areas of high EGFL6 expression colocalized with myeloid cell infiltration. scRNA-Seq analyses revealed a correlation between EGFL6 and immune cell expression of immunosuppressive factors. Our data provide mechanistic insights into the oncoimmunologic functions of EGFL6 in mediating tumor immune suppression and identified EGFL6 as a potential therapeutic target to enhance immunotherapy in patients with OvCa.

Keywords: Cancer immunotherapy; Immunology; Macrophages; Obstetrics/gynecology; Oncology.


Figures

Figure 1
Figure 1. Egfl6 mice display an increased number of BM and splenic myeloid cells.
(A and B) Graphs represent the percentage of B, CD4+, CD8+, and CD11b+ cells in BM (A) and spleen (B) of WT and Egfl6 mice. (C) Gating and quantification of Ly6G and Ly6C subsets of CD11b+ BM and splenic cells from healthy C57BL/6J (WT) and Egfl6 mice. (D) Volcano plot showing differentially expressed genes (DEGs) between BM CD11b+ cells of Egfl6 mice versus C57BL/6J (WT). P values determined via t test are plotted on the y axis. DEGs are colored in red. (E) Gating and quantification of BM-derived CD11b+Ly6G+Ly6C cells stimulated with rGM-CSF ± rEgfl6. (F) qPCR analyses of indicated genes in sorted BM CD11b+ cells stimulated with rGM-CSF + rEgfl6. Stimulation with rGM-CSF alone was used as control. (G and H) ELISA of Granzyme B (GZMB) in IL-2 + CD3/CD28 activated CD8+ T cells and cultured directly with rEgfl6-stimulated BM-derived MDSC cells or MDSC control at different ratio (G) or with the conditioned media (CM) of rEgfl6-stimulated BM-derived MDSC cells or MDSC control (H). Unstimulated CD8+ T cells were used as negative control. Results were analyzed using unpaired 2-tailed t test or 2-way ANOVA. Experiments were performed in triplicate. Data are presented as mean ± SEM. *P < 0.05, **P < 0.01, ***P < 0.001, ****P < 0.0001.
Figure 2
Figure 2. Egfl6 accelerates tumor growth and modulates the immune TME.
(A) Tumor volume changes (mm3) and images of 2F8c and 2F8c-Egfl6 subcutaneous tumors resected and measured 3 weeks after tumor cell inoculation (n = 6 mice per group). (B) Time-dependent body weight gain in mice i.p. injected with ID8-CV and ID8-Egfl6 tumors (n = 8 mice per group). (C) Evaluation of peritoneal metastases of ID8-CV and ID8-Egfl6 that had a weight increase of over 35% of their original weight on the day of tumor cell injections (n = 6 mice per group). (D and E) Kaplan-Meier overall survival analysis for 2F8c+/–Egfl6 (D) and ID8+/–Egfl6 (E). Survival statistics were calculated using log-rank analysis from Kaplan-Meier survival plots. (F and G) Flow cytometric evaluation and summary of PMN-MDSC (CD11b+Ly6G+Ly6C) (F, top panel), M-MDSC (CD11b+Ly6GLy6C+) (F, bottom panel), and TAM (CD11b+F4/80+CD206+) (G) in ID8+/–Egfl6 tumors. (H) Flow cytometric evaluation and quantification of CD8 T (CD45+Thy1.2+) cells and their expression of IFN-γ in ID8+/–Egfl6 tumors. (I and J) ELISA of Granzyme B (GZMB) (I) and IFN (J) in IL-2 + CD3/CD28 activated CD8 T cells (Pos Control) and cultured directly with F4/80+ or Ly6G+ cells isolated from ID8 and ID8-Egfl6 ascites at ratio of 1:1. (K and L) Time-dependent volume changes (mm3) of 2F8c and 2F8c-Egfl6 tumor cells (K) or body-weight gain in mice i.p. injected with ID8 and ID8-Egfl6 tumor cells (L) and treated with anti-Ly6G/Ly6C Ab or IgG isotype control (n = 6 mice per group). P values were calculated using unpaired 2-tailed t test, 1-way, or 2-way ANOVA with Tukey’s post test for multiple comparisons. Experiments were performed in triplicate. Data are presented as mean ± SEM. *P < 0.05, **P < 0.01, and ***P < 0.001, ****P < 0.0001.
Figure 3
Figure 3. IL-10 and Cxcl2 mediate Egfl6 antitumor immunosuppression.
(A) Volcano plot showing differentially expressed genes (DEGs) between CD11b+ cells infiltrating 2F8c-Egfl6 versus 2F8c tumors. Negative Log10 P values determined via t test are plotted on the y axis. (B) IPA protein analysis of Egfl6 treatment associated DEG pathways identified as significantly (P < 0.05) upregulated (left panel) or downregulated (right panel). (C and D) Summary of PD-L1 expression determined by flow cytometry in infiltrating TAMs (C) and by qPCR in BM-derived macrophages polarized with different stimuli as indicated D. (E) Western blotting analysis of IL-10 and Cxcl2 in TAMs and PMN-MDSCs isolated from ID8+/–Egfl6 ascites. Actin was used as loading control. (F) ELISA of IFN-γ in CD8+ T cells cultured with the Ly6G+ cells isolated from ID8+/–Egfl6 ascites in the absence/presence of IL-10 or Cxcl2 NAbs. (G) Western blotting showing the indicated protein expression in BM-isolated CD11b+ cells treated with GM-CSF and rEgfl6 for 0, 7.5, and 15 minutes. β-Actin was used as loading control. Results are representative of at least 3 independent experiments. (H and I) ELISA showing IL-10 and Cxcl2 protein secretion in GM-CSF-treated BM CD11b+ cells +/– rEgfl6 and/or Syk inhibitor (R406) (H), and GM-CSF-treated BM CD11b+ cells +/– rEgfl6 and/or the integrin inhibitor Cyclo-RGD (c-RGD) (I). (J) Graph represents a ChIP assay performed with anti-Jun Ab followed by qPCR to measure IL-10 promoter in ID8+/–Egfl6 ascites. Data are presented as mean ± SEM. P values were calculated using unpaired 2-tailed t test or 1-way ANOVA with Tukey’s post test for multiple comparisons. *P < 0.05, **P < 0.01, ***P < 0.001, and ****P < 0.0001. All results are representative of 3 independent experiments.
Figure 4
Figure 4. Tumor expression of Egfl6 induces resistance to anti-PD-L1 immunotherapy.
(A) 2F8c and 2F8c-Egfl6 tumor growth in mice treated with anti-PD-L1 Ab or IgG isotype control Ab (n = 8 mice per group). *P < 0.05, 2F8c + IgG versus 2F8c-Egfl6 + IgG; ***P < 0.001, 2F8c + anti-PD-L1 versus 2F8c + IgG. (B) Kaplan-Meier survival analysis for the indicated treatment groups. ***P < 0.001, 2F8c + anti-PD-L1 versus 2F8c + IgG. Survival statistics were calculated using log-rank (Mantel-Cox) analysis from Kaplan-Meier survival plots. (C) Flow cytometry quantification of intratumoral PMN-MDSCs (CD11b+Ly6G+Ly6C), M-MDSCs (CD11b+Ly6GLy6C+), CD206+ TAMs, and CD8+ T cells in the indicated tumors. (DF) qPCR analysis of mRNA expression of S100A9, IL-10, and Cxcl2 gene expression in (D) 2F8c-Egfl6 versus 2F8c, (E) anti-PD-L1–treated 2F8c versus IgG-treated 2F8c, (F) anti-PD-L1–treated 2F8c-Egfl6 versus IgG-treated 2F8c-Egfl6 tumor samples. (G) Representative images of IHC staining showing Cxcl2-expressing cells in control and a-PD-L1–treated tumor tissue sections. Graph represents the number of Cxcl2+ cells in the indicated tumors. Scale bars: 20 μm. Error bars show SEM. Experiments were performed in triplicate. Statistical significance was determined by unpaired 2-tailed t test, 1-way, or 2-way ANOVA with Tukey’s multiple comparisons test. *P < 0.05, **P < 0.01, ***P < 0.001, ****P < 0.001.
Figure 5
Figure 5. Combined treatment of a-Egfl6 and anti-PD-L1-induced high antitumor immune response.
(A) Volume changes (mm3) and representative images of 2F8c-Egfl6 subcutaneous tumors treated with IgG isotype Ab (Control), a-PD-L1 Ab, and a-Egfl6 Ab, alone or in combination, were resected and measured 2 days after the last treatment (n = 8 mice per group). **P < 0.01, IgG Ab versus a-Egfl6 Ab; ***P < 0.001, anti-PD-L1 Ab versus a-Egfl6 Ab and IgG Ab versus anti-PD-L1+ a-Egfl6 Abs. (B and C) Kaplan-Meier overall survival analysis for 2F8c-Egfl6 (B) and ID8p53–/– Brca2–/—-Egfl6 (C) mice receiving the indicated treatment. Survival statistics were calculated using the Log-rank (Mantel-Cox) test analysis. (DG) Flow cytometric gating and quantification of CD206+ TAMs (D), PMN-MDSC (CD11b+Ly6G+Ly6C) (E), MHCII+ TAMs (F), and CD8+ T (CD45+Thy1.2+) (G) cells in 2F8c-Egfl6 and ID8p53–/– Brca2–/—-Egfl6 tumors. Error bars show SEM. Experiments were performed in triplicate. Statistical significance was determined by unpaired 2-tailed t test or 2-way ANOVA with Tukey’s multiple comparisons test. *P < 0.05, **P < 0.01, ***P < 0.001, ****P < 0.001.
Figure 6
Figure 6. Combined treatment of a-Egfl6- and anti-PD-L1 reduced IL-10 and Cxcl2 expression.
(A) qPCR analyses of IL-10 and Cxcl2 in the indicated treated Egfl6+ 2F8c tumors. (B) IF images and quantification of IL-10 expression in the indicated treated Egfl6+ 2F8c tumors. P values were calculated using unpaired 2-tailed t test. Data are presented as mean ± SEM. *P < 0.05, **P < 0.01, and ***P < 0.001 , ****P < 0.0001. All results are representative of 3 independent experiments. Scale bar: 30 μm.
Figure 7
Figure 7. EGFL6 induces an immunosuppressive phenotype of human myeloid cells.
(A and B) Gating and quantification of human CD11b+CD66b+ (A) and CD11b+CD163+CD64+ (B) cells in CD33+ cells isolated from ascites of patients with HGSOC and stimulated with rEGFL6 +/– c-RGD. (C) Cytokine array and densitometry of the CM of CD33+ ascites from patients with HGSOC stimulated with GM-CSF +/– rEGFL6. Spot intensities were calculated using ImageJ software. (D) Representative immunofluorescence images showing EGFL6 expression (red) and CD68 cell (green) localization in HGSOC tumor tissue sections (n = 6 per group). DAPI stained nuclei. Graph represents the number of CD68-positive cells in tissues expressing high or low levels of EGFL6. Scale bar: 100 μm. (E) Spatial feature plots of EGFL6 and CD163 markers and spatial autocorrelation of selected genes. Moran’s I test, implemented in the Seurat FindSpatiallyVariableFeatures function, was applied to compute spatial autocorrelation of the expression of each gene. Data are from a previously published dataset (55). (FH) Sorted correlation plots between mRNA expression of EGFL6 in CD45 cells and mRNA expression of cytokines and surface proteins in the indicated immune cells. Correlation was computed using the Spearman’s correlation with the sample-wise averaged gene expression. Each dot represents the Spearman’s correlation coefficients of a gene, and the dots were sorted in ascending order. P values were calculated using unpaired 2-tailed t test, 1-way, or 2-way ANOVA with Tukey’s post test for multiple comparisons. Data are presented as mean ± SEM. *P < 0.05, **P < 0.01, ***P < 0.001 and ****P < 0.0001.

Similar articles

Cited by

References

    1. Sharma P, et al. Primary, adaptive, and acquired resistance to cancer immunotherapy. Cell. 2017;168(4):707–723. doi: 10.1016/j.cell.2017.01.017. - DOI - PMC - PubMed
    1. Theivanthiran B, et al. A tumor-intrinsic PD-L1/NLRP3 inflammasome signaling pathway drives resistance to anti-PD-1 immunotherapy. J Clin Invest. 2020;130(5):2570–2586. doi: 10.1172/JCI133055. - DOI - PMC - PubMed
    1. Matulonis UA, et al. Antitumor activity and safety of pembrolizumab in patients with advanced recurrent ovarian cancer: results from the phase II KEYNOTE-100 study. Ann Oncol. 2019;30(7):1080–1087. doi: 10.1093/annonc/mdz135. - DOI - PubMed
    1. Liu JF, et al. Safety, clinical activity and biomarker assessments of atezolizumab from a Phase I study in advanced/recurrent ovarian and uterine cancers. Gynecol Oncol. 2019;154(2):314–322. doi: 10.1016/j.ygyno.2019.05.021. - DOI - PubMed
    1. Fucikova J, et al. Immunological configuration of ovarian carcinoma: features and impact on disease outcome. J Immunother Cancer. 2021;9(10):e002873. doi: 10.1136/jitc-2021-002873. - DOI - PMC - PubMed

MeSH terms