. 2024 Oct 4;23(10):4694-4703.
doi: 10.1021/acs.jproteome.4c00621. Epub 2024 Sep 23.

Deep Profiling of Plasma Proteoforms with Engineered Nanoparticles for Top-Down Proteomics

Affiliations

Deep Profiling of Plasma Proteoforms with Engineered Nanoparticles for Top-Down Proteomics

Che-Fan Huang et al. J Proteome Res. .

Abstract

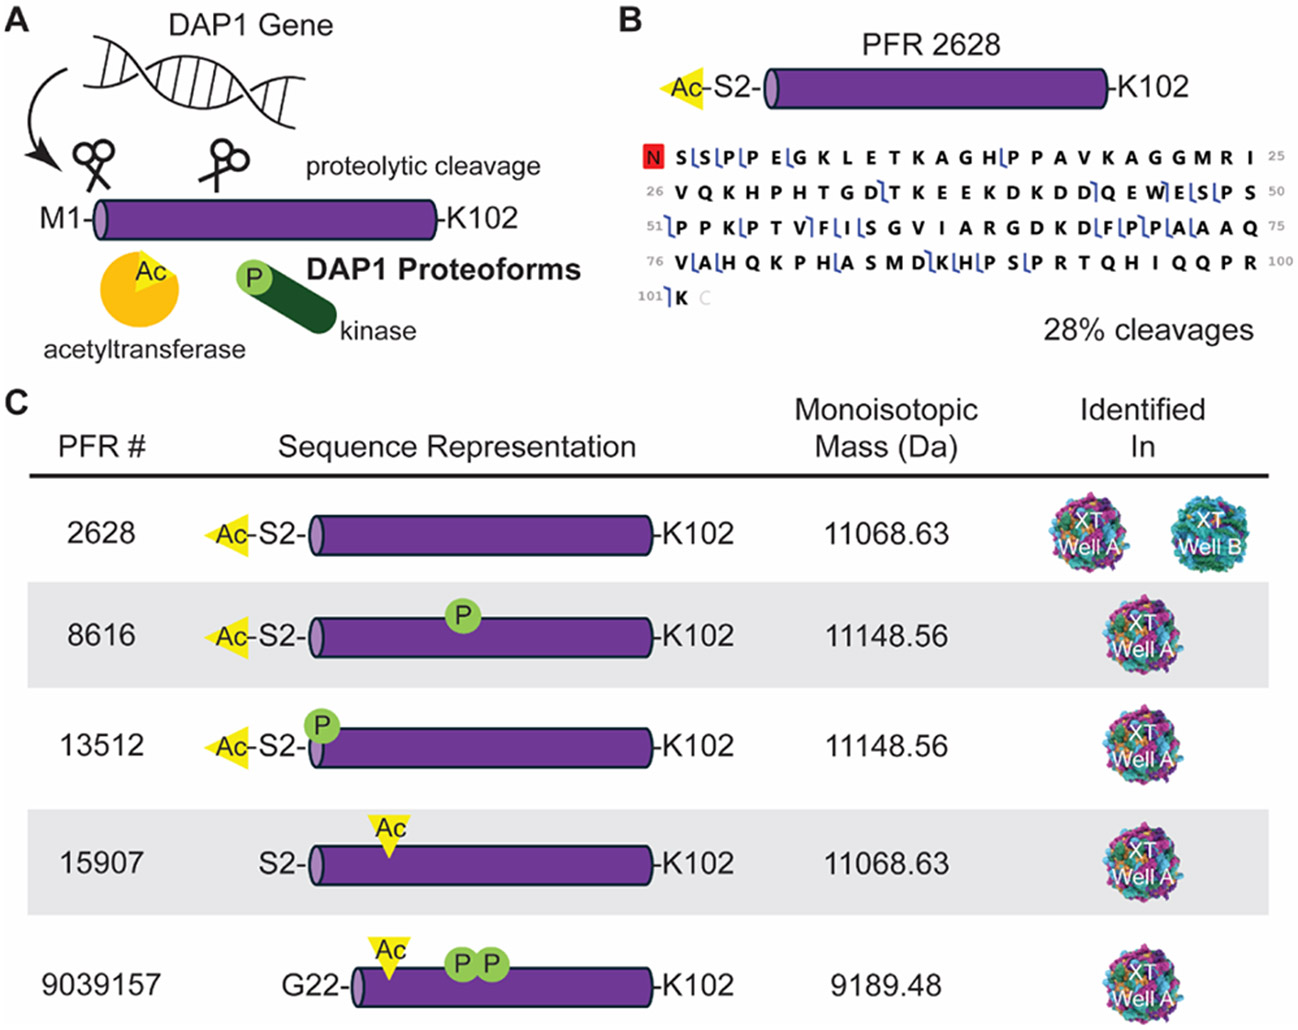
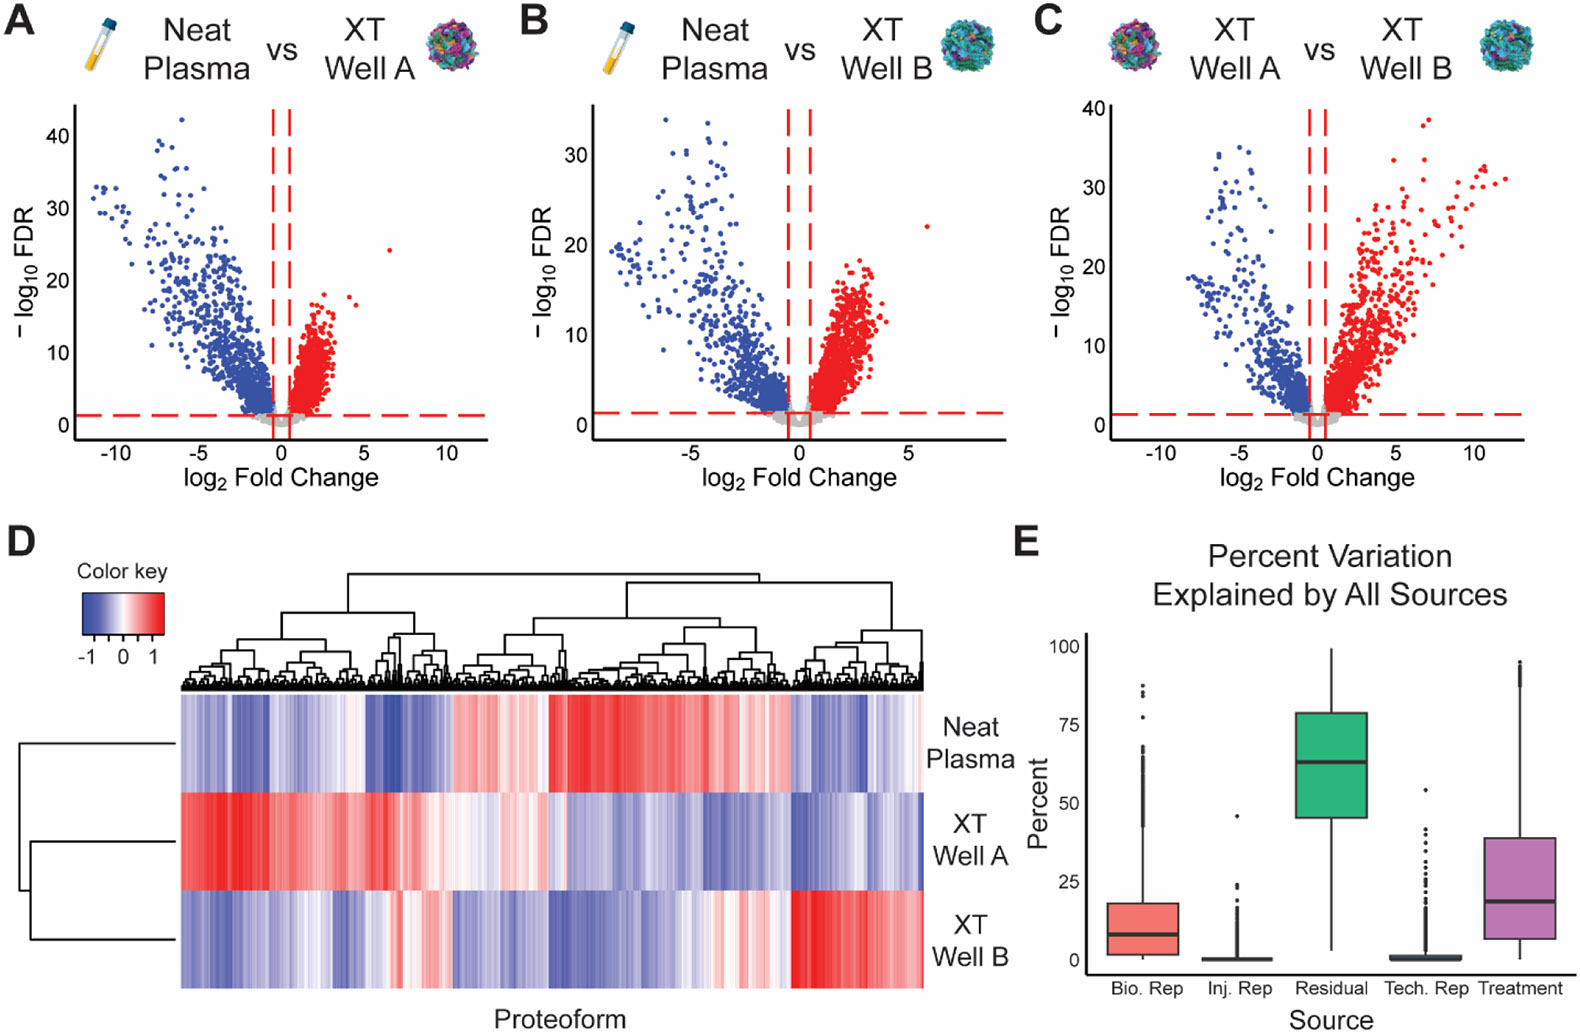
The dynamic range challenge for the detection of proteins and their proteoforms in human plasma has been well documented. Here, we use the nanoparticle protein corona approach to enrich low-abundance proteins selectively and reproducibly from human plasma and use top-down proteomics to quantify differential enrichment for the 2841 detected proteoforms from 114 proteins. Furthermore, nanoparticle enrichment allowed top-down detection of proteoforms between ∼1 μg/mL and ∼10 pg/mL in absolute abundance, providing up to a 105-fold increase in proteome depth over neat plasma in which only proteoforms from abundant proteins (>1 μg/mL) were detected. The ability to monitor medium and some low-abundant proteoforms through reproducible enrichment significantly extends the applicability of proteoform research by adding depth beyond albumin, immunoglobins, and apolipoproteins to uncover many involved in immunity and cell signaling. As proteoforms carry unique information content relative to peptides, this report opens the door to deeper proteoform sequencing in clinical proteomics of disease or aging cohorts.

Keywords: nanoparticles; plasma; protein corona; proteoforms; top-down proteomics.


Figures

Figure 1.
Figure 1.
Study design and workflow. Plasma from three human subjects (bioreps) was enriched with two reaction wells from Proteograph XT (XT well A and XT well B). Neat plasma and nanoparticle eluates were extracted for proteins <50 kDa (PEPPI), and an established top-down LC/MS workflow in discovery mode and TDportal search were used to identify and quantify proteoforms. Each nanoparticle enrichment of the sample was performed in triplicate (techreps). All LCMS injections were performed in triplicate (injreps). Proteoforms were filtered for 1% FDR, and quantitative analysis was performed in RStudio.
Figure 2.
Figure 2.
Proteoforms and proteins were identified in this study. We report 2841 unique proteoforms (A) and 114 proteins (B) identified in neat plasma and NPs combined. Compared to neat plasma only, the NPs increase the proteoform identifications by over 4-fold. We note that the intersections between neat plasma and XT well A and B are extremely small, supporting that NPs interrogate parts of the plasma proteome that were inaccessible without enrichment. (C) Mass distribution of the identified proteoforms, all of which were <50 kDa using the top-down PEPPI-LCMS workflow.
Figure 3.
Figure 3.
Waterfall plots of identified proteins and their abundances reported in HPPP (left) and gene ontology analysis (right). The individual waterfall plots of protein identified in neat plasma (A, 20 proteins) and XT NPs (B, 80 proteins; C, 57 proteins) show that the NPs enable the detection of more proteoforms of proteins that have low estimated abundances in the HPPP. GO analysis revealed that more proteins associated with immune responses and cell signaling were identified under NP-enriched conditions.
Figure 4.
Figure 4.
DAP1 proteoforms. (A) DAP1 protein undergoes several post-translation modifications including proteolytic cleavage, acetylation, and phosphorylation that result in several proteoforms. (B) Representative sequence coverage map of one DAP1 proteoform (PFR 2628). (C) Five DAP1 proteoforms were identified in NP-enriched conditions.
Figure 5.
Figure 5.
Nanoparticles differentially fractionate proteoforms (10% FDR) in human plasma. (A-C) Volcano plots comparing neat plasma/NP and different NPs. Differential enrichments were characterized by large fold changes in proteoform abundances between neat plasma and nanoparticles (A, 4256 proteoforms; B, 4173 proteoforms) as well as between different nanoparticles (C, 4172 proteoforms). (D) Unsupervised clustering reveals unique clusters of proteoforms in neat plasma enriched by different NPs. (E) Source of variance plot shows that the major contributors of differences observed are from different NP treatments.

Update of

References

    1. Surinova S; Schiess R; Huttenhain R; Cerciello F; Wollscheid B; Aebersold R On the development of plasma protein biomarkers. J. Proteome Res 2011, 10 (1), 5–16. - PubMed
    1. Geyer PE; Holdt LM; Teupser D; Mann M Revisiting biomarker discovery by plasma proteomics. Mol. Syst. Biol 2017, 13 (9), 942. - PMC - PubMed
    1. Eldjarn GH; Ferkingstad E; Lund SH; Helgason H; Magnusson OT; Gunnarsdottir K; Olafsdottir TA; Halldorsson BV; Olason PI; Zink F; et al. Large-scale plasma proteomics comparisons through genetics and disease associations. Nature 2023, 622 (7982), 348–358. - PMC - PubMed
    1. Hortin GL; Sviridov D The dynamic range problem in the analysis of the plasma proteome. J. Proteomics 2010, 73 (3), 629–636. - PubMed
    1. Tirumalai RS; Chan KC; Prieto DA; Issaq HJ; Conrads TP; Veenstra TD Characterization of the low molecular weight human serum proteome. Mol. Cell. Proteomics 2003, 2 (10), 1096–1103. - PubMed

LinkOut - more resources