. 2024 Nov:77:103365.
doi: 10.1016/j.redox.2024.103365. Epub 2024 Sep 19.

Glutathione peroxidase 3 is essential for countering senescence in adipose remodelling by maintaining mitochondrial homeostasis

Affiliations

Glutathione peroxidase 3 is essential for countering senescence in adipose remodelling by maintaining mitochondrial homeostasis

Yijie Song et al. Redox Biol. 2024 Nov.

Abstract

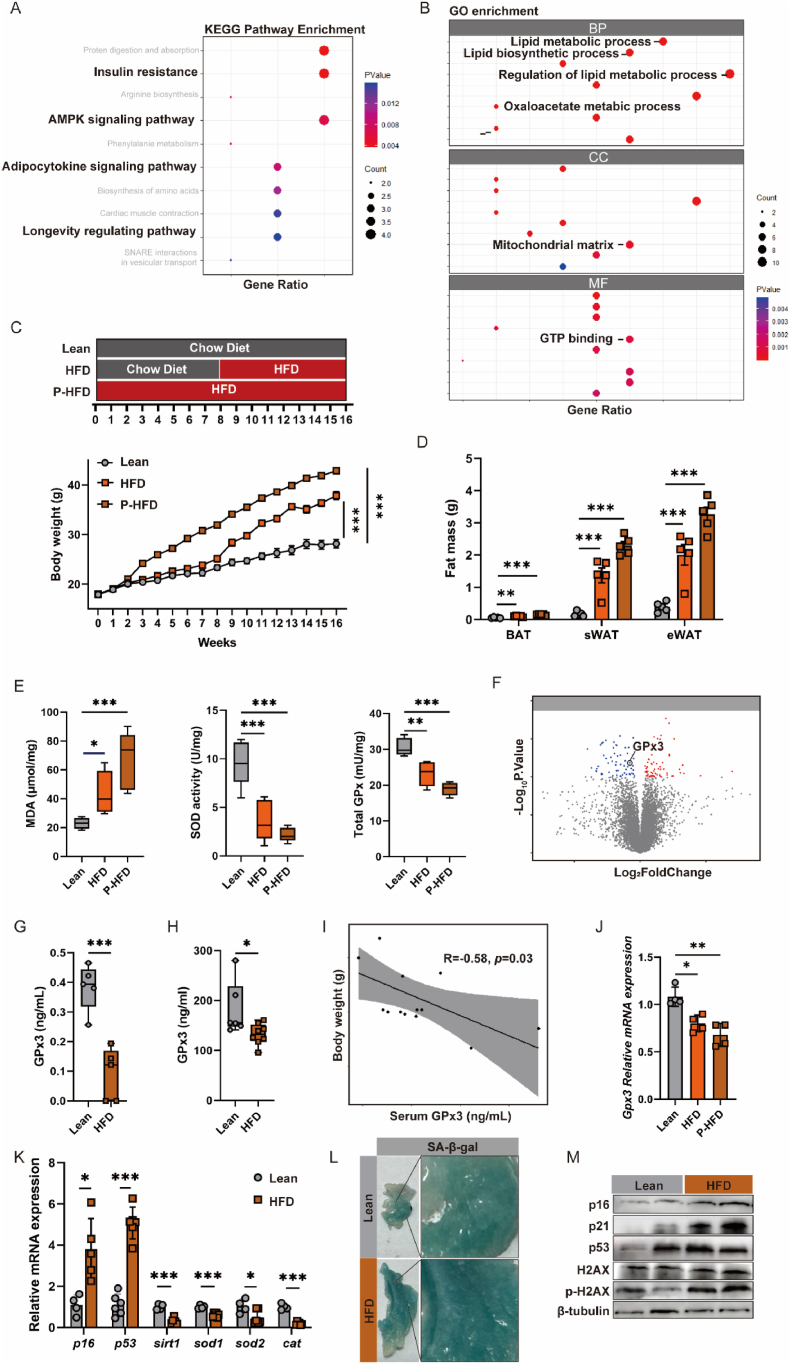
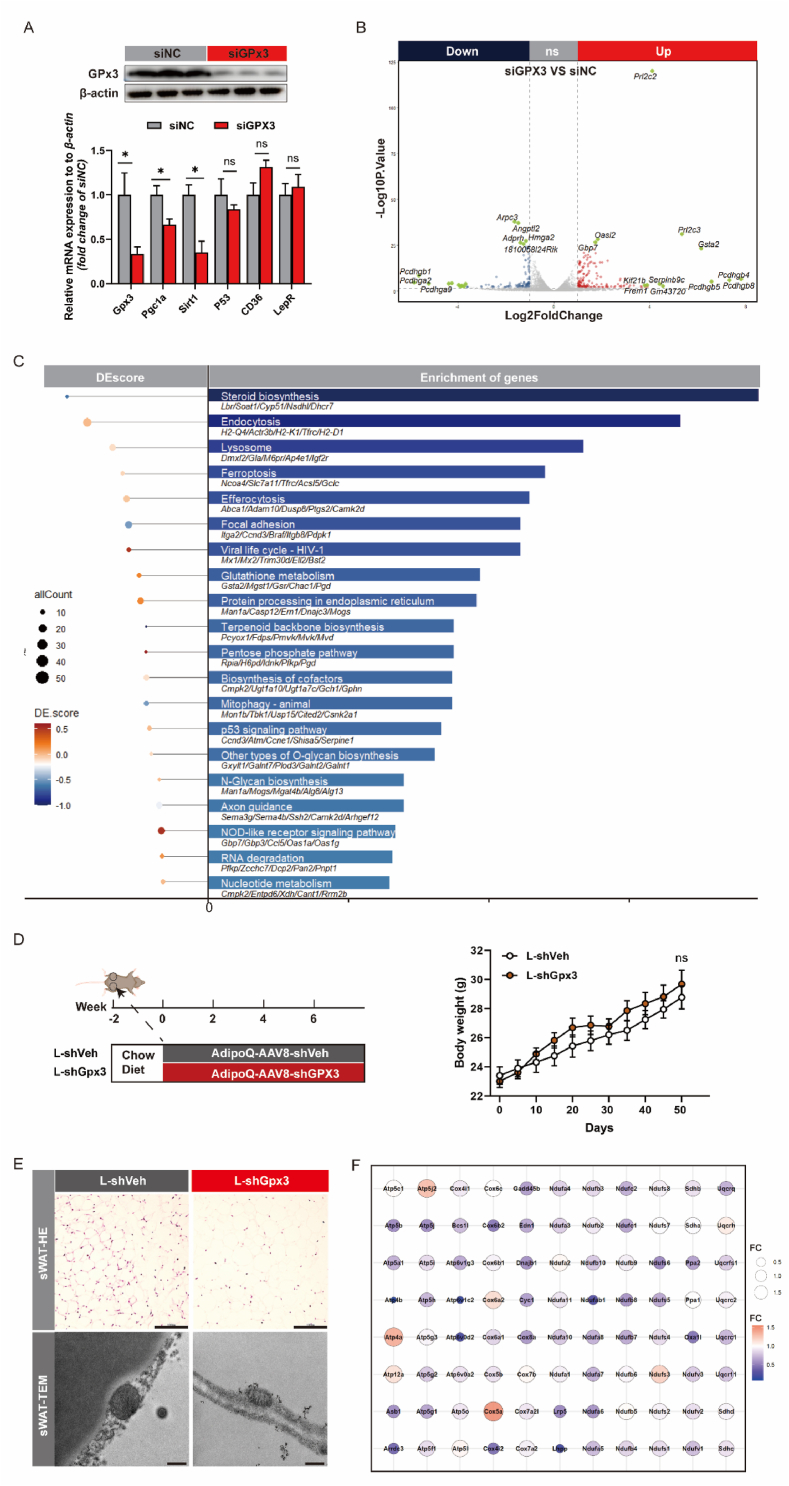
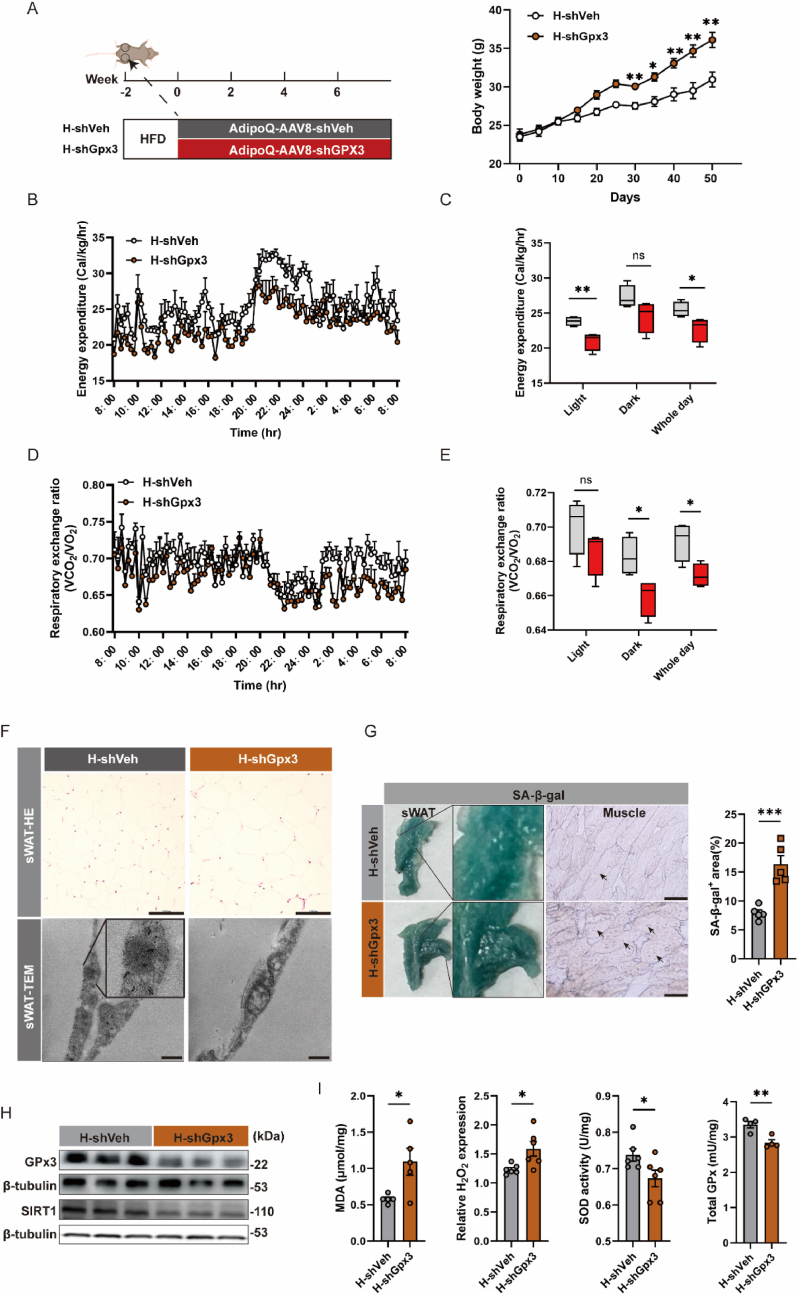
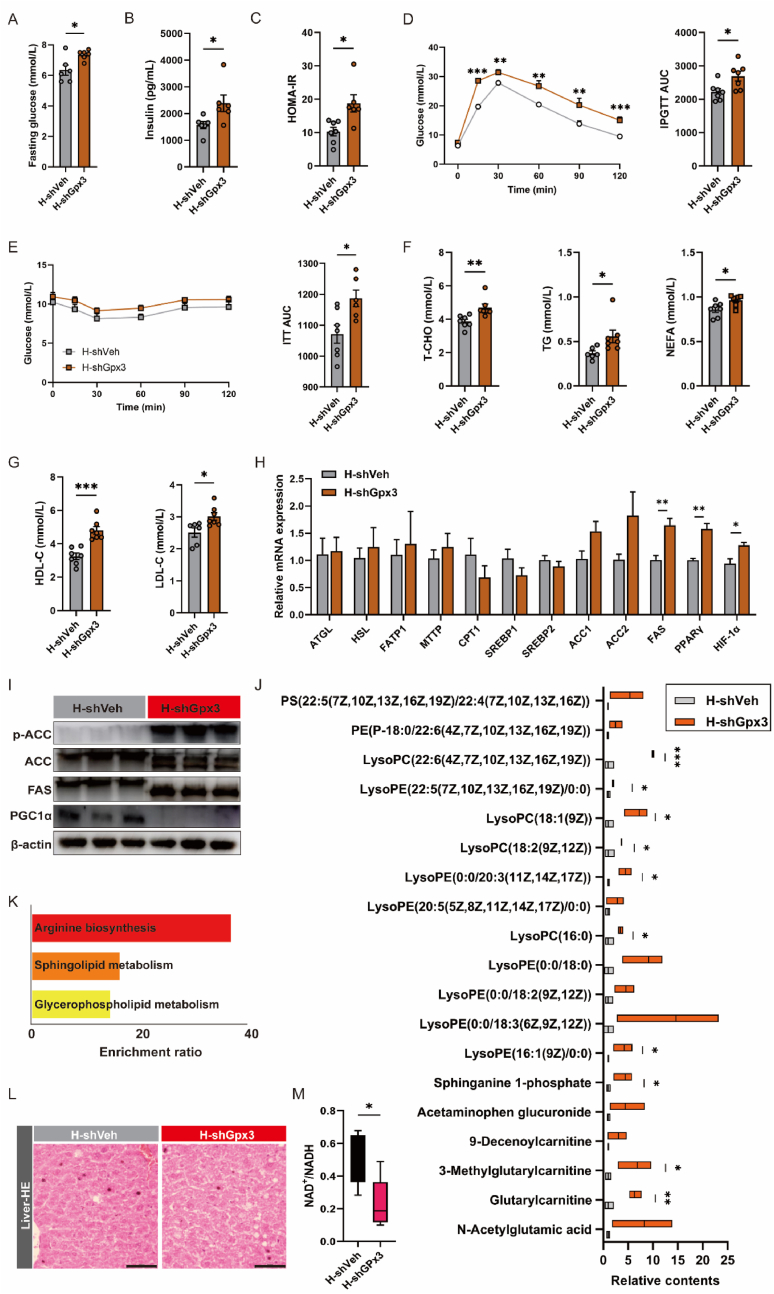
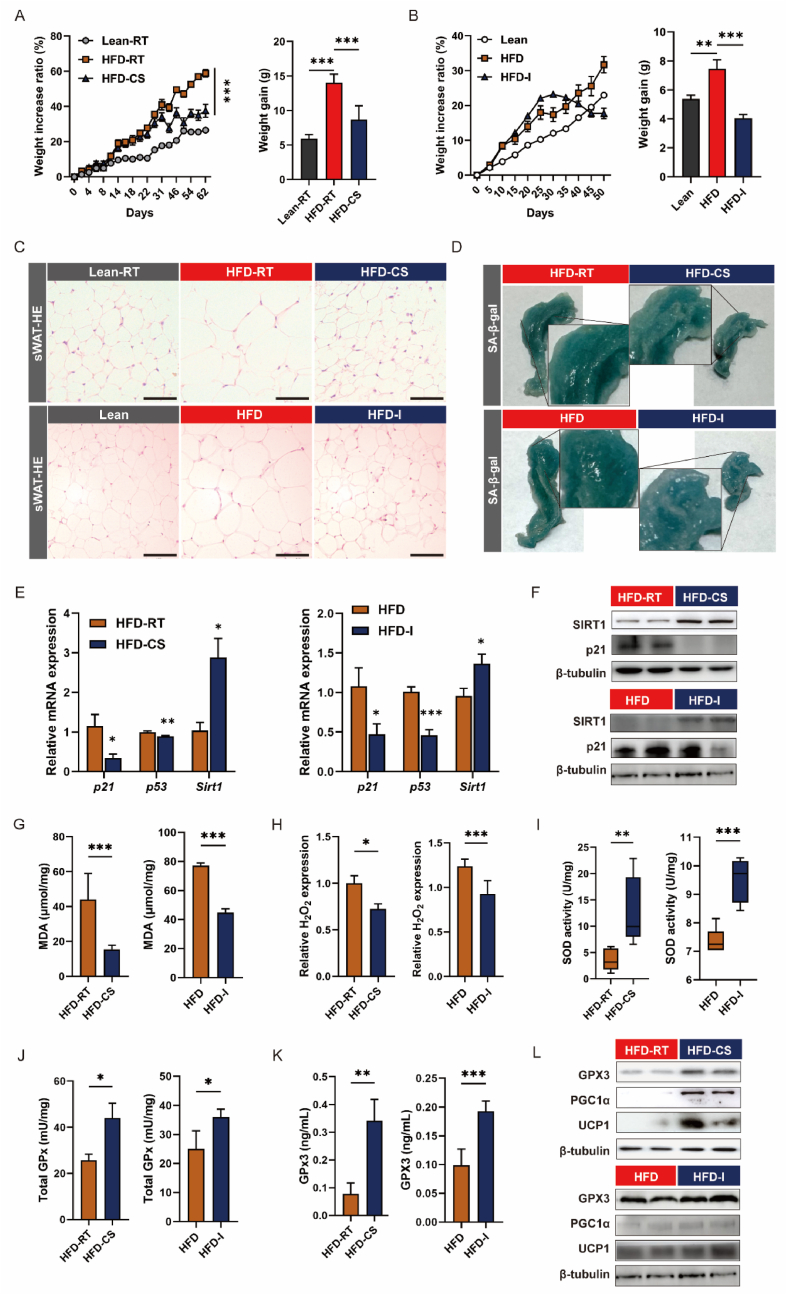
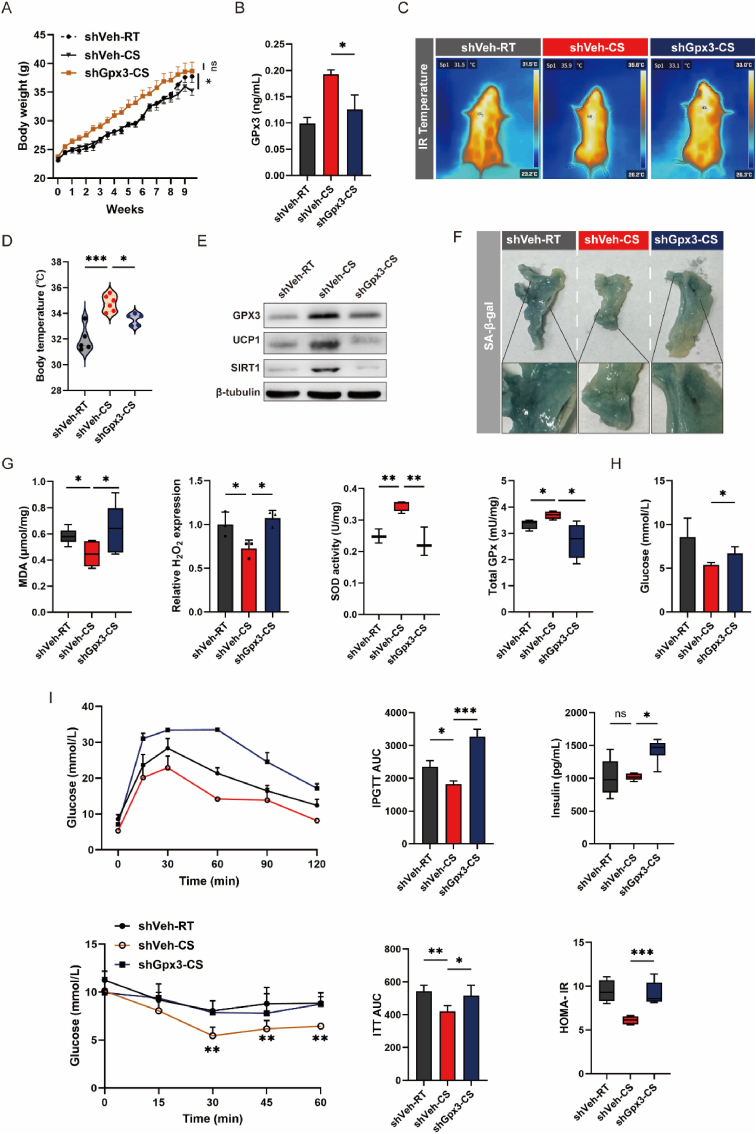
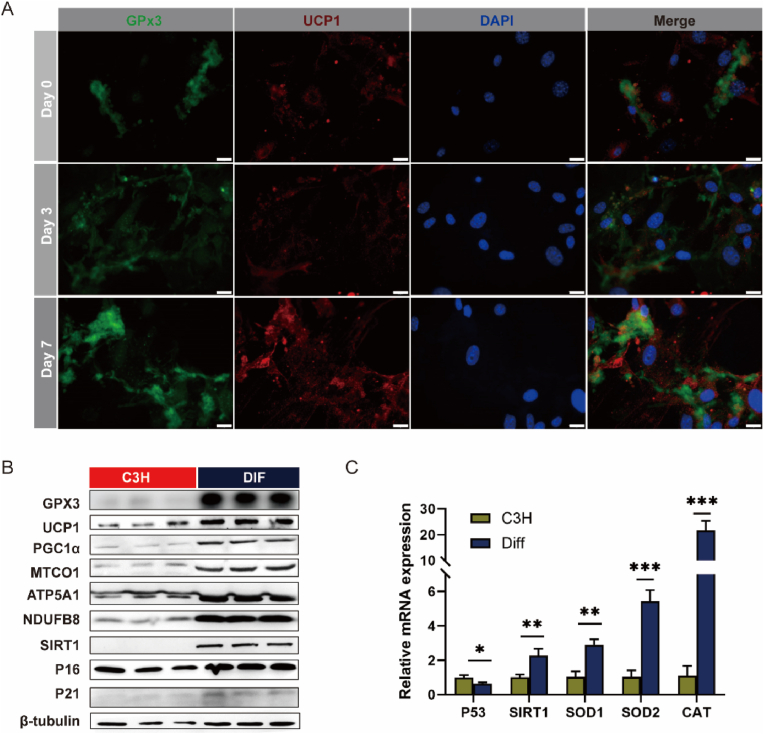
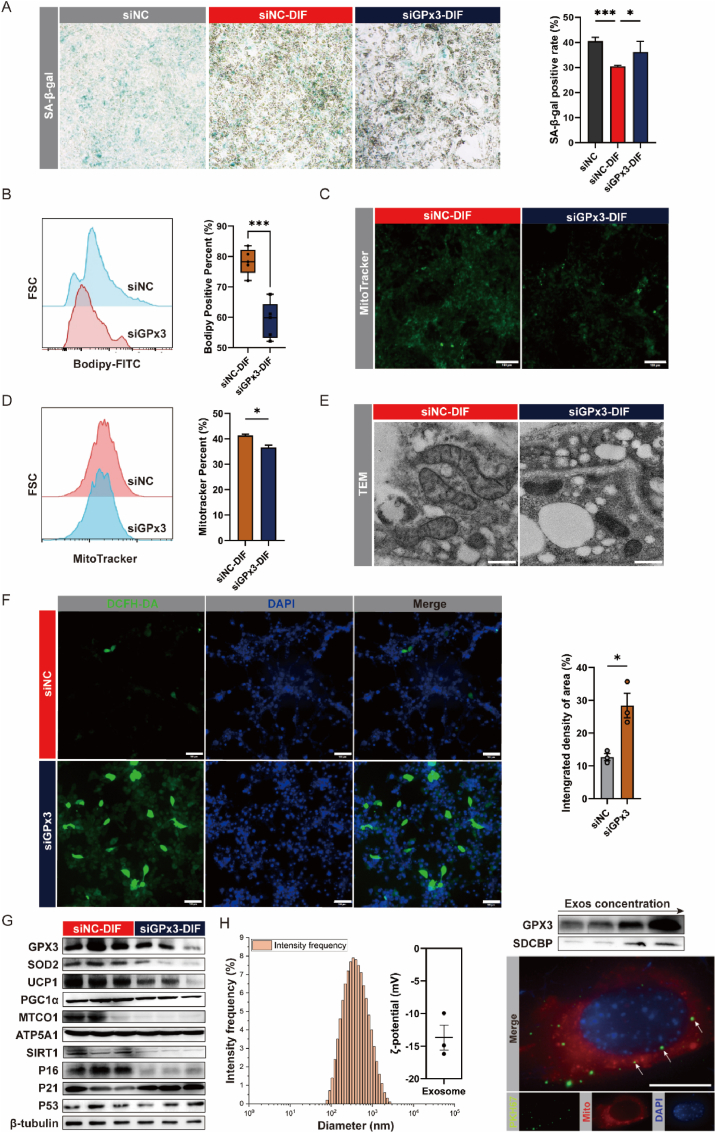
Adipose tissue senescence is a precursor to organismal aging and understanding adipose remodelling contributes to discovering novel anti-aging targets. Glutathione peroxidase 3 (GPx3), a critical endogenous antioxidant enzyme, is diminished in the subcutaneous adipose tissue (sWAT) with white adipose expansion. Based on the active role of the antioxidant system in counteracting aging, we investigated the involvement of GPx3 in adipose senescence. We determined that knockdown of GPx3 in adipose tissue by adeno-associated viruses impaired mitochondrial function in mice, increased susceptibility to obesity, and exacerbated adipose tissue senescence. Impairment of GPx3 may cause mitochondrial dysfunction through inner mitochondrial membrane disruption. Adipose reshaping management (cold stimulation and intermittent diet) counteracted the aging of tissues, with an increase in GPx3 expression. Overall metabolic improvement induced by cold stimulation was partially attenuated when GPx3 was depleted. GPx3 may be involved in adipose browning by interacting with UCP1, and GPx3 may be a limiting factor for intracellular reactive oxygen species (ROS) accumulation during stem cell browning. Collectively, these findings emphasise the importance of restoring the imbalanced redox state in adipose tissue to counteract aging and that GPx3 may be a potential target for maintaining mitochondrial homeostasis and longevity.

Keywords: Adipose tissue; Anti-Senescence; Glutathione peroxidase 3; Mitochondrial.


Conflict of interest statement

Declaration of competing interest None. The authors declare that there are no known financial interests or personal relationships that might interfere with work reported in this paper.

Figures

Fig. 1
Fig. 1
Bioinformatics analysis and experimental evaluation of GPx3 in obese mice; (A) KEGG pathway and (B) GO enrichment of DEG based on GSE24637; (C) Body weight and (D) fat mass, where the HFD group was fed with high-fat diet for 8 weeks and the prolonged HFD (P-HFD) group for 16 weeks; (E) Malondialdehyde (MDA) concentration, total SOD and total GPx enzyme activity assays in sWAT; (F) Gene expression (GSE24637) shown as a volcano plot, where down-regulated genes in the obese group are labeled in blue and up-regulated genes are labeled in red; (G) GPx3 concentration in sWAT and (H) serum; (I) Correlation analysis between body weight and serum GPx3 levels; (J) Gpx3 mRNA expression in Swat (fold change of Lean); (K) Senescence and antioxidant-related gene mRNA expressions in sWAT. Relative expression of target genes for β-actin (fold change of Lean); (L) β-galactosidase staining of sWAT to assess cellular senescence; (M) Ageing-related protein expressions in sWAT. (For interpretation of the references to colour in this figure legend, the reader is referred to the Web version of this article.)
Fig. 2
Fig. 2
GPx3 deficiency resulted in impaired mitochondrial respiration. (A) GPx3 protein expression in C3H/10T1/2 cells transfected with siGPx3 and the mRNA expression of senescence- and obesity-related genes in siGPx3-transfected cells; (B) The DEG were set to |Fold change| > 2; adjusted p < 0.05 by RNA-seq; (C) Differential gene KEGG enrichment analysis and DEsore scoring; (D) Body weight evaluation of mice receiving chow diet after subcutaneous spot injections of AdipoQ-AAV8-shGPx3/shVeh; (E) Representative hematoxylin and eosin (H&E) staining (scale bars: 100 μm) from sWAT sections, and transmission electronic microscopy (TEM) images (magnification: 17500×, scale bars: 5 μm) of sWAT from L-shVeh or L-shGPx3 group; (F) MitoArray PCR of sWAT between L-shVeh and L-shGPx3 group.
Fig. 3
Fig. 3
GPx3 deficiency increased obesity susceptibility via impaired mitochondrial energy expenditure. (A) Body weight of mice receiving HFD after subcutaneous spot injections of AdipoQ-AAV8-shGPx3/shVeh; (B) Energy expenditure was evaluated and expressed as Kcal/kg/h per animal; (C) The bar graphs represent the energy expenditure average for each group; (D) Respiratory exchange ratio was evaluated by monitoring CO2 and O2 consumption; (E) The bar graphs represent the respiratory exchange ratio average for each group; (F) Representative H&E staining (scale bars: 100 μm) from sWAT sections, and TEM images (magnification: 17500×, scale bars: 5 μm) of sWAT from H-shVeh or H-shGPx3; (G) β-galactosidase staining of sWAT and cryosections of sWAT-adjacent muscle (scale bars: 100 μm); (H) GPx3 and SIRT1 protein expression in sWAT; (I) MDA, H2O2 concentration, total SOD and total GPx enzyme activity in sWAT.
Fig. 4
Fig. 4
GPx3 deficiency worsened the glycolipid metabolism on HFD-fed mice. Glucose metabolism profiles in the H-shVeh and H-shGPx3 mice, including (A) fasting blood glucose levels, (B) serum insulin levels, and (C) assessment of the index of insulin resistance (HOMA-IR). HOMA-IR was calculated by the corresponding insulin and fasting blood glucose of each mouse; (D) Glucose tolerance test (GTT), and (E) insulin tolerance test (ITT) in H-shVeh and H-shGPx3 mice at day 50, with quantification of area under the curve (AUC); (F–G) Serum lipid metabolism profiles in the H-shVeh and H-shGPx3 mice, including T-CHO, TG, NEFA, LDL-C and HDL-C levels; (H) The mRNA levels of lipid metabolism-related genes; (I) Protein expressions of p-ACC, ACC, FAS and PGC1α in sWAT of H-shVeh and H-shGPx3 mice; (J) Serum lipid metabolite concentrations of H-shVeh and H-shGPx3 mice, which were measured by the untargeted lipid metabolome as described in Methods; (K) Enrichment analysis of lipid differential metabolites in H-shVeh and H-shGPx3 serum; (L) H&E staining for liver sections (scale bars: 50 μm) from H-shVeh and H-shGPx3 mice; (M) The NAD⁺/NADH ratio in serum from H-shVeh and H-shGPx3 mice.
Fig. 5
Fig. 5
Cold stimulation (HFD-CS) and intermittent feeding (HFD-I) enhanced antioxidant capacity to counteracting ageing. (A) Body weight increase ratio and final weight gain of Lean-RT, HFD-RT and HFD-CS groups; (B) Body weight increase ratio and final weight gain of Lean, HFD and HFD-I groups; (C) H&E staining of sWAT from Lean-RT, HFD-RT and HFD-CS (upper panel), and H&E staining of sWAT (scale bars: 100 μm) from Lean, HFD and HFD-I (bottom panel); (D) The β-galactosidase staining of sWAT from HFD-RT and HFD-CS (upper panel), and β-galactosidase staining of sWAT from HFD and HFD-I (bottom panel) with partial magnification of the deepest part of the staining to assess senescence; (E–F) The mRNA and protein expression of senescence-related indicators in sWAT (HFD-RT vs HFD-CS, and HFD vs HFD-I, respectively); (G–J) Evaluation of oxidative stress indicator levels, including MDA, H2O2, SOD, and GPx in sWAT (HFD-RT vs HFD-CS, and HFD vs HFD-I, respectively); (K) The concentration of GPx3 in sWAT (HFD-RT vs HFD-CS, and HFD vs HFD-I, respectively); (L) GPx3, PGC1α and UCP1 protein levels in sWAT (HFD-RT vs HFD-CS, and HFD vs HFD-I, respectively).
Fig. 6
Fig. 6
GPx3 knockdown partly abolished the CS-induced thermogenesis and metabolic improvement. (A) Body weight evaluation of shVeh-RT, shVeh-CS, and shGPx3-CS mice; (B) GPx3 concentration in sWAT from shVeh-RT, shVeh-CS, and shGPx3-CS mice; (C) Thermal imaging photos of shVeh-RT, shVeh-CS and shGPx3-CS mice; (D) The body temperatures of each group were visualized in a bar graph; (E) Protein expression of GPx3, UCP1 and SIRT1 in sWAT from shVeh-RT, shVeh-CS, and shGPx3-CS mice; (F) The β-Galactosidase staining of sWAT from shVeh-RT, shVeh-CS, and shGPx3-CS mice with partial magnification of the deepest part of the staining to assess senescence; (G) Evaluation of oxidative stress indicators levels, including MDA, H2O2, SOD activity, and total GPx activity in sWAT from shVeh-RT, shVeh-CS, and shGPx3-CS mice; (H–I) Evaluating glucose metabolism among shVeh-RT, shVeh-CS, and shGPx3-CS mice by measuring, fasting blood glucose level, GTT, ITT, serum insulin level, and HOMA-IR.
Fig. 7
Fig. 7
GPx3 deficiency weaken CS-induced thermogenesis due to mitochondrial disorganisation. (A) Differential proteins in shGpx3-CS and shVeh-CS groups presented as volcano plots, in which down-regulated proteins were marked in blue in the shGPX3-CS group and up-regulated in red; (B) The subcellular localisation of the differential proteins was predicted based on the MultiLoc package; (C) GSEA analysis of differential proteins and display of mitochondria-associated pathways; (D) The mtDNA copy number in sWAT of shVeh-RT, shVeh-CS, and shGpx3-CS mice; (E) MitoTracker staining of SVF isolated from sWAT by Flow Cytometry analysis; (F) TEM images of sWAT from shVeh-RT, shVeh-CS, and shGpx3-CS mice with magnified demonstration of localized mitochondria (magnification: 17500×, scale bars: 5 μm); (G) KEGG enrichment analysis of differential proteins in sWAT between shGpx3-CS and shVeh-CS mice. (For interpretation of the references to colour in this figure legend, the reader is referred to the Web version of this article.)
Fig. 8
Fig. 8
GPx3 may interact with UCP proteins participating in adipose browning. (A) GSEA analysis of oxidative phosphorylation and thermogenesis, following the KEGG enrichment analysis of differential proteins in sWAT of shGpx3-CS and shVeh-CS mice; (B) GPx3 and Ucp1/Ucp2 immunofluorescence staining (Green fluorescence for GPx3, red for UCP1) of sWAT sections from shVeh-CS and shGPx3-CS mice (scale bars: 50 μm); (C) Molecular docking of UCP1 and GPx3 and results of co-IP experiments; (D) GPx3 expression in UCP1- and UCP+ fraction of SVF from sWAT; (E) Quantification of total cell numbers and UCP1+ cells in the SVF between shVeh-CS and shGPx3-CS mice, as well as MitoTracker analysis in UCP1+ cells; (F) Schematic illustrating the proposed interactions between GPx3 and UCP1 and their effects on adipose tissue browning. (For interpretation of the references to colour in this figure legend, the reader is referred to the Web version of this article.)
Fig. 9
Fig. 9
Adipocyte browning possesses anti-ageing potential accompanied by elevated antioxidative activity. (A) C3H/10T1/2 cells were induced into the brown adipocytes by giving a mixed cocktail of stimuli. Immunofluorescence staining of cells for GPx3 and UCP1 during induction of differentiation (Day 0, 3, and 7) (scale bars: 20 μm); (B) Protein expression of senescence and antioxidant-related indicators in C3H- and DIF-group cell; (C) mRNA expression levels of senescence- and antioxidant-related genes between C3H- and DIF-group cell, with relative gene expression compared to β-actin. (For interpretation of the references to colour in this figure legend, the reader is referred to the Web version of this article.)
Fig. 10
Fig. 10
GPx3 may be required for the maintenance of differentiated browning potential of adipocytes. (A) Galactosidase staining of siNC, si–NC–DIF and siGPx3-DIF cells to assess cellular senescence; (B) Evaluating beige adipogenesis levels in si–NC–DIF and siGPx3-DIF cells using bodipy staining; (C) Immunofluorescence staining of MitoTracker in siNC-DIF and siGPx3-DIF cells to visualize mitochondria (scale bars: 100 μm); (D) Flow cytometric analysis of MitoTracker+ cell percentages in siNC-DIF and siGPx3-DIF cells; (E) TEM representative images of siNC-DIF and siGPx3-DIF cells (magnification: 17500×, scale bars: 5 μm); (F) Immunofluorescence staining with DCFH-DA in siNC and siGPx3 cells to detect oxidative stress, with a bar graph showing the integrated density of area (%); (G) Expression profiling of mitochondrial and senescence-related proteins in siNC-DIF and siGPx3-DIF cells; (H) Nanoparticle tracking analysis and GPx3 protein expression of C3H-released exosomes. Cellular uptake of exosomes labeled with PKH67 was assessed, with mitochondria visualized using MitoTracker (scale bars: 10 μm).

References

    1. Partridge L., Deelen J., Slagboom P.E. Facing up to the global challenges of ageing. Nature. 2018;561:45–56. doi: 10.1038/s41586-018-0457-8. - DOI - PubMed
    1. Soerjomataram I., Bray F. Planning for tomorrow: global cancer incidence and the role of prevention 2020-2070. Nat. Rev. Clin. Oncol. 2021;18:663–672. doi: 10.1038/s41571-021-00514-z. - DOI - PubMed
    1. Yu L., Wan Q., Liu Q., et al. IgG is an aging factor that drives adipose tissue fibrosis and metabolic decline. Cell Metabol. 2024;36:793–807.e795. doi: 10.1016/j.cmet.2024.01.015. - DOI - PMC - PubMed
    1. López-Otín C., Blasco M.A., Partridge L., et al. Hallmarks of aging: an expanding universe. Cell. 2023;186:243–278. doi: 10.1016/j.cell.2022.11.001. - DOI - PubMed
    1. Palmer A.K., Jensen M.D. Metabolic changes in aging humans: current evidence and therapeutic strategies. J. Clin. Invest. 2022;132 doi: 10.1172/jci158451. - DOI - PMC - PubMed

Publication types

LinkOut - more resources