. 2025 Jan;24(1):e14342.
doi: 10.1111/acel.14342. Epub 2024 Sep 23.

Aging disrupts locus coeruleus-driven norepinephrine transmission in the prefrontal cortex: Implications for cognitive and motor decline

Affiliations

Aging disrupts locus coeruleus-driven norepinephrine transmission in the prefrontal cortex: Implications for cognitive and motor decline

Evgeny Budygin et al. Aging Cell. 2025 Jan.

Abstract

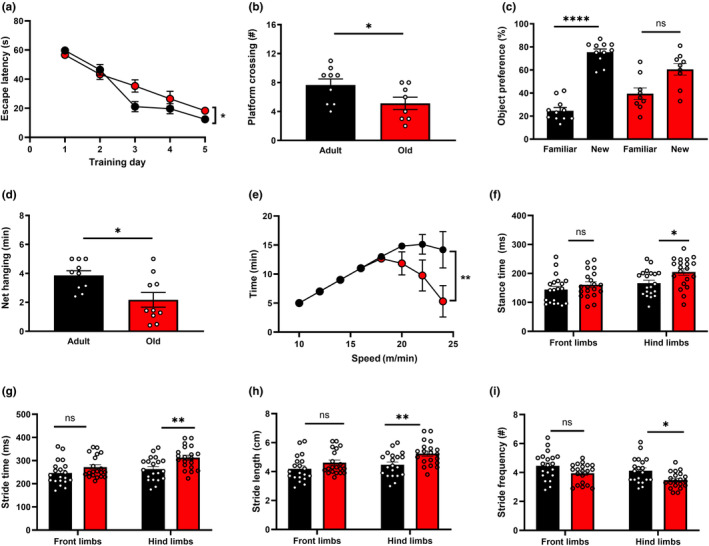
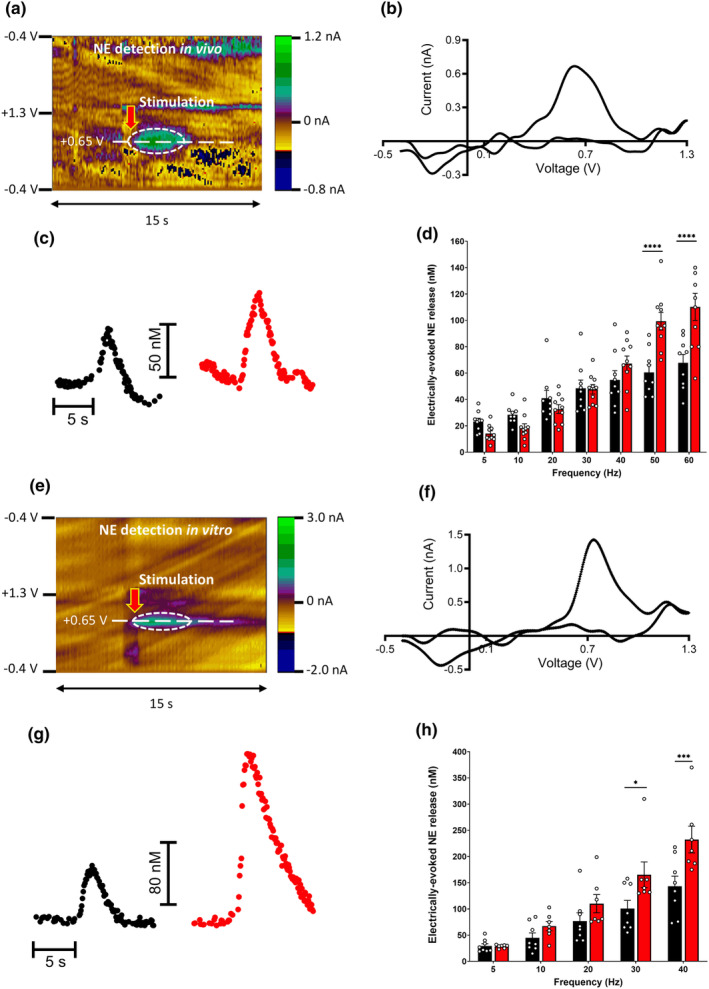
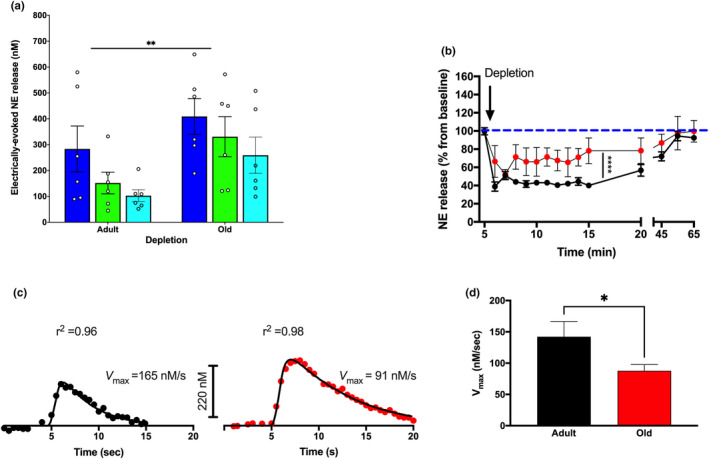
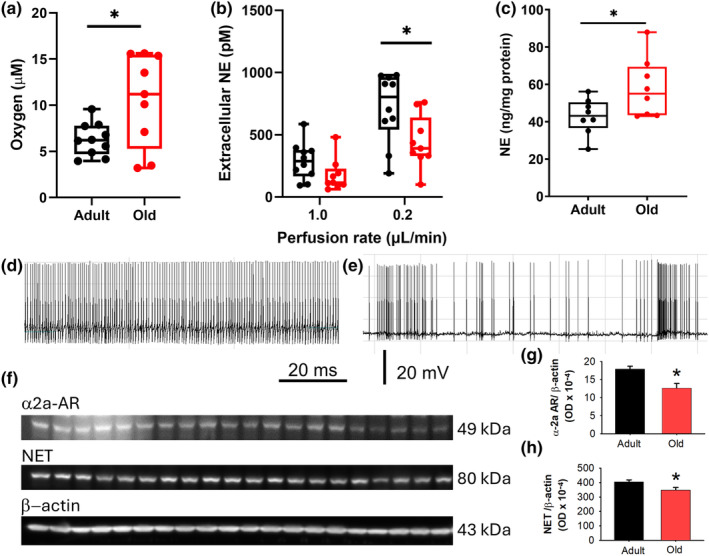
The locus coeruleus (LC)-prefrontal cortex (PFC) circuitry is crucial for cognition, planning, posture and mobility. This study examines the role of norepinephrine (NE) in elucidating the neurobiological basis of age-related cognitive and motor declines. Aged mice exhibited reduced spatial learning, impaired memory, decreased physical endurance, and notable changes in locomotor behavior. The neurochemical foundations of these deficits were investigated through fast-scan cyclic voltammetry to measure NE release in the PFC and LC, both in vivo and in brain slices. Additionally, oxygen levels were monitored as a proxy for PFC neuronal function, and NE levels were analyzed in the extracellular space via microdialysis and total content in the PFC. Aged mice exhibited a frequency-dependent increase in NE release in the PFC upon LC stimulation, suggesting alterations in neural responsiveness due to aging. We also recorded slower NE reuptake rates and increased NE content and neuronal activity, indicated by higher oxygen levels and facilitated neuron activation due to membrane depolarization recorded via whole-cell patch-clamp. To understand the basis for LC-driven NE surges in the PFC with aging, we examined the expression levels of two proteins critical for presynaptic NE release and NE reuptake: the α2a-adrenergic receptor and the NE transporter. Both showed a significant decrease in the PFC with aging. These findings support the concept that aging significantly alters the structural and functional dynamics within the LC-PFC neural circuit, impacting NE modulation and neuronal activity, which may underlie the observed declines in cognitive and motor functions in aging populations.

Keywords: Gait; aging; locus coeruleus; memory; mobility; noradrenergic neurons; prefrontal cortex.


Conflict of interest statement

The authors declare that they have no competing interests.

Figures

FIGURE 1
FIGURE 1
Decline in Cognitive Function and Physical Performance with Aging. (a) The performance of aged mice in the Morris Water Maze, indicated by longer escape latency during the training period is shown in adult control mice (3–5 months) represented by black symbols and old mice (21–23 months) represented by red symbols. (b) Following the probe trial, there were fewer platform crossings observed in old mice (n = 8) compared to adult mice (n = 9) (p = 0.05). (c) The novel object recognition test revealed working memory impairment in aged mice. Adult mice spent significantly more time exploring a new object, whereas there was no significant difference in the time spent by old mice with a familiar and new object (n = 9–11 mice per group). (d) Older mice displayed diminished overall body strength compared to adult mice in the net hanging test (n = 10 mice per group). (e) Treadmill performance tests indicated lower endurance levels in aged mice compared to their adult counterparts (n = 10 mice per group). Significant changes were observed in the gait parameters of old mice, including an increase in hind limb stance time (f), a decrease in stride frequency (g), an increase in stride length (h), and stride time (i) compared to adult mice. (n = 9–10 mice per group). Statistical comparisons were made by using two‐way ANOVA (a, e), two‐tailed Student's t‐test for unpaired (b,f,g,h,i) and paired (c) data. *p < 0.05, **p < 0.01, ****p < 0.0001; ns indicates non‐significant results (p > 0.05).
FIGURE 2
FIGURE 2
Age‐related Alterations in NE Dynamics within Locus Coeruleus‐Prefrontal Cortex Circuitry. FSCV in conjunction with electrical stimulation was employed to detect NE release in the mouse brain both in vivo (a–d) and in vitro (e–h). (a) The 2D color plots represent the results of electrochemical NE detection in the PFC of an anesthetized mouse. Here, the x‐axis indicates time, the y‐axis shows applied scan potential, and the z‐axis in pseudo‐color represents background‐subtracted faradaic current. The red arrow marks the onset of electrical stimulation. The released substance is oxidized (green spot inside of dashed circle) at a potential optimal for catecholamines. (b) The cyclic voltammogram depicts current measured across the full range of applied potentials at the peak of the detected efflux (center of the green spot on color plots). The color plots and voltammogram suggest the analyte has features (oxidation potential at +0.65 V and reduction potential at −0.2 V) characteristic of catecholamines (NE and dopamine), while pharmacological analysis (Figure S1) verifies that the measured signal is exclusively NE. (c) Representative traces from adult (left) and old (right) anesthetized mice display NE concentration changes following electrical stimulation (50 Hz, 50 pulses, 300 μA) of the LC. (d) Electrical stimulation prompts cortical NE release in a frequency‐dependent manner. The magnitudes of NE release induced by 50 Hz, 1 s—and 60 Hz, 1 s—stimulations were significantly higher in old mice compared to adult controls (mean ± s.e.m., n = 9–10 mice per group). (e) The 2D color plots present electrochemical recordings results from the mouse LC slice (see panel a for details). (f) The cyclic voltammogram shows current measured across the full range of applied potentials at the peak of the detected efflux, confirming that the measured substance is NE. (g) Representative traces from adult (left) and old (right) mice display changes in NE concentration in the LC following local electrical stimulation (30 Hz, 30 pulses, 300 μA). (h) Averaged NE responses indicate that higher frequency stimulations resulted in increased effluxes compared to lower frequency stimulations. The magnitudes of NE release induced by 30 Hz, 1 s—and 40 Hz, 1 s—stimulations were significantly higher in old mice compared to adult controls (mean ± s.e.m., n = 7–8 mice per group). Statistical comparisons were conducted using two‐way ANOVA with Sidak's multiple comparisons test. P values: *p < 0.05, ***p < 0.01, and ****p < 0.0001.
FIGURE 3
FIGURE 3
Age‐Induced Changes in the Storage, Recovery and Reuptake of NE within the LC‐PFC Pathway. (a) Old mice displayed greater resistance to NE depletion within the LC/PFC circuit in response to the sequence of stimulations (see the depletion protocol in Methods) compared to adult mice. (b) Subsequent to depletion, NE release was allowed to recover (see Methods). The outcomes are represented as a percentage of the release observed right before the depleting stimulations. The replenishment trajectories differed significantly between adult (indicated by black symbols and curves) and elderly mice (represented in red). However, both groups took an equivalent duration to completely restore the NE signal (mean ± s.e.m.; n = 6 mice per group). (c) Illustration of age‐specific variances in NE reuptake within the mouse LC. Displayed are representative curve fits of electrically‐induced NE variations observed in LC slices from adult (left) and old (right) mice. Each set of data was adjusted to a Michaelis–Menten kinetic model to ascertain the rate of uptake (Vmax). Simulated lines were drafted based on the best alignment with the collected data. For clearer visual representation, individual raw data points are plotted every fifth point. (d) A noteworthy decline in the rate of uptake was observed in old mice in comparison to their adult counterparts (mean ± s.e.m.; n = 6–7 mice for each group). For statistical evaluations, a two‐way ANOVA was utilized for parts a and b, while a two‐tailed Student's t‐test for independent samples was employed for part d. Significance levels are indicated as: *p < 0.05, **p < 0.01, and ****p < 0.0001.
FIGURE 4
FIGURE 4
Age‐related changes in norepinephrine dynamics and neuronal activity in the PFC and LC. (a) Oxygen concentration in the PFC upon LC stimulation recorded via voltammetry, showing higher levels in old mice compared to adults (*p < 0.05). (b) Extracellular NE concentration in the PFC as recorded by microdialysis at different perfusion rates. At the lower rate of 0.2 μL/min, a significant difference is observed with old mice showing lower NE levels (*p < 0.05). (c) NE content in the PFC normalized to protein concentration, determined by HPLC, indicating higher NE levels in old mice (*p = 0.026). (d) Trace of spontaneous AP generation in LC neurons from young‐adult mice. (e) Spontaneous action potential generation in LC neurons from an old mice, showing marked spike frequency irregularity. For a detailed analysis of all neurons recorded across the complete mouse cohorts, refer to Tables S2–S4. Calibration bars apply to traces in d and e. (f) PFC Immunoblots for the α2a‐adrenergic receptor, norepinephrine transporter, and β‐Actin were performed using samples from adult male (5), adult female (5), old male (5), and old female (5) mice. The samples were loaded in the same sequence from left to right in the three immunoblots. The protein expression levels of the α2a‐adrenergic receptor (g) and norepinephrine transporter (h) were normalized to β‐Actin and are graphically represented. Statistical significance was denoted by asterisks with p‐values of 0.002 and 0.005, respectively.

Similar articles

Cited by

References

    1. Aston‐Jones, G. , & Cohen, J. D. (2005). Adaptive gain and the role of the locus coeruleus‐norepinephrine system in optimal performance. The Journal of Comparative Neurology, 493(1), 99–110. 10.1002/cne.20723 - DOI - PubMed
    1. Beardmore, R. , Hou, R. , Darekar, A. , Holmes, C. , & Boche, D. (2021). The locus Coeruleus in aging and Alzheimer's disease: A postmortem and brain imaging review. Journal of Alzheimer's Disease, 83, 5–22. 10.3233/JAD-210191 - DOI - PMC - PubMed
    1. Benarroch, E. E. (2018). Locus coeruleus. Cell and Tissue Research, 373(1), 221–232. 10.1007/s00441-017-2649-1 - DOI - PubMed
    1. Bruinstroop, E. , Cano, G. , Vanderhorst, V. G. J. M. , Cavalcante, J. C. , Wirth, J. , Sena‐Esteves, M. , & Saper, C. B. (2012). Spinal projections of the A5, A6 (locus coeruleus), and A7 noradrenergic cell groups in rats. The Journal of Comparative Neurology, 520(9), 1985–2001. 10.1002/cne.23024 - DOI - PMC - PubMed
    1. Buchman, A. S. , Boyle, P. A. , Leurgans, S. E. , Barnes, L. L. , & Bennett, D. A. (2011). Cognitive function is associated with the development of mobility impairments in community‐dwelling elders. The American Journal of Geriatric Psychiatry, 19(6), 571–580. 10.1097/JGP.0b013e3181ef7a2e - DOI - PMC - PubMed

LinkOut - more resources