. 2024 Nov;300(11):107812.
doi: 10.1016/j.jbc.2024.107812. Epub 2024 Sep 21.

High resolution analysis of proteolytic substrate processing

Affiliations

High resolution analysis of proteolytic substrate processing

Jasmin Schillinger et al. J Biol Chem. 2024 Nov.

Abstract

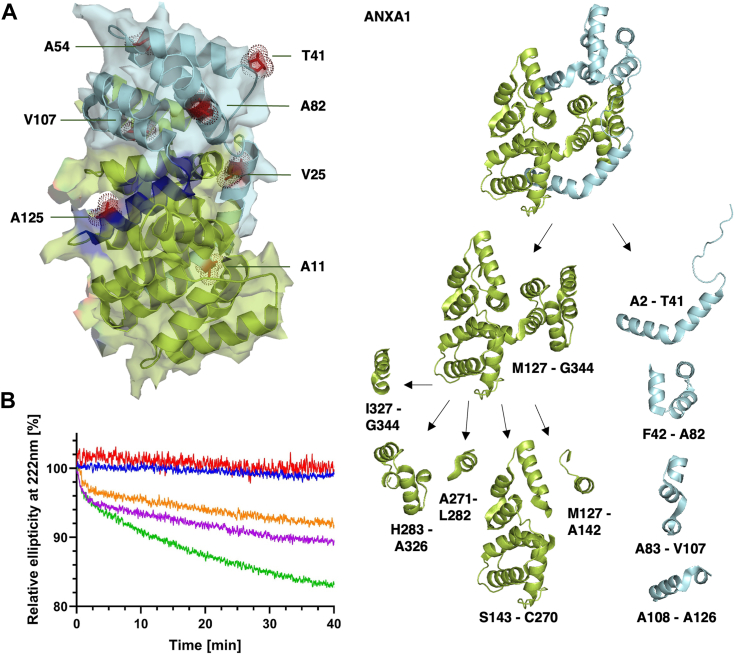
Members of the widely conserved high temperature requirement A (HtrA) family of serine proteases are involved in multiple aspects of protein quality control. In this context, they have been shown to efficiently degrade misfolded proteins or protein fragments. However, recent reports suggest that folded proteins can also be native substrates. To gain a deeper understanding of how folded proteins are initially processed and subsequently degraded into short peptides by human HTRA1, we established an integrated and quantitative approach using time-resolved mass spectrometry, CD spectroscopy, and bioinformatics. The resulting data provide high-resolution information on up to 178 individual proteolytic sites within folded ANXA1 (consisting of 346 amino acids), the relative frequency of cuts at each proteolytic site, the preferences of the protease for the amino acid sequence surrounding the scissile bond, as well as the degrees of sequential structural relaxation and unfolding of the substrate that occur during progressive degradation. Our workflow provides precise molecular insights into protease-substrate interactions, which could be readily adapted to address other posttranslational modifications such as phosphorylation in dynamic protein complexes.

Keywords: ANXA1; HTRA1; bioinformatics; protein degradation; protein processing; proteolysis; trypsin.


Conflict of interest statement

Conflict of interest The authors declare that they have no conflicts of interest with the contents of this article.

Figures

Figure 1
Figure 1
Proteolytic degradation of ANXA1 by HTRA1 and of MDH by trypsin. A, upper panel, structures of ANXA1 (pdb code: 1HM6) and HTRA1 (3NZI). ANXA1 consists of an N-terminal domain of 41 residues (orange) and a core domain consisting of four helical repeats of about 75 amino acid residues each (purple, yellow, red, and green). Model of the HTRA1 trimer. The protease domain was taken from 3NZI, the PDZ domains were modeled. The catalytic triad is shown in green. Right, close-up of one active site with bound DPMFKLV-boro (stick representation, cyan), catalytic triad (H220, D250, S328; stick representation, yellow) and the activation domain i.e., loops L1 (green), L2 (red), L3 (orange), and LD (magenta). Lower panel, structures of MDH dimer (1MLD), individual protomers are color coded; and porcine trypsin (1AKS); residues of the catalytic triad His48, Asp92, and Ser185 are shown as sticks and in magenta. B, workflow, see text for details. C, left, proteolysis of chemically denatured and folded ANXA1 by HTRA1. Top bar: linear representation of the entire substrate protein. For each of the indicated time points (Sec), peptide sequences that align without gaps are grouped into so-called fragments, shown as bars. The number of peptides identified (Peps) and the total number of cleavage sites (Cls) are given at the right. The identified peptides aligned to the primary amino acid sequence of ANXA1 are provided in Supporting Data 1 (chemically denatured ANXA1), 3 (Folded ANXA1) and 4 (Folded ANXA1, reduced protease concentration). Right, proteolysis of chemically denatured and folded MDH by trypsin. The identified peptides aligned to the primary amino acid sequence of MDH are provided in Supporting Data 6 (chemically denatured MDH), 8 (Folded MDH) and 9 (Folded MDH, reduced protease concentration). D, model peptide and standard nomenclature. The residue of the scissile bond (magenta) is termed P1, which is often the major determinant of substrate specificity. Residues upstream to P1 are termed P2, P3, and so on. Accordingly, residues located downstream to P1 are termed P1′, P2', P3′ and so on (14). The proteolytic cleavage site is marked by an arrow. ANXA1, annexin A1; MDH, malate dehydrogenase; HTRA1, high temperature requirement A.
Figure 2
Figure 2
Proteolysis of chemically denatured ANXA1 by HTRA1. Proteolysis of chemically denatured ANXA1 was done as described in Fig. 1B. Samples were taken at the time points indicated (Sec) and proteolytic products of ANXA1 were identified by LC-MS. P1 residues identified in n = 4 experiments as significantly enriched compared to controls are represented by numbers. Structural elements i.e., helices and loops (2ndary struct.) as detected in the crystal structure of folded ANXA1 (pdb:1HM6) are indicated. Amino acid sequence conservation (Conservation) is derived from a multiple sequence alignment (Supporting Data 2); ∗ = identical, : = conserved residues. All P1 residues identified in n = 4 independent experiments that were significantly enriched compared to controls are represented by numbers. Numbers below individual P1 positions indicate the relative frequency of cuts (Rel. freq. cuts) at each time point. No number indicates that no cleavage was detected at any of the time points investigated. ANXA1, annexin A1; HTRA1, high temperature requirement A; pdb, Protein Data Bank.
Figure 3
Figure 3
Proteolysis of folded ANXA1 by HTRA1. Proteolysis of folded ANXA1 was done as described in Fig. 1B. Samples were taken at the time points indicated (Sec) and proteolytic products of ANXA1 were identified by LC-MS. P1 residues identified in n = 4 experiments as significantly enriched compared to controls are represented by numbers. Structural elements i.e., helices and loops (2ndary struct.), B-factors and surface accessibility (surf. (gray)/buried (black) as detected in the crystal structure of folded ANXA1 (pdb:1HM6) are indicated. The color code for B-factors indicates gradually structural rigidity (blue) to flexibility (red). Amino acid sequence conservation (Conservation) is derived from a multiple sequence alignment (Supporting Data 2); ∗ = identical, : = conserved residues. Numbers below individual P1 positions indicate the relative frequency of cuts (Rel. freq. cuts) at each time point. No number indicates that no cleavage was detected at any of the time points investigated. ANXA1, annexin A1; HTRA1, high temperature requirement A.
Figure 4
Figure 4
Early cleavage events in folded ANXA1 and unfolding by fragmentation.A, Left, surface representation of ANXA1 (side view). Key P1 residues are shown as stick and dot representation. Surface exposed residues are shown in red, buried residues in orange. Right, model of how folded ANXA1 (top view) is first converted into 4 N-terminal fragments comprising residues A2-A126 (marine) generating a C-terminal fragment comprising M127-G344 (limon). Subsequently, the C-terminal fragment is further processed into five fragments. Helix 8 is highlighted in dark blue. Note that A11 is located in the background and therefore masked by the C-terminal domain. B, CD spectroscopy. HTRA1 and ANXA1 were mixed in a 1:1 (green), 1:10 (magenta) and 1:20 (orange) ratio and the ellipticity at 222 nm was monitored over time. To facilitate comparison between datasets, in each case the initial signal was set at 100% and the loss of the negative ellipticity at 222 nm is shown as a percentage of the overall signal. Briefly, 5 μM HTRA1 alone (red) or 5 μM ANXA1 alone (blue) control experiments are also shown. ANXA1, annexin A1; HTRA1, high temperature requirement A.
Figure 5
Figure 5
Proteolysis of chemically denatured MDH by trypsin. Proteolysis of chemically denatured MDH was done as described in Fig. 1B. Samples were taken at the time points indicated (Sec) and proteolytic products of MDH were identified by LC-MS. Structural elements i.e., helices and loops (2ndary struct.) as detected in the crystal structure of folded MDH (pdb:1MLD) are indicated. Amino acid sequence conservation (Conservation) is derived from a multiple sequence alignment (Supporting Data 7); ∗ = identical, : = conserved residues. All P1 residues identified in n = 4 independent experiments that were significantly enriched compared to controls are represented by numbers. Numbers below individual P1 positions indicate the relative frequency of cuts (Rel. freq. cuts) at each time point. No number indicates that no cleavage was detected at any of the time points investigated. MDH, malate dehydrogenase.
Figure 6
Figure 6
Proteolysis of folded MDH by trypsin. Proteolysis of folded MDH was done as described in Fig. 1B. Samples were taken at the time points indicated (Sec) and proteolytic products of MDH were identified by LC-MS. P1 residues identified in n = 4 experiments as significantly enriched compared to controls are represented by numbers. Structural elements i.e., helices and loops (2ndary struct.). Surface accessibility (solvent accessible (light blue), solvent inaccessible (dark blue), and interfacing residues (yellow) as detected in the crystal structure of folded MDH (pdb:1MLD) are indicated. The color code for B-factors indicates gradually structural rigidity (blue) to flexibility (lighter colors). Amino acid sequence conservation (Conservation) is derived from a multiple sequence alignment (Supporting Data 7); ∗ = identical, : = conserved residues. Numbers below individual P1 positions indicate the relative frequency of cuts (Rel. freq. cuts) at each time point. No number indicates that no cleavage was detected at any of the time points investigated. MDH, malate dehydrogenase.
Figure 7
Figure 7
Early cleavage events in folded MDH and unfolding by fragmentation. A, left, cartoon representation of the MDH structure. Key P1 residues (red) are shown as sticks and dot representation. Right, model of the sequential fragmentation of folded MDH: First, the C-terminal part of MDH comprising residues A177-K338 (green) is detached by fragmentation. Second, the remaining N-terminal fragment (cyan) is reduced to A75-R176, by cuts at R52 and R74. Subsequently, A75-R176 is processed into 4 fragments. B, CD spectroscopy. Trypsin and MDH were mixed in a 1:500 (green), 1:5000 (magenta), 1:10,000 (orange), and 1:100,000 (black) ratio and the ellipticity at 222 nm was monitored over time. To facilitate comparison between datasets, in each case the initial signal was set at 100% and the loss of the negative ellipticity at 222 nm is shown as a percentage of the overall signal. 0.01 μM trypsin alone (red) or 5 μM MDH alone (blue) control experiments are also shown. The right Y axis is used for the trypsin only control because, due to its low concentration, the signal was much lower compared to the MDH signals. MDH, malate dehydrogenase.

References

    1. Clausen T., Kaiser M., Huber R., Ehrmann M. HTRA proteases: regulated proteolysis in protein quality control. Nat. Rev. Mol. Cell Biol. 2011;12:152–162. - PubMed
    1. Clausen T., Southan C., Ehrmann M. The HtrA family of proteases. Implications for protein composition and cell fate. Mol. Cell. 2002;10:443–455. - PubMed
    1. Zurawa-Janicka D., Wenta T., Jarzab M., Skorko-Glonek J., Glaza P., Gieldon A., et al. Structural insights into the activation mechanisms of human HtrA serine proteases. Arch. Biochem. Biophys. 2017;621:6–23. - PubMed
    1. Eigenbrot C., Ultsch M., Lipari M.T., Moran P., Lin S.J., Ganesan R., et al. Structural and functional analysis of HtrA1 and its subdomains. Structure. 2012;20:1040–1050. - PubMed
    1. Truebestein L., Tennstaedt A., Monig T., Krojer T., Canellas F., Kaiser M., et al. Substrate-induced remodeling of the active site regulates human HTRA1 activity. Nat. Struct. Mol. Biol. 2011;18:386–388. - PubMed

Publication types

MeSH terms

Substances

LinkOut - more resources