. 2024 Nov 1:604:217263.
doi: 10.1016/j.canlet.2024.217263. Epub 2024 Sep 21.

Spliceosomal vulnerability of MYCN-amplified neuroblastoma is contingent on PRMT5-mediated regulation of epitranscriptomic and metabolomic pathways

Affiliations

Spliceosomal vulnerability of MYCN-amplified neuroblastoma is contingent on PRMT5-mediated regulation of epitranscriptomic and metabolomic pathways

Jodie Bojko et al. Cancer Lett. .

Abstract

Approximately 50 % of poor prognosis neuroblastomas arise due to MYCN over-expression. We previously demonstrated that MYCN and PRMT5 proteins interact and PRMT5 knockdown led to apoptosis of MYCN-amplified (MNA) neuroblastoma. Here we evaluate the highly selective first-in-class PRMT5 inhibitor GSK3203591 and its in vivo analogue GSK3326593 as targeted therapeutics for MNA neuroblastoma. Cell-line analyses show MYCN-dependent growth inhibition and apoptosis, with approximately 200-fold greater sensitivity of MNA neuroblastoma lines. RNA sequencing of three MNA neuroblastoma lines treated with GSK3203591 reveal deregulated MYCN transcriptional programmes and altered mRNA splicing, converging on key regulatory pathways such as DNA damage response, epitranscriptomics and cellular metabolism. Stable isotope labelling experiments in the same cell lines demonstrate that glutamine metabolism is impeded following GSK3203591 treatment, linking with disruption of the MLX/Mondo nutrient sensors via intron retention of MLX mRNA. Interestingly, glutaminase (GLS) protein decreases after GSK3203591 treatment despite unchanged transcript levels. We demonstrate that the RNA methyltransferase METTL3 and cognate reader YTHDF3 proteins are lowered following their mRNAs undergoing GSK3203591-induced splicing alterations, indicating epitranscriptomic regulation of GLS; accordingly, we observe decreases of GLS mRNA m6A methylation following GSK3203591 treatment, and decreased GLS protein following YTHDF3 knockdown. In vivo efficacy of GSK3326593 is confirmed by increased survival of Th-MYCN mice, with drug treatment triggering splicing events and protein decreases consistent with in vitro data. Together our study demonstrates the PRMT5-dependent spliceosomal vulnerability of MNA neuroblastoma and identifies the epitranscriptome and glutamine metabolism as critical determinants of this sensitivity.


Conflict of interest statement

Declaration of competing interest The authors declare that they have no known competing financial interests or personal relationships that could have appeared to influence the work reported in this paper.

Figures

Fig. 1
Fig. 1. MYCN amplified cells are preferentially sensitive to PRMT5 inhibition by GSK3203591.
[A] Incucyte Zoom live cell imaging of two MYCN amplified (MNA) neuroblastoma lines demonstrating dose-dependent growth inhibition following GSK3203591 treatment (n = 3, mean ± SD). [B] Imaging, as above, of two non-MNA neuroblastoma lines demonstrating no significant growth inhibition following GSK3203591 treatment (n = 3, mean ± SD) [C]. (Upper panel) GSK3203591 IC50 values for 7 MNA, 8 non-MNA and 3 non-cancerous cell lines (n = 3; mean ± SD, ND: not determined). (Lower panel) Box plot showing statistically significant mean IC50 ± SEM values of MNA vs non-MNA (*** = p < 0.0005, unpaired t-test). [D] Immunoblot of apoptotic markers, PRMT5, MYCN and E2F1 in cell extracts prepared from MNA (BE2C, IMR32, CHP-212) and non-MNA (SH-IN, GIMEN, SK-N-SH) neuroblastoma cell lines (n = 2). [E] Flow cytometry-based cell cycle analysis of two MNA (BE2C and LAN-1) and two non-MNA (SH-IN and SK-N-SH) cell lines, demonstrating increased sub-G1 apoptotic population and redistribution of the cell cycle (n = 3, mean ± SD, * = p < 0.05, ** = p < 0.005, *** = p < 0.0005, student’s one-tailed t-test).
Fig. 2
Fig. 2. MYCN expression sensitizes neuroblastoma cells to PRMT5 inhibition by GSK3203591.
[A]. The isogenic neuroblastoma line SHEP-21N, with tetra-cycline regulable MYCN expression, shows increased GSK3203591 sensitivity when MYCN is switched on (n = 3, mean ± SD, * = p < 0.05, unpaired t-test). [B] Clonogenic assay with SHEP-21N cells demonstrating MYCN-dependency for GSK3203591-mediated growth inhibition (n = 2). [C] Immunoblot analysis of cell extracts from SHEP-21N cells treated with GSK3203591 plus with (MYCN off) and without (MYCN on) tetracycline showing MYCN-dependent increases in apoptotic markers (n = 2). [D] Flow cytometry cell cycle analysis by DNA content (propidium iodide) in SHEP-21N cells treated with 5 μM GSK3203591 or DMSO equivalent incubated with (MYCN off) and without (MYCN on) tetracycline for 24–96 h time course (n = 2, mean ± SD, * = p < 0.05, ** = p < 0.005, *** = p < 0.0005, unpaired t-test). [E] Cell survival assay (MTT) of BE2C cells transfected with two different siRNA’s targeting MYCN or siNEG and incubated with increasing concentrations of GSK3203591 for 96 h (n = 3, mean ± SD). [F] Immunoblot analysis of cell extracts from SHEP-21N cells incubated with (MYCN off) and without (MYCN on) tetracycline showing MYCN-dependent increases in PRMT5 and SDMA (n = 3). [G] Immunoblot of cell extracts from Kelly cells transfected with siRNA targeting MYCN showing MYCN dependent PRMT5 and SDMA expression (n = 3).
Fig. 3
Fig. 3. RNA sequencing of GSK3203591-treated MNA neuroblastoma lines reveals down-regulation of MYCN-activated genes.
[A] Heatmaps of 315 differentially expressed genes (DEG, adjusted p < 0.05, ± 30 % change) shared by BE2C, Kelly and IMR32 cell-lines following GSK3203591 treatment (C, control(DMSO); G, GSK3203591). Associations with prognosis for all genes is indicated alongside (right), bars indicate high expression is associated with poor prognosis (red) or good prognosis (blue). Bonferroni-corrected p-values were calculated on the R2 Genomics Analysis and Visualization Platform (http://r2.amc.nl) using the SEQC dataset containing gene expression data from 498 neuroblastoma patients. RNAseq was performed using n = 2 biological replicates. [B] Kaplan Meier plots of gene signatures (metagenes) from genes upregulated following PRMT5 inhibition (DEG UP, top) or down-regulated (DEG DOWN, bottom) against overall survival. Note that high expression of DEG DOWN genes is strongly associated with poor survival. [C] GSEA analysis of GSK3203591-treated IMR32 cells demonstrating strong inhibition of MYCN-dependent gene sets. [D] Global summary of GSEA plots showing repression of MYC/MYCN and E2F gene sets (top) and other frequently altered gene ontology GSEAs affected by PRMT5 inhibition (bottom). NES, normalised enrichment score; FDR, false discovery rate.
Fig. 4
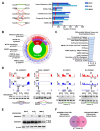
Fig. 4. PRMT5 inhibition in MYCN-amplified neuroblastoma cell lines leads to consistent and widespread alternative splicing.
[A] Numerical summary of alternative splicing events occurring in genes following PRMT5 inhibition in 3 MNA cell lines (BE2C, Kelly, IMR32) (right). Red lines on bar graph indicate the number of shared genes with alternative splicing events in the 3 cell lines, exact number displayed in brackets. Schematic (left) shows introns (green), exons (white) and splicing (red) (3′ASS, 3′alternative splice site; 5′ASS, 5′alternative splice site). [B] Sunburst plot generated in R2 (http://r2.amc.nl) showing, from inner to outer, correlation of MYCN amplification status (MNA/non-MNA), the MYCN-157 prognostic signature, MYCN transcription levels, PRMT5 transcription levels, differentially expressed downregulated genes following PRMT5 inhibition (PRMT5i), and differentially spliced genes (DSGs) following PRMT5i. Overlap probabilities are shown relative to the MYCN-157 signature. [C] Top 10 significantly enriched Reactome pathways in a combined list of differentially spliced genes and downregulated differentially expressed genes. [D] Representative sashimi plots (top) and end-point PCR validation (bottom, n = 3) of alternative splicing events occurring in genes that function in RNA splicing in BE2C, Kelly and IMR32 cells after GSK3203591 (IR, intron retention; SP, spliced product; CE, cassette exon; 5′ASS, 5′ alternative splice site; lines indicate splicing before (red) and after (blue) GSK3203591). [E] Immunoblot of cell extracts from BE2C, Kelly, IMR32 cells treated with GSK3203591 or DMSO equivalent (96h) showing decreased protein expression of hnRNPA1 (hnRNPA1B custom antibody preferentially targeting the + exon 8 isoform (top) and commercial antibody detecting total hnRNPA1 (bottom) (n = 3). [F] Venn diagram of differentially spliced genes in neuroblastoma cells transfected with siRNA targeting HNRNPA1/PTPB1 and differentially spliced genes shared by the 3 neuroblastoma cell lines following GSK3203591 treatment in this study.
Fig. 5
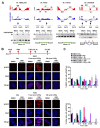
Fig. 5. GSK3203591 induced alternative splicing of DNA repair factors and increased irradiation induced DNA damage.
[A] Representative sashimi plots (top) and end-point PCR validation (bottom, n = 3) of alternative splicing events occurring in genes that function in DNA damage response and repair (TIMELESS, PAXX, TOP2A, DONSON) in BE2C, Kelly and IMR32 cells treated with GSK3203591 or DMSO equivalent (96h) (IR, intron retention; SP, spliced product; CE, cassette exon; lines indicate splicing before (red) and after (blue) GSK3203591). [B] Representative confocal microscopy images (Z-projections) of γH2AX (red) in BE2C (top, n = 3) and Kelly (bottom, n = 2) cells treated with GSK3203591 and irradiated (nuclear counterstain Hoechst, blue; 63× magnification, scale bar 5 μm). [C] Quantification of γH2AX foci per nucleus represented in B for BE2C (top, ≥125 cells counted from 3 experiments) and Kelly (bottom, ≥91 cells counted from 2 experiments) (mean ± SEM, unpaired t-test, * = p < 0.05).
Fig. 6
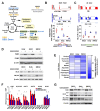
Fig. 6. PRMT5 inhibition by GSK3203591 impacts cellular fitness by downregulating glutamine metabolism regulators.
[A] Schematic diagram of glucose and glutamine metabolism highlighting differentially spliced genes (orange, DSG) and differentially expressed downregulated genes (blue, DEG Down) after GSK3203591 treatment. [B] Representative sashimi plot (top) and RT-qPCR validation (bottom) of PKM isoform expression (n = 3, mean ± SEM, unpaired t-test, * = p < 0.05, MXE = mutually exclusive exon). [C] Representative sashimi plot (top) and RT-qPCR validation (bottom) of intron retention of intron 5 in the MLX transcript after GSK3203591 treatment (n = 3, mean ± SEM, unpaired t-test, * = p < 0.05, *** = p < 0.0005, IR = intron retention) [D] Immunoblot of cell extracts from MNA cells treated with GSK3203591 showing PKM isoform switching from PKM2 to PKM1 (top) and downregulation of MLX and MLXIP expression (bottom) (n = 3). [E] Heatmap summarizing decreased glutamine incorporation into TCA cycle intermediates after GSK3203591 relative to control (data derived from n = 3 stable isotope labelling experiments). [F] RT-qPCR showing decreased expression of glutamine metabolism genes in MNA cell lines after GSK3203591 (n = 3, mean ± SEM, unpaired t-test * = p < 0.05, ** = p < 0.005, *** = p < 0.0005). [G] Immunoblot showing decreased expression of glutamine metabolism proteins after GSK3203591 (n = 3).
Fig. 7
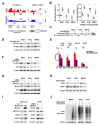
Fig. 7. PRMT5 inhibition downregulates epitranscriptome regulators and decreases translation efficiency.
[A] Representative sashimi plots of METTL3 intron retention of intron 8 and 9 (left) and YTHDF3 alternative 5′ splice site in exon 1 (right) after GSK3202591. [B] RT-qPCR showing increased intron retention of introns 8 and 9 in the METTL3 transcript (n = 3, paired t-test, * = p < 0.05, ** = p < 0.005). [C] End point PCR validation of alternative 5′ splice site in exon 1 of YTHDF3 from the non-canonical splice site (DMSO) to the canonical splice site (GSK3203591) (n = 3). [D] Immunoblot showing decreased expression of METTL3 and YTHDF3 in BE2C, Kelly and IMR32 cells after GSK3203591 (n = 3). [E] Methylated RNA immunoprecipitation (MeRIP) performed using anti-m6A antibody demonstrates decreased m6A on GLS and MYCN transcripts detected by RT-qPCR in BE2C cells. HRPT was used as a control. (n = 3, mean ± SEM, paired t-test, * = p < 0.05). [F] Immunoblot showing decreased expression of GLS following YTHDF3 knockdown (n = 3). [G] Immunoblot showing decreased expression of MYCN following METTL3 knockdown (n = 3). [H] Immunoblot showing decreased expression of RNA modifier proteins PUS7 and QTRT1 after GSK3203591 (n = 3). [I] Immunoblot of cell extracts of SHEP-21N incubated with (MYCN off) or without (MYCN on) tetracycline (left) and Kelly cells transfected with siRNA targeting MYCN (right) probing for RNA modifier proteins PUS7, QTRT1 and METTL3 (n = 3). [J] SunSET assay showing decreased protein translation after GSK3203591 (n = 2).
Fig. 8
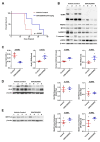
Fig. 8. In vivo inhibition of PRMT5 in the Th-MYCN mouse neuroblastoma model significantly increases survival.
[A] Kaplan-Meier showing survival of mice treated with GSK3326593 at 200 mg/kg (100 mg/kg twice a day) until maximum tumour burden was reached. Statistical significance for survival rates was determined using Log-rank (Mantel-Cox) test (control cohort n = 4; treated cohort n = 4). [B]. Immunoblot of protein extracts of mouse tumours showing inhibition of global SDMA in GSK3326593 treated tumours confirming on-target specificity of GSK3326593. [C] RT-qPCR of a selection of alternative splicing events first identified in vitro, using RNA extracted from Th-MYCN mouse tumours after PRMT5 inhibition (control cohort n = 4; treated cohort n = 4, unpaired t-test, exact p-value displayed). [D] Immunoblot of protein extracts of mouse tumours from control and GSK3326593 treated mice showing decreased GLS and CAD after GSK3326593 treatment (left). RT-qPCR (right) shows no significant change of Gls isoforms KGA/GAC mRNA (control cohort n = 4, treated cohort n = 4, unpaired t-test, exact p-value displayed). [E] Immunoblot (left) of protein extracts from mouse tumours showing decreased METTL3 protein after GSK3326593 treatment. RT-qPCR (right) demonstrating increased intron retention of intron 8 and 9 in the Mettl3 transcript (control cohort n = 4, treated cohort n = 4, unpaired t-test, exact p-value displayed).

References

    1. Maris JM, Hogarty MD, Bagatell R, Cohn SL. Neuroblastoma. Lancet. 2007;369(9579):2106–2120. - PubMed
    1. Huang M, Weiss WA. Neuroblastoma and MYCN. Cold Spring Harb Perspect Med. 2013;3(10):a014415. doi: 10.1101/cshperspect.a014415. - DOI - PMC - PubMed
    1. Valentijn LJ, Koster J, Zwijnenburg DA, Hasselt NE, van Sluis P, Volckmann R, et al. TERT rearrangements are frequent in neuroblastoma and identify aggressive tumors. Nat Genet. 2015;47(12):1411–1414. - PubMed
    1. Zimmerman MW, Liu Y, He S, Durbin AD, Abraham BJ, Easton J, et al. MYC drives a subset of high-risk pediatric neuroblastomas and is activated through mechanisms including enhancer hijacking and focal enhancer amplification. Cancer Discov. 2018;8(3):320–335. doi: 10.1158/2159-8290.CD-17-0993. - DOI - PMC - PubMed
    1. Park JH, Szemes M, Vieira GC, Melegh Z, Malik S, Heesom KJ, et al. Protein arginine methyltransferase 5 is a key regulator of the MYCN oncoprotein in neuroblastoma cells. Mol Oncol. 2015;9(3):617–627. doi: 10.1016/j.molonc.2014.10.015. - DOI - PMC - PubMed

MeSH terms