

Comparing 24-hour IOP fluctuation slope curve between newly diagnosed ocular hypertension and primary open-angle glaucoma
- PMID: 39313295
- PMCID: PMC11418482
- DOI: 10.1136/bmjophth-2024-001821
Comparing 24-hour IOP fluctuation slope curve between newly diagnosed ocular hypertension and primary open-angle glaucoma
Abstract
Objective: To compare the 24-hour intraocular pressure (IOP) fluctuation slope curve between newly diagnosed patients with ocular hypertension (OHT) and primary open-angle glaucoma (POAG).
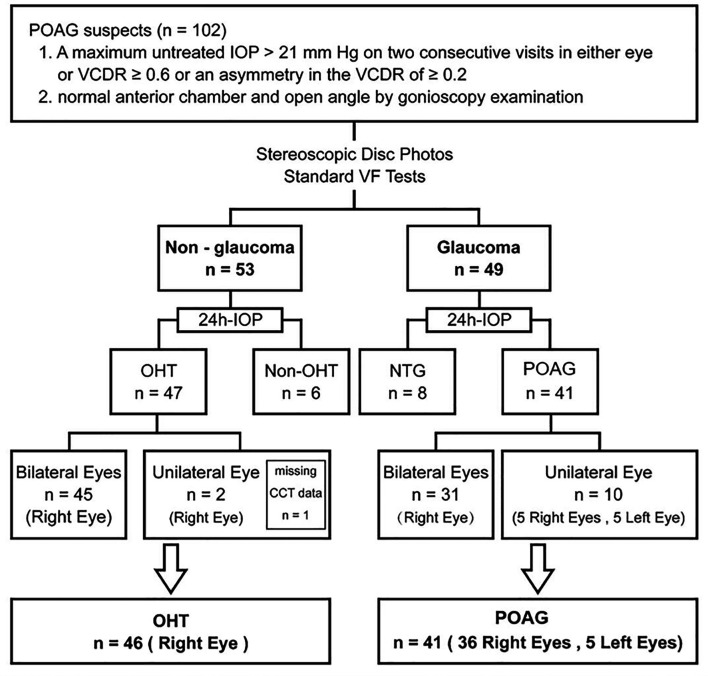
Methods and analysis: Newly diagnosed and untreated OHT and POAG patients who underwent 24-hour IOP monitoring were consecutively enrolled in the study. IOP measurements were taken every 2 hours from 8:00 to 6:00 hours the following day using an iCare PRO tonometer. Patients maintained their daily routines, with IOP measured in a seated position during the day and supine at night. The 24-hour IOP fluctuation indices, including peak, trough and overall fluctuation, were calculated. Differences in the 24-hour IOP fluctuation slope curves over time between groups were analysed using a generalised additive mixed model.
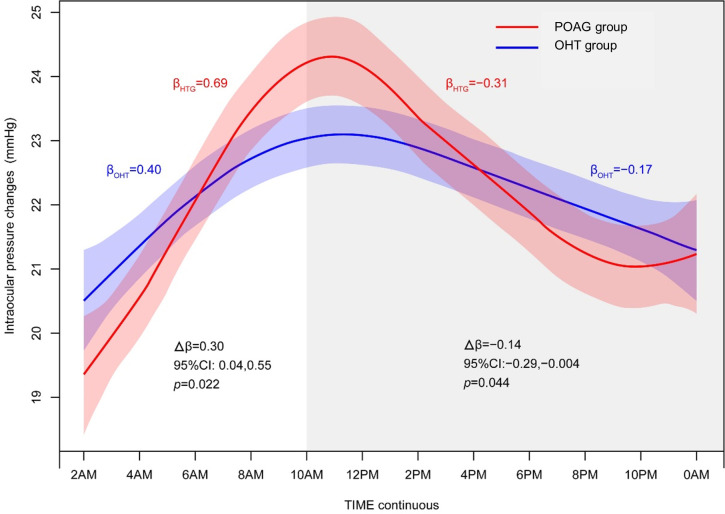
Results: 46 patients with OHT and 41 with POAG were included. From 2:00 to 10:00 hours, mean IOP increased by 0.69 mm Hg every 2 hours in the POAG group (p<0.0001) and by 0.40 mm Hg in the OHT group (p<0.0001). After 10:00, the IOP showed a downward trend, decreasing by 0.31 mm Hg in the POAG group (p<0.0001) and by 0.17 mm Hg in the OHT group (p=0.0003) every 2 hours. The rate of slope change in the upward phase differed significantly between the groups (0.30 mm Hg per 2 hours; p=0.02), as did the rate in the downward phase (0.14 mm Hg per 2 hours; p for interaction=0.04). Multivariate models showed that each 1 mm Hg increase in circadian and diurnal IOP fluctuation was associated with a 27% and 21% higher likelihood of POAG presence, respectively.
Conclusion: The 24-hour IOP slope curve differed between POAG and OHT, with a steeper slope observed in the POAG group. However, the study is limited by potential confounding factors, reliance on a single 24-hour measurement period and the need for further longitudinal studies to validate these findings.
Keywords: Glaucoma; Intraocular pressure; Ocular Hypertension.
© Author(s) (or their employer(s)) 2024. Re-use permitted under CC BY-NC. No commercial re-use. See rights and permissions. Published by BMJ.
Conflict of interest statement
Competing interests: None declared.
Figures
References
-
- Kass MA, Heuer DK, Higginbotham EJ, et al. Assessment of Cumulative Incidence and Severity of Primary Open-Angle Glaucoma Among Participants in the Ocular Hypertension Treatment Study After 20 Years of Follow-up. JAMA Ophthalmol . 2021;139:1–9. doi: 10.1001/jamaophthalmol.2021.0341. - DOI - PMC - PubMed
Publication types
MeSH terms
LinkOut - more resources
Full Text Sources