. 2024 Nov 13;44(46):e0844242024.
doi: 10.1523/JNEUROSCI.0844-24.2024.

A Prefrontal→Periaqueductal Gray Pathway Differentially Engages Autonomic, Hormonal, and Behavioral Features of the Stress-Coping Response

Affiliations

A Prefrontal→Periaqueductal Gray Pathway Differentially Engages Autonomic, Hormonal, and Behavioral Features of the Stress-Coping Response

Timothy D Skog et al. J Neurosci. .

Abstract

The activation of autonomic and hypothalamo-pituitary-adrenal (HPA) systems occurs interdependently with behavioral adjustments under varying environmental demands. Nevertheless, laboratory rodent studies examining the neural bases of stress responses have generally attributed increments in these systems to be monolithic, regardless of whether an active or passive coping strategy is employed. Using the shock probe defensive burying test (SPDB) to measure stress-coping features naturalistically in male and female rats, we identify a neural pathway whereby activity changes may promote distinctive response patterns of hemodynamic and HPA indices typifying active and passive coping phenotypes. Optogenetic excitation of the rostral medial prefrontal cortex (mPFC) input to the ventrolateral periaqueductal gray (vlPAG) decreased passive behavior (immobility), attenuated the glucocorticoid hormone response, but did not prevent arterial pressure and heart rate increases associated with rats' active behavioral (defensive burying) engagement during the SPDB. In contrast, inhibition of the same pathway increased behavioral immobility and attenuated hemodynamic output but did not affect glucocorticoid increases. Further analyses confirmed that hemodynamic increments occurred preferentially during active behaviors and decrements during immobility epochs, whereas pathway manipulations, regardless of the directionality of effect, weakened these correlational relationships. Finally, neuroanatomical evidence indicated that the influence of the rostral mPFC→vlPAG pathway on coping response patterns is mediated predominantly through GABAergic neurons within vlPAG. These data highlight the importance of this prefrontal→midbrain connection in organizing stress-coping responses and in coordinating bodily systems with behavioral output for adaptation to aversive experiences.

Keywords: HPA axis; cardiovascular; neural circuit; periaqueductal gray; prelimbic cortex; shock probe defensive burying test.


Conflict of interest statement

The authors declare no competing financial interests.

Figures

Figure 1.
Figure 1.
Injection and spread of virus and optic placements for each group. Coronal sections depict virus injection and spread in both rPL and vlPAG, as well as optic placement above vlPAG for rPL→vlPAGControl, rPL→vlPAGHalo, and rPL→vlPAGChR2 subjects. Female subjects are depicted by blue outline and males by red outline. AP, anterior-posterior; IL, infralimbic cortex; mOFC, medial orbitofrontal cortex; PL, prelimbic cortex.
Figure 2.
Figure 2.
The prefrontal→ventrolateral periaqueductal gray (vlPAG) pathway modulates behavioral and hemodynamic stress-coping responses in the shock probe defensive burying test (SPDB). A, Diagrams illustrating the relative positions of injections in the rostral prelimbic cortex (rPL) and vlPAG and optical fibers implanted over the vlPAG (top),and illustration of SPDB (bottom). B, Top row, Example of viral expression in rPL neurons colocalized with GFP + viral retro-Cre-expressing cells. I-VI, cortical laminae; MO, medial orbitofrontal cortex. Bottom row, Injection of retro-Cre-GFP virus in the vlPAG reveals local expression of GFP and innervation from mCherry + rPL projections within this region. The dashed line (right) indicates the position of the optic fiber for laser delivery to mCherry + terminals in the vlPAG. ca, cerebral aqueduct. C, Neural inhibition (rPL→vlPAGHalo) decreased mean arterial pressure (MAP) in the latter half of the observation period, postshock. D, Integrated area under the curve (AUC) analysis for MAP averaged over the 10 min postshock period shows significant decreases in the rPL→vlPAGHalo group compared with the rPL→vlPAGControl group. E, Silencing of rPL projections decreased heart rate (HR) during the observation period. F, Integrated AUC analysis shows decreased HR in the rPL→vlPAGHalo group compared with the rPL→vlPAGControl group. G, Neural inhibition (rPL→vlPAGHalo) significantly increased immobility (Immob.). Pathway activation (rPL→vlPAGChR2) significantly increased rearing (Rear). Bury, defensive burying; Ambul., ambulation. H, Time series of immobility in the SPDB, expressed as total percentage of time rats were immobile during each minute. rPL→vlPAGControl, N = 13 (8 male, 5 female); rPL→vlPAGHalo (N = 9; 5 male, 4 female); rPL→vlPAGChR2 (N = 8; 5 male, 3 female). All data are presented as mean ± SEM. In D, F, and G, open circles indicate male rats, and open triangles indicate female rats. *p < 0.05 relative to the rPL→vlPAGControl group.
Figure 3.
Figure 3.
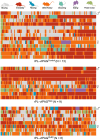
Behavior in the SPDB is variable throughout the 10 min observation period. Ethograms depicting various behaviors employed by individual rats over the 10 min observation period following shock in the SPDB. Rows represent individual rats (grouped by optogenetic manipulation). Each color block indicates the behavior the rat is displaying during that 5 s epoch. Note that the category “Other/ Ambul.” does not differentiate between rats’ ambulating in the chamber from other nonambulatory behaviors that do not fit in the other categories.
Figure 4.
Figure 4.
Optogenetic manipulation of the rPL→vlPAG pathway does not affect other behaviors in SPDB or locomotor activity in an open field. A–C, No differences were observed as a function of optogenetic manipulation in latency to shock, probe investigation, or eating in the SPDB. Open circles represent male rats while open triangles represent females. rPL→vlPAGControl, N = 13 (8 male, 5 female); rPL→vlPAGHalo (N = 9; 5 male, 4 female); rPL→vlPAGChR2 (N = 8; 5 male, 3 female). All data are presented as mean ± SEM. D, E, Distance traveled and velocity in rats tested in an open field were not significantly different as a function of optogenetic stimulation of the rPL→vlPAG pathway. All groups were observed during 3 min laser-on and 3 min laser-off epochs, with “on/ off” periods counterbalanced within each group. rPL→vlPAGControl, N = 7; rPL→vlPAGHalo, N = 10; rPL→vlPAGChR2, N = 9 (all male).
Figure 5.
Figure 5.
Optogenetic manipulation of the rPL→vlPAG pathway phasically modulates immobility in the SPDB. A, Photoactivation and inhibition selectively decreased and increased, respectively, immobility. B–E, No differences were observed in other as a function of optogenetic manipulation in burying (B), ambulation (C), rearing (D), or probe investigation (E). Data are presented as mean ± SEM. rPL→vlPAGControl, N = 8; rPL→vlPAGChR2,N = 8; rPL→vlPAGHalo, N = 10 (all male). *p < 0.05 relative to each group's initial laser-off epoch. p < 0.05 relative to the rPL→vlPAGControl group during the laser-on epoch.
Figure 6.
Figure 6.
Correlation between hemodynamic indices and defensive behaviors upon optogenetic manipulation of the rPL→vlPAG pathway. A–D, Correlation analyses reveal a strong relationship between MAP/HR, and Immobility/Burying in the rPL→vlPAG pathway. Photoinhibition (rPL→vlPAGHalo) disrupted the relationship between immobility and HR (B), whereas both inhibition and excitation disruption the relationship between burying and MAP (C).
Figure 7.
Figure 7.
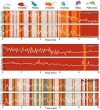
Ethograms combined with MAP and HR data illustrate the relationship between behavioral and hemodynamic indices in the SPDB. Ethograms depicting various behaviors employed by individual rats over the 10 min observation period following shock in the SPDB. Rows represent individual rats (grouped by optogenetic manipulation). Each color block indicates the behavior the rat is displaying during that 5 s epoch. MAP and HR changes (collapsed into 5 s bins to align with behavior) are overlaid on each ethogram. In the rPL→vlPAGControl group, MAP and HR tend to increase during defensive burying and decrease during immobility epochs, as evidenced by respectively strong correlations. In contrast, the rPL→vlPAGHalo and rPL→vlPAGChR2 groups exhibited a less strong correlation between behavioral and hemodynamic indices.
Figure 8.
Figure 8.
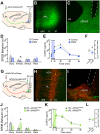
rPL→vlPAG pathway excitation attenuates immobility and HPA output in the SPDB. A, Diagram of viral injection of ChR2 in the rPL and optical fibers implanted over the vlPAG. B, Viral expression of eYFP in rPL neurons. I-VI, cortical laminae; MO, medial orbitofrontal cortex. C, Expression of rPL axonal fibers is shown in the vlPAG. Dashed line indicates the position of the optical fiber. ca, cerebral aqueduct. D, Stimulation of the rPL axonal projections to the vlPAG significantly decreased immobility (data are presented as mean ± SEM). E, Photoactivation during SPDB (shaded in blue) decreased corticosterone (CORT) output following the SPDB. rPL→vlPAGControl, N = 10; rPL→vlPAGChR2, N = 10. F, Integrated AUC analysis indicates that ChR2 stimulation significantly decreased CORT output during and after SPDB. rPL→vlPAGControl, N = 10; rPL→vlPAGChR2, N = 13. G, Diagram illustrating rPL, vlPAG, and optical fibers implanted over vlPAG. H, Viral expression in PL neurons colocalized with GFP + viral retro-Cre-expressing cells. I-VI, cortical laminae; ACd, anterior cingulate cortex, dorsal subdivision. I, Injection of retro-Cre-GFP virus in the vlPAG and mCherry + rPL projection terminal expression in the vlPAG. Dashed line indicates the position of the optical fiber for laser delivery to mCherry + terminals in the vlPAG. ca, cerebral aqueduct. J, Neural silencing increased immobility during the SPDB. K, L, Photoinhibition (shaded in green) did not alter HPA activity during or following the SPDB. All data are presented as mean ± SEM. rPL→vlPAGControl, N = 11; rPL→vlPAGHalo, N = 11. *p < 0.05.
Figure 9.
Figure 9.
Anatomical evidence that rPL neurons impart stress coping influences over vlPAG predominantly by projecting to GABAergic neurons. A, Diagram illustrating the relative position of injection of transneuronal AAV2/1 containing Cre in the rPL and Cre-dependent AAV5-mCherry in the vlPAG. This approach enables mCherry expression in vlPAG neurons that receive projections from the rPL. B, C, Expression of mCherry (red) predominated in (B) Vgat + (green) versus (C) Vglut2+ (blue) neurons, suggesting that rPL axons preferentially target GABAergic and not glutamatergic neurons. D, Colocalization of Vgat occurred in 86% of mCherry + neurons, while Vglut2 colocalized with 14% of mCherry + neurons. Data are presented as mean ± SEM. 4 cases, 308 mCherry + neurons. *p < 0.05.

References

    1. An X, Bandler R, Ongur D, Price JL (1998) Prefrontal cortical projections to longitudinal columns in the midbrain periaqueductal gray in macaque monkeys. J Comp Neurol 401:455–479. 10.1002/(SICI)1096-9861(19981130)401:4<455::AID-CNE3>3.0.CO;2-6 - DOI - PubMed
    1. Arnsten AF, Paspalas CD, Gamo NJ, Yang Y, Wang M (2010) Dynamic network connectivity: a new form of neuroplasticity. Trends Cogn Sci 14:365–375. 10.1016/j.tics.2010.05.003 - DOI - PMC - PubMed
    1. Assareh N, Sarrami M, Carrive P, McNally GP (2016) The organization of defensive behavior elicited by optogenetic excitation of rat lateral or ventrolateral periaqueductal gray. Behav Neurosci 130:406–414. 10.1037/bne0000151 - DOI - PubMed
    1. Bandler R, Keay KA, Floyd N, Price J (2000) Central circuits mediating patterned autonomic activity during active versus passive emotional coping. Brain Res Bull 53:95–104. 10.1016/S0361-9230(00)00313-0 - DOI - PubMed
    1. Bechara A, Tranel D, Damasio H, Damasio AR (1996) Failure to respond autonomically to anticipated future outcomes following damage to prefrontal cortex. Cereb Cortex 6:215–225. 10.1093/cercor/6.2.215 - DOI - PubMed

MeSH terms

LinkOut - more resources