. 2024 Sep 23;15(1):8203.
doi: 10.1038/s41467-024-52500-5.

Glypican-3-targeted macrophages delivering drug-loaded exosomes offer efficient cytotherapy in mouse models of solid tumours

Affiliations

Glypican-3-targeted macrophages delivering drug-loaded exosomes offer efficient cytotherapy in mouse models of solid tumours

Jinhu Liu et al. Nat Commun. .

Abstract

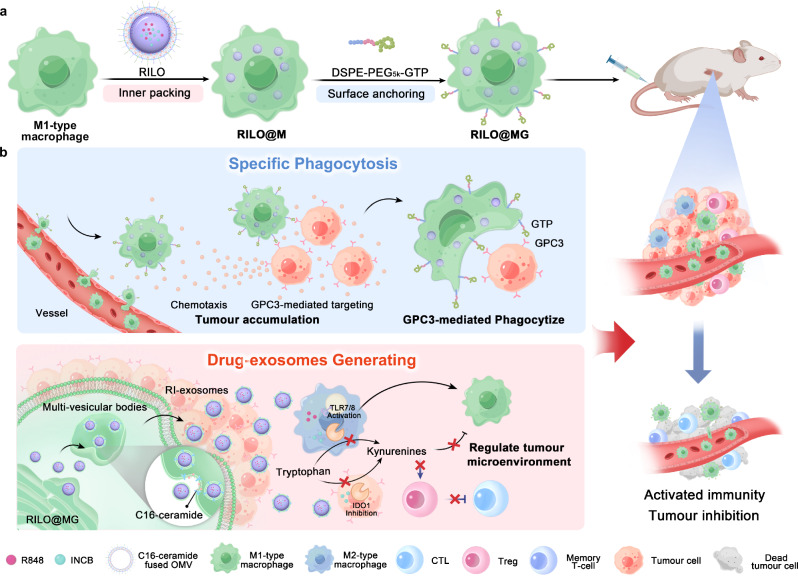
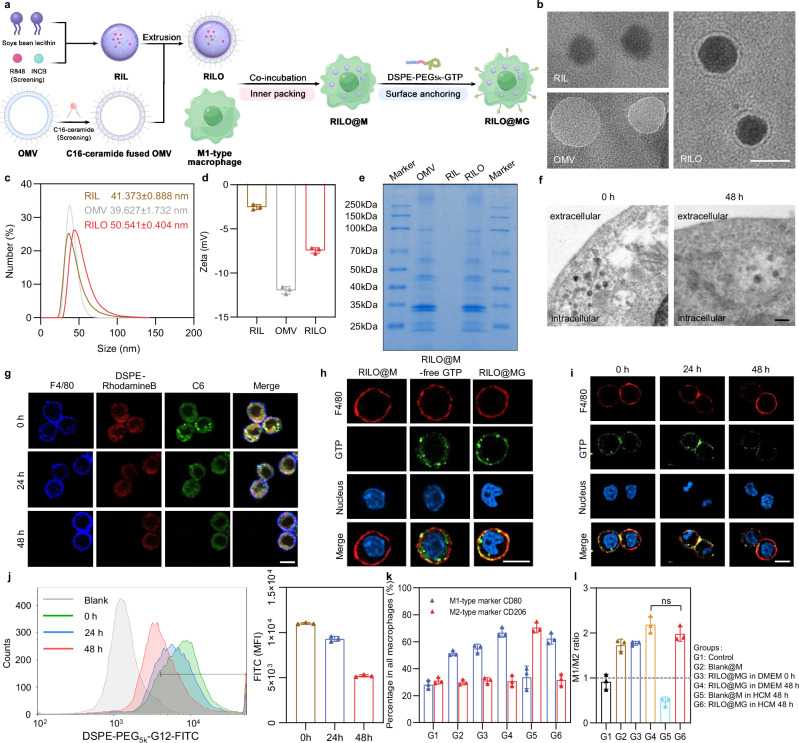
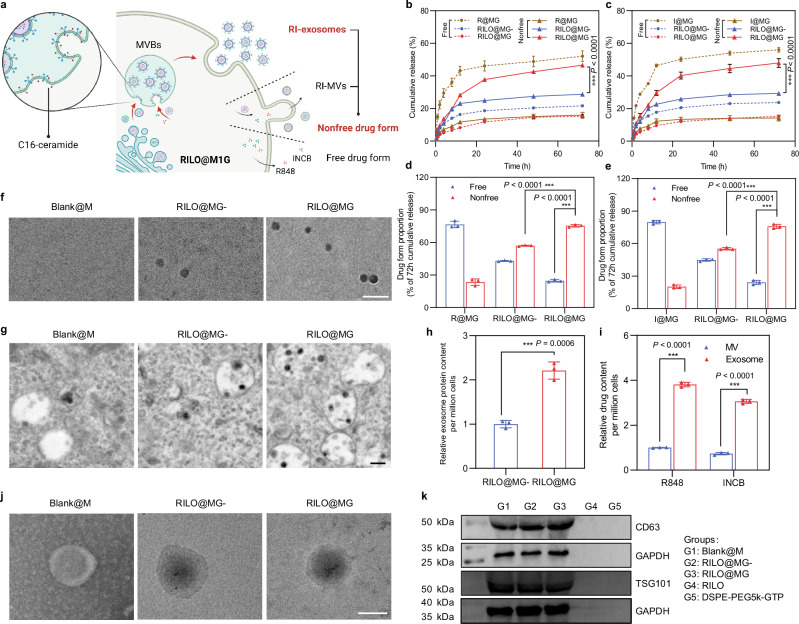
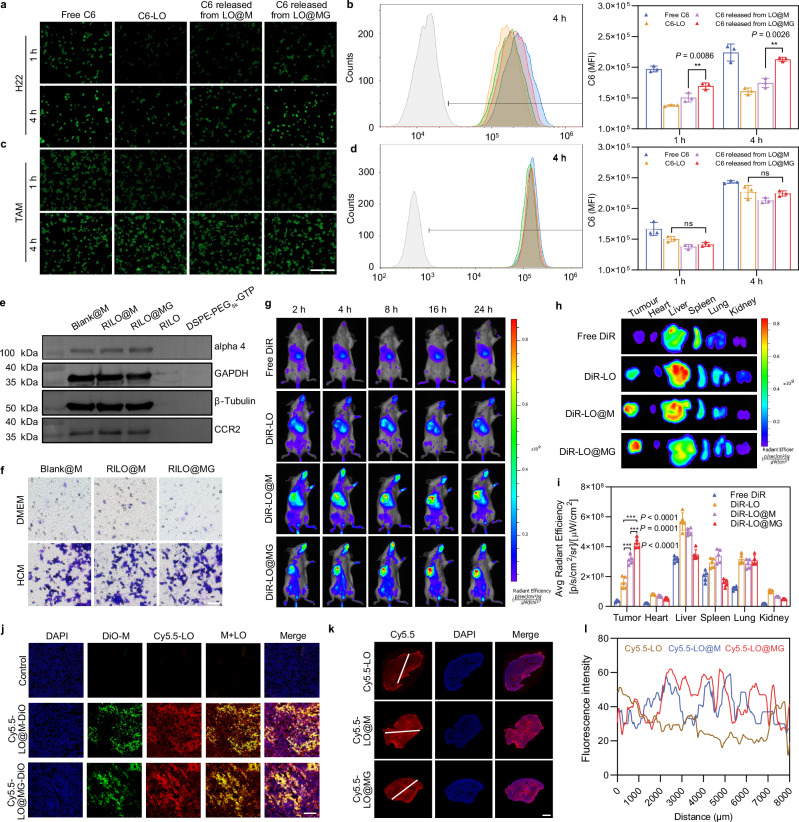
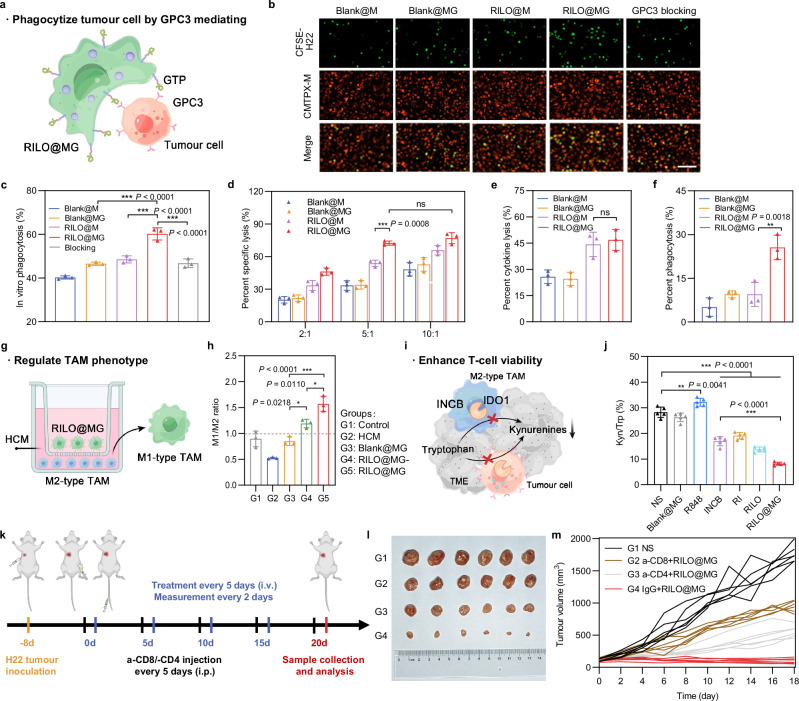
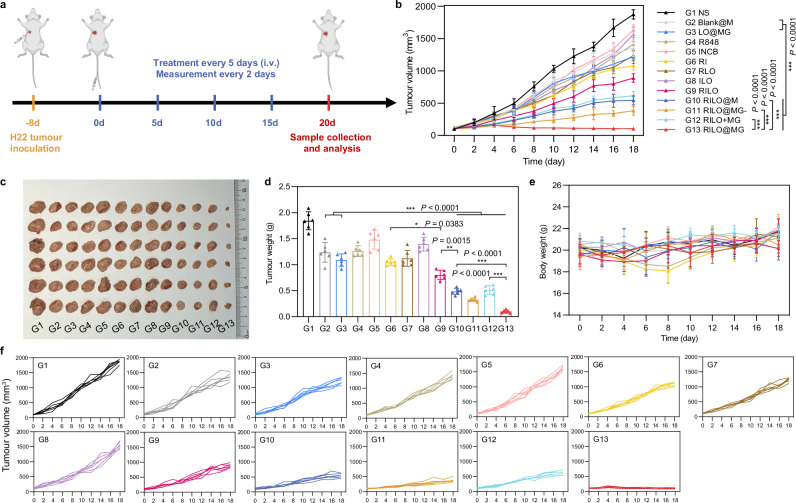
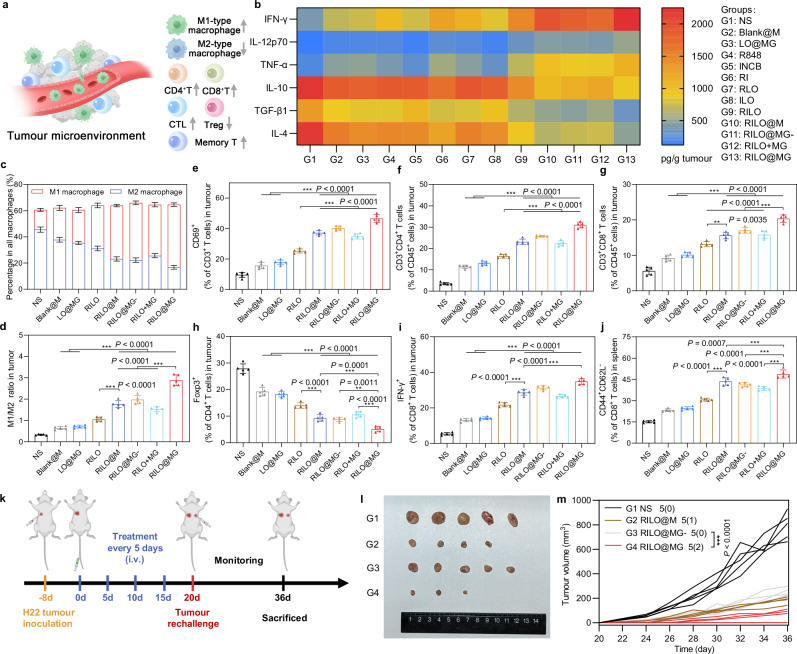
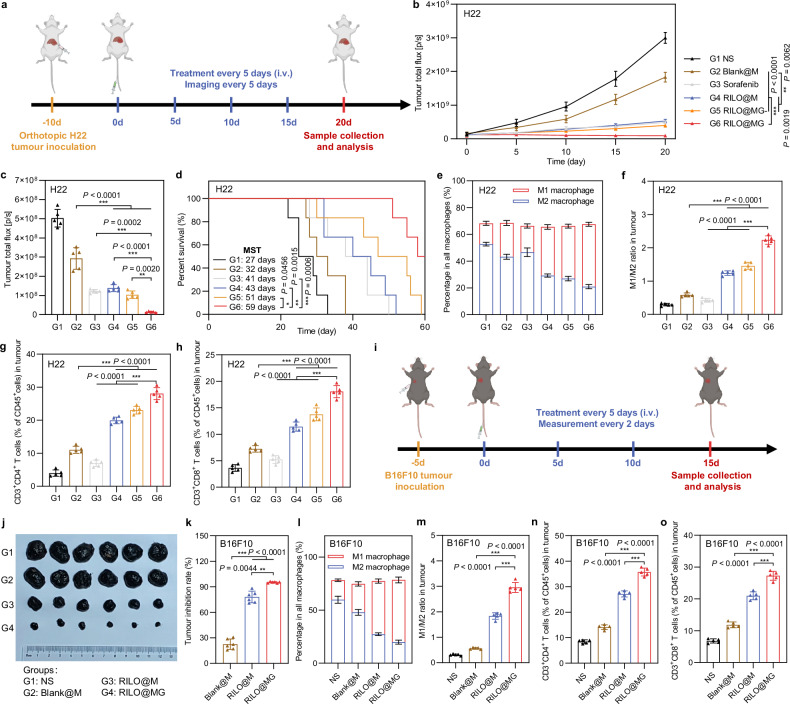
Cytotherapy is a strategy to deliver modified cells to a diseased tissue, but targeting solid tumours remains challenging. Here we design macrophages, harbouring a surface glypican-3-targeting peptide and carrying a cargo to combat solid tumours. The anchored targeting peptide facilitates tumour cell recognition by the engineered macrophages, thus enhancing specific targeting and phagocytosis of tumour cells expressing glypican-3. These macrophages carry a cargo of the TLR7/TLR8 agonist R848 and INCB024360, a selective indoleamine 2,3-dioxygenase 1 (IDO1) inhibitor, wrapped in C16-ceramide-fused outer membrane vesicles (OMV) of Escherichia coli origin (RILO). The OMVs facilitate internalization through caveolin-mediated endocytosis, and to maintain a suitable nanostructure, C16-ceramide induces membrane invagination and exosome generation, leading to the release of cargo-packed RILOs through exosomes. RILO-loaded macrophages exert therapeutic efficacy in mice bearing H22 hepatocellular carcinomas, which express high levels of glypican-3. Overall, we lay down the proof of principle for a cytotherapeutic strategy to target solid tumours and could complement conventional treatment.


Conflict of interest statement

The authors declare no competing interests.

Figures

Fig. 1
Fig. 1. Schematic illustration of RILO@MG promoting specific tumour phagocytosis and generating drug exosomes that play a role in triggering an antitumour immune response to combat solid tumour.
a Preparation of RILO@MG. First, RILO@M was prepared by the inner packing of M1-type macrophages and RILO. Then, DSPE-PEG5k-GTP was anchored on the surface of RILO@M to prepare RILO@MG. b RILO@MG accumulated in the tumour site through chemotaxis and GPC3-mediated targeting after i.v. administration directly killed tumour cells by GPC3-mediated phagocytosis and generated RI-exosomes containing R848 and INCB to regulate the TAM phenotype and enhance T-cell viability. Therefore, RILO@MG exerted antitumour efficacy by directly killing tumour cells and reversing the suppressive TME. CTL cytotoxic T-cell.
Fig. 2
Fig. 2. RILO maintains a stable nanostructure in macrophages and RILO@MG maintains the M1 phenotype in an immunosuppressed environment.
a Schematic illustration of the preparation process of RILO@MG. b Micromorphological characterizations of RIL, OMV and RILO (n = 3 biologically independent experiments). Scale bar, 50 nm. c, d Dynamic light scattering (c) and zeta potential (d) analyses of RIL, OMV and RILO (n = 3 biologically independent experiments). e SDS–PAGE protein analysis in OMV, RIL and RILO (n = 3 biologically independent experiments). f TEM images of RILO@M at 0 and 48 h after preparation (n = 3 biologically independent experiments). Scale bar, 200 nm. g Representative confocal images showing the stability of the nanostructure of fluorescently labelled RILO in M1-type macrophages from RAW264.7 cells (M1-type macrophagesRAW) (n = 3 biologically independent experiments). The cell membrane was stained with anti-F4/80 antibody (blue). DSPE-Rhodamine B and C6 were selected to label lipids (red) and replace the drug (green), respectively. Scale bar, 10 µm. h Representative confocal images of RILO@M, RILO@M-free GTP and RILO@MG (n = 3 biologically independent experiments). Scale bar, 10 µm. RAW264.7 cells were used in (h). i, j Representative confocal images (i) and flow cytometric analysis (j) of RILO@MGRAW after preparation for 24 and 48 h (n = 3 biologically independent experiments). Scale bar, 10 µm. FITC was selected to label GTP in (hj). All cells were stained with anti-F4/80 antibody (red) and Hoechst 33342 (blue) in (h and i). k, l Phenotype analysis of RILO@MG including the percentage of macrophages with different phenotypes (k) and M1/M2 ratio (l) in different culture environments (n = 3 biologically independent experiments). Data are expressed as the mean ± SD and were processed by one-way analysis of variance (ANOVA) with Tukey’s multiple comparisons test (l). ns no significance. BMDMs were used in all experiments involving macrophages unless marked RAW superscript.
Fig. 3
Fig. 3. RILOs are released from RILO@MG in the form of RI-exosomes.
a Schematic illustration of regulating the release form of the RILOs packed in RILO@MG. b–e Release profiles during 72 h for R848 (b) or INCB (c) and the proportion of cumulative release at 72 h for R848 (d) or INCB (e) of free drug form or nonfree drug form from different groups, respectively (n = 3 biologically independent experiments). f Representative TEM analyses about released media from Blank@M, RILO@MG- and RILO@MG groups at 24 h after preparation (n = 3 biologically independent experiments). Scale bar, 200 nm. g Representative TEM images showed increasing MVBs and ILVs formation containing RILO in RILO@MG with the help of C16-ceramide (n = 3 biologically independent experiments). Scale bar, 200 nm. h The relative released exosome protein content 24 h after RILO@MG- and RILO@MG were prepared (n = 3 biologically independent experiments). i R848 and INCB content encapsulated in exosomes or MVs by RILO@MG as measured by HPLC, indicating that the drugs were mostly contained in exosomes, not MVs (n = 3 biologically independent experiments). j TEM images of exosomes from Blank@M and RI-exosomes from RILO@MG- and RILO@MG (n = 3 biologically independent experiments). Scale bar, 50 nm. k Detection of exosome markers (CD63 and TSG101) of released exosomes from different groups by western blotting (n = 3 biologically independent experiments). Data are expressed as the mean ± SD. Two-tailed Student’s t-test (d, e, h, i) or two-way ANOVA with Tukey’s multiple comparisons test (b, c) was carried out for statistical analysis. *P < 0.05; ***P < 0.001. BMDMs were used in all experiments involving macrophages.
Fig. 4
Fig. 4. The tumour accumulation and deep penetration capabilities of RILO@MG.
a, b Fluorescence microscopy images (a) and flow cytometric analysis (b) of the uptake by H22 cells at the same concentration (200 ng/mL) of C6 (n = 3 biologically independent experiments). c, d Fluorescence microscopy images (c) and flow cytometric analysis (d) of the uptake by TAMRAW at the same concentration (200 ng/mL) of C6 (n = 3 biologically independent experiments). The drug was replaced by C6 (green) in (a–d). Scale bar = 200 μm in (ad). e Detection of chemotaxis-associated proteins (alpha 4 and CCR2) by western blotting (n = 3 biologically independent experiments). f Tumour-migrating capability was evaluated by Transwell assay in vitro (n = 3 biologically independent experiments). Representative microscopy images of migrating Blank@M, RILO@M and RILO@MG after incubation for 16 h. Scale bar = 200 μm. g–i In vivo images (g) of biodistribution in the H22 tumour-bearing mouse model after treatment with different formulations (i.v.). Ex vivo images (h) and average radiant efficiency (i) of tumours and main organs at 24 h (n = 5 biologically independent animals per group). DiR was a near-infra-red tracer in (g–i). j Representative confocal images of the H22 tumour tissue sections after i.v. administration at 24 h, which indicated that injected M1-type macrophages could release drugs at the tumour site (n = 3 biologically independent experiments). DiO and Cy5.5 were selected to label injected M1-type macrophages (green) and replace the drug (red), respectively. Scale bar: 100 μm. k, l Penetration overviews (k) of the whole H22 tumour tissue sections after i.v. administration at 24 h (n = 3 biologically independent experiments). The fluorescence intensity of the white line marked region was quantified with ImageJ (l). Cy5.5 was selected to replace the drug (red). Scale bar, 2 mm. Data are expressed as the mean ± SD and were processed by one-way ANOVA with Tukey’s multiple comparisons test (b, d, i). **P < 0.01; ***P < 0.001; ns, no significance. BMDMs were used in all experiments involving macrophages unless marked RAW superscript.
Fig. 5
Fig. 5. RILO@MG promotes antitumour immunity by specifically phagocytizing tumour cells, regulating the TAM phenotype and enhancing T-cell viability.
a Schematic illustration of RILO@MG phagocytizing H22 cells mediated by GPC3 and GTP. b, Fluorescence microscopy images of different formulations after coculture with H22 cells for 4 h (E:T = 2:1). Scale bar = 100 μm. E:T, effector cell (different formulations prepared using M1-type macrophage) to target cell (H22 cell) ratio. c Anchoring of GTP on RILO@MG promoted the phagocytosis of H22 cells (n = 3 biologically independent experiments). Different formulations were cocultured with H22 cells for 4 h (E:T = 1:1) and evaluated by flow cytometric analysis. d Specific lysis of H22 cells after coculture for 12 h at different E:T ratios measured by CCK-8 assay (n = 3 biologically independent experiments). e, f Percent cytokine lysis (e) and phagocytosis lysis (f) of H22 cells after coculture with different formulations for 12 h (E:T = 5:1) by using Transwell plates (pore size 0.4 μm) (n = 3 biologically independent experiments). g Experimental process for promoting the polarization from M2 phenotype to M1 phenotype. h Phenotype analysis of TAMs after coculture with different formulations in HCM for 24 h (n = 3 biologically independent experiments). i Schematic illustration of RILO@MG enhancing T cells by inhibiting the production of Kyn. j IDO1 activity was evaluated according to the percentage of Kyn/Trp within tumours (n = 5 biologically independent animals per group). k Regimen of the antitumour experiment after removal of CD4+ or CD8+ T cells. l, m Photographs of tumours (l) and individual tumour growth curves (m) showed the critical role of T cells in antitumour immunity mediated by RILO@MG (n = 6 biologically independent animals per group). Data are expressed as the mean ± SD and were processed by one-way ANOVA with Tukey’s multiple comparisons test (c, e, f, h, j) or two-way ANOVA with Tukey’s multiple comparisons test (d). *P < 0.05; **P < 0.01; ***P < 0.001; ns no significance. BMDMs were used in all experiments involving macrophages.
Fig. 6
Fig. 6. The antitumour activity of RILO@MG in an H22 tumour-bearing mouse model.
a Regimen of i.v. administration in H22 tumour-bearing mice (at a dosage of 3.0 × 106 cells per mouse per injection, equal to 4 mg/kg R848 and 3.4 mg/kg INCB). Mice requiring injected formulations made by M1-type macrophages each received the equivalent number of cells (3.0 × 106 cells per mouse). Mice requiring injection of other formulations each received the equivalent dose of medicine (4 mg/kg R848 and 3.4 mg/kg INCB). When the tumour volumes reached ~2000 mm3, the mice were euthanized by CO2. b–f Average tumour growth curves (b), tumour photographs (c), tumour weights (d), body weight changes (e) and individual tumour growth curves (f) of H22 tumour-bearing mice receiving the indicated treatments (n = 6 biologically independent animals per group). Data are expressed as the mean ± SD. One-way ANOVA with Tukey’s multiple comparisons test (d) or two-way ANOVA with repeated measures (b) was used for statistical analysis. *P < 0.05; **P < 0.005; ***P < 0.001. BMDMs were used in all experiments involving macrophages.
Fig. 7
Fig. 7. The RILO@MG regulates TAM phenotype and enhances T-cell viability to remodel the suppressive TME in an H22 tumour-bearing mouse model.
a Schematic diagram of the regulatory effect of RILO@MG on the immunosuppressive TME, indicating an increase about immune-active cells and a decrease in the proportion of immune-suppressing cells within the TME. b H22 tumour-bearing mice were treated as in Fig. 6a. The intratumoural levels of cytokines were quantified using ELISA analysis at the study endpoint. c–i H22 tumour-bearing mice were treated as in Fig. 6a. Flow cytometric analysis of M1-type macrophage and M2-type macrophage (c, d), CD69+ T cells (e), CD4+ T cells (f), CD8+ T cells (g), CD4+Foxp3+ T cells (h), and CD8+IFN-γ+ T cells (i) within the TME. j Flow cytometric analysis quantification of effector memory (CD44+CD62L-) CD8+ T cells in spleens. k Experimental timeline of rechallenged tumour model establishment. l Secondary tumour photographs of the sacrificed mice at the study endpoint. m Rechallenged tumour growth curves of tumour-bearing mice were monitored over time. The dosage regimen of all data in Fig. 7 was the same as that shown in Fig. 6a. Data are expressed as the mean ± SD with five biologically independent animals per group and were processed by one-way ANOVA with Tukey’s multiple comparisons test (c–j) or two-way ANOVA with repeated measures (m). **P < 0.01; ***P < 0.001. BMDMs were used in all experiments involving macrophages.
Fig. 8
Fig. 8. Efficacy validation of RILO@MG in the orthotopic H22 tumour model and B16F10 tumour-bearing mouse model.
a Schematic of the orthotopic H22 tumour model experiment (dose of 3.0 × 106 cells per mouse per injection, equal to 4 mg/kg R848 and 3.4 mg/kg INCB; sorafenib: 10 mg/kg). b–d In vivo bioluminescence intensity curves (b), ex vivo livers on Day 20 of bioluminescence quantification (c) and animal survival (d) of the orthotopic H22 tumour model receiving the indicated treatments (n = 5 biologically independent animals for b and c and n = 6 biologically independent animals for survival). e-h, Flow cytometry quantitative data of M1-type macrophage and M2-type macrophage (e, f) and CD4+ and CD8+ T cells (g, h) in tumours of the orthotopic H22 tumour model sacrificed on Day 20 (n = 5 biologically independent animals). i Schematic of the B16F10 tumour-bearing mouse model experiment (dose of 3.0 × 106 cells per mouse per injection, equal to 4 mg/kg R848 and 3.4 mg/kg INCB). j, k Tumour photographs (j) and tumour inhibition rate (k) of the sacrificed B16F10 tumour-bearing mice at the study endpoint (n = 6 biologically independent animals). l–o Flow cytometry quantitative data of M1-type macrophage and M2-type macrophage (l, m) and CD4+ and CD8+ T cells (n, o) in tumours of the sacrificed B16F10 tumour-bearing mice (n = 5 biologically independent animals). Data are expressed as the mean ± SD. One-way ANOVA with Tukey’s multiple comparisons test (c, f–h, m–o), the Welch ANOVA with Dunnett’s T3 multiple comparisons test (k), two-way ANOVA with repeated measures (b) and log-rank tests for survival data (d) were used for statistical analysis. **P < 0.01; ***P < 0.001. BMDMs were used in all experiments involving macrophages.

References

    1. Yu, J. X., Upadhaya, S., Tatake, R., Barkalow, F. & Hubbard-Lucey, V. M. Cancer cell therapies: the clinical trial landscape. Nat. Rev. Drug Discov.19, 583–584 (2020). - PubMed
    1. Hou, A. J., Chen, L. C. & Chen, Y. Y. Navigating CAR-T cells through the solid-tumour microenvironment. Nat. Rev. Drug Discov.20, 531–550 (2021). - PubMed
    1. Sorkhabi, A. D. et al. The current landscape of CAR T-cell therapy for solid tumors: Mechanisms, research progress, challenges, and counterstrategies. Front. Immunol.14, 1113882 (2023). - PMC - PubMed
    1. Klichinsky, M. et al. Human chimeric antigen receptor macrophages for cancer immunotherapy. Nat. Biotechnol.38, 947–953 (2020). - PMC - PubMed
    1. Franken, L., Schiwon, M. & Kurts, C. Macrophages: sentinels and regulators of the immune system. Cell. Microbiol.18, 475–487 (2016). - PubMed

Publication types

MeSH terms

LinkOut - more resources