. 2024 Sep 23;15(1):8231.
doi: 10.1038/s41467-024-52238-0.

Core and accessory genomic traits of Vibrio cholerae O1 drive lineage transmission and disease severity

Affiliations

Core and accessory genomic traits of Vibrio cholerae O1 drive lineage transmission and disease severity

Alexandre Maciel-Guerra et al. Nat Commun. .

Abstract

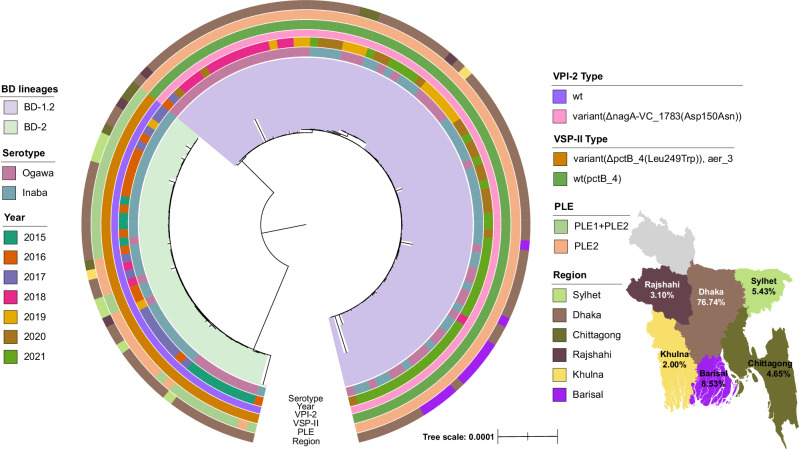
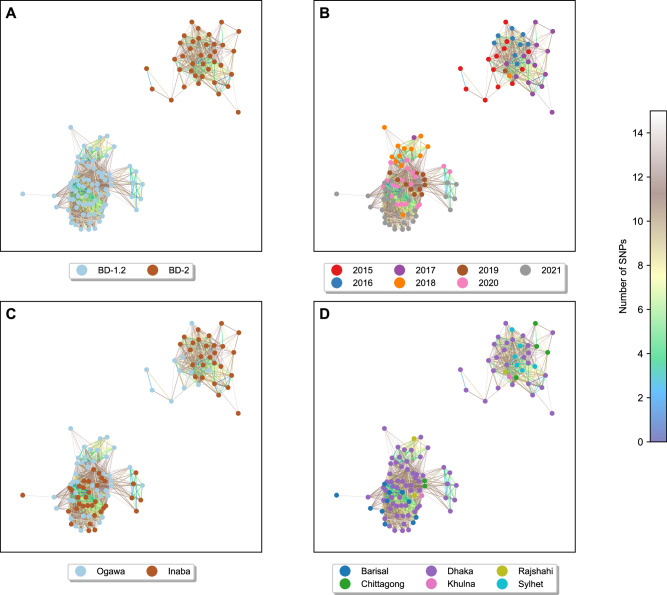
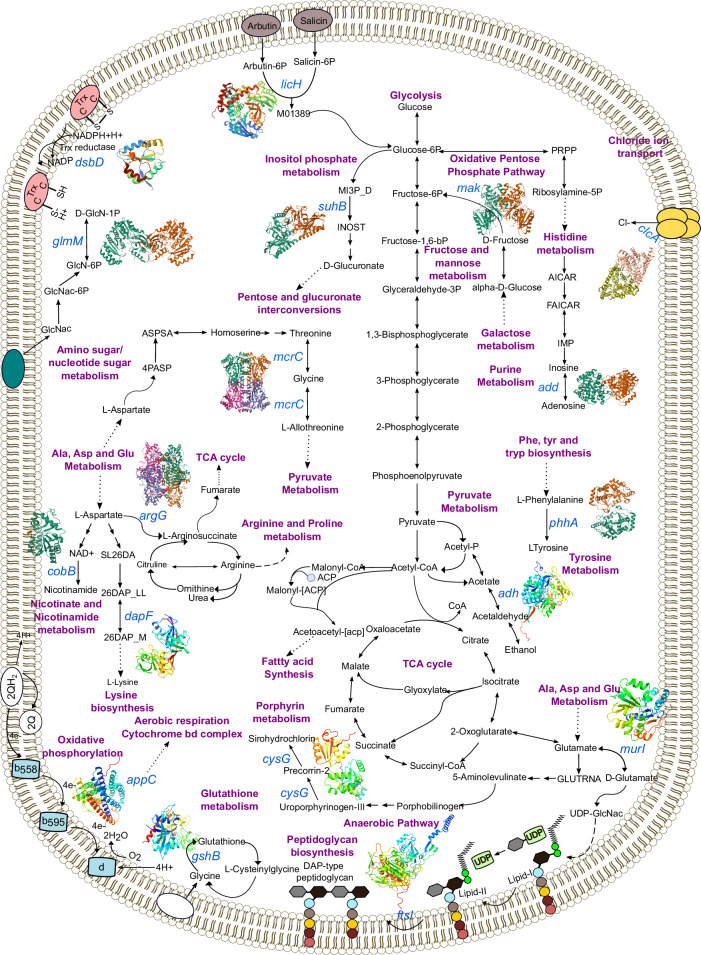
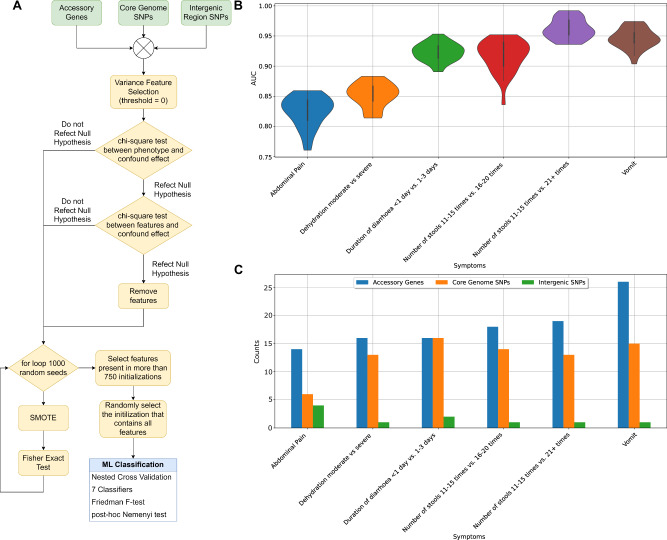
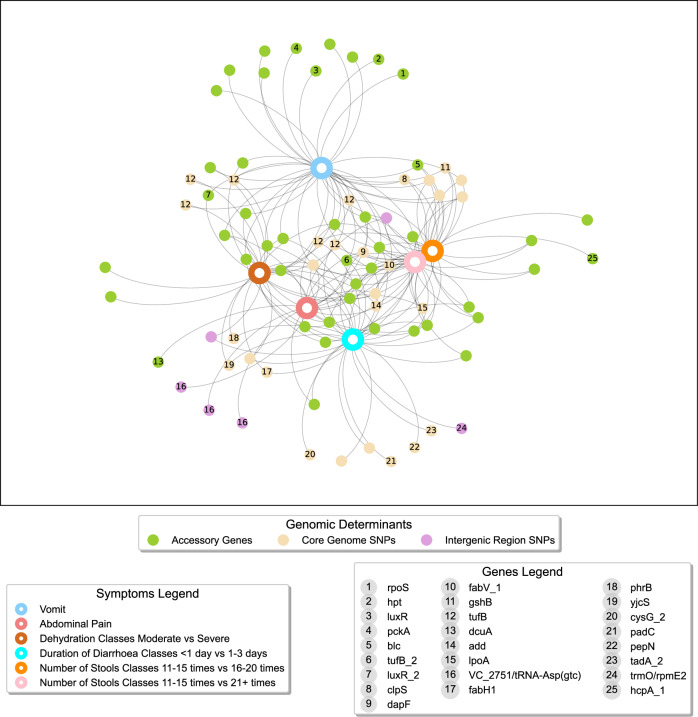
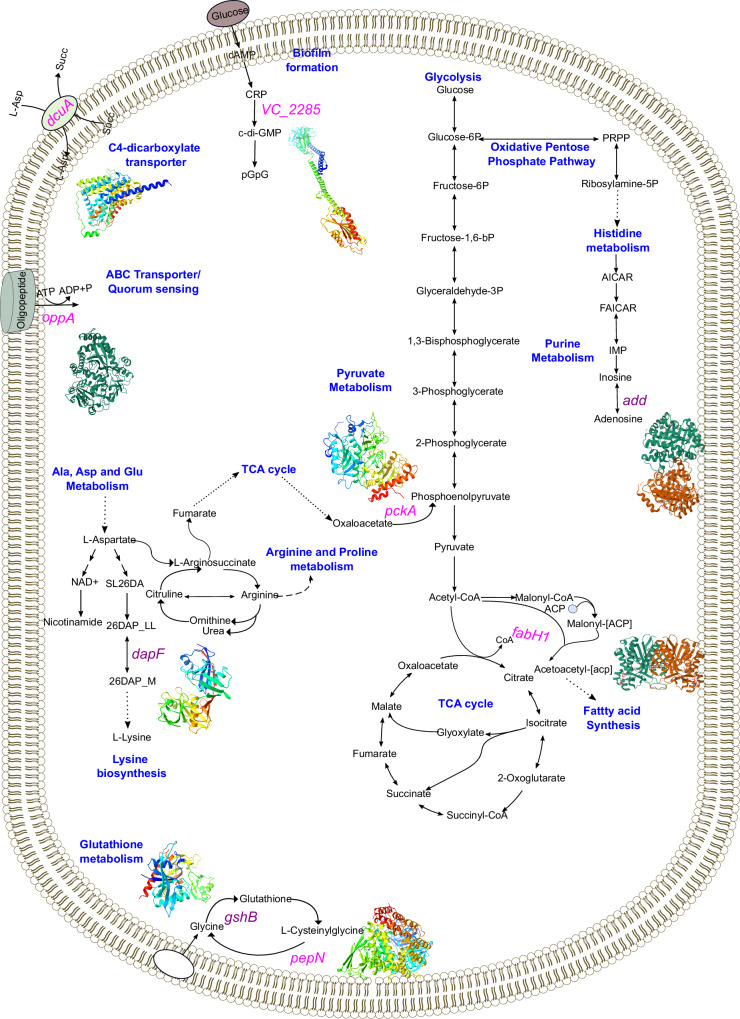
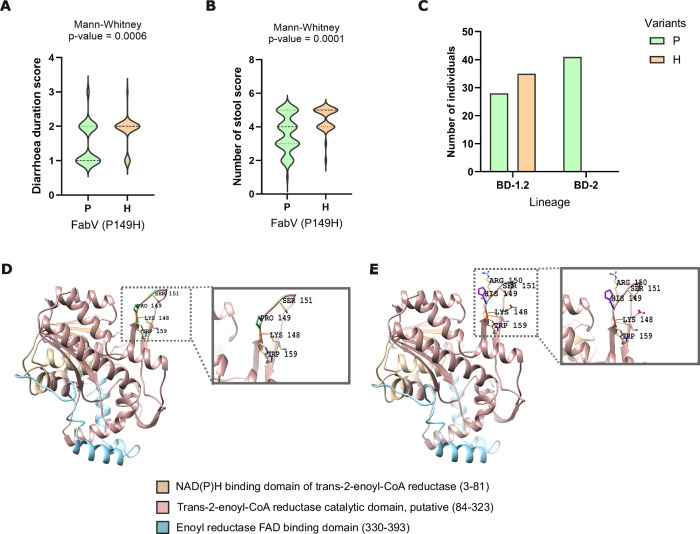
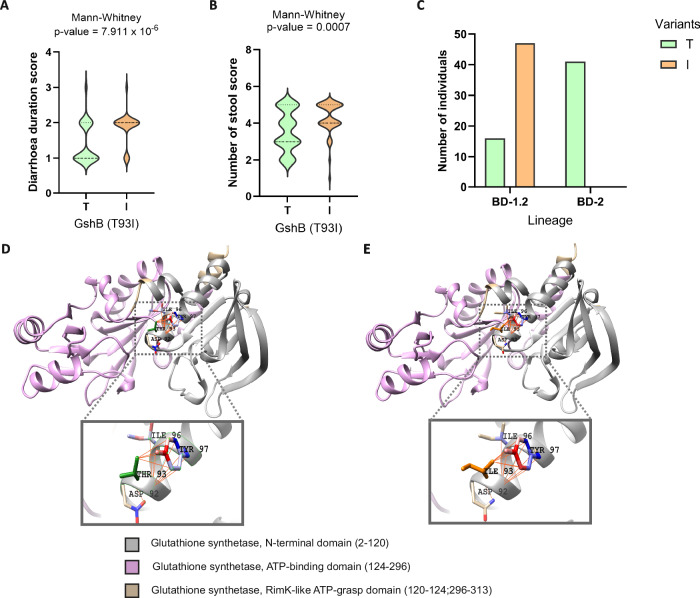
In Bangladesh, Vibrio cholerae lineages are undergoing genomic evolution, with increased virulence and spreading ability. However, our understanding of the genomic determinants influencing lineage transmission and disease severity remains incomplete. Here, we developed a computational framework using machine-learning, genome scale metabolic modelling (GSSM) and 3D structural analysis, to identify V. cholerae genomic traits linked to lineage transmission and disease severity. We analysed in-patients isolates from six Bangladeshi regions (2015-2021), and uncovered accessory genes and core SNPs unique to the most recent dominant lineage, with virulence, motility and bacteriophage resistance functions. We also found a strong correlation between V. cholerae genomic traits and disease severity, with some traits overlapping those driving lineage transmission. GSMM and 3D structure analysis unveiled a complex interplay between transcription regulation, protein interaction and stability, and metabolic networks, associated to lifestyle adaptation, intestinal colonization, acid tolerance and symptom severity. Our findings support advancing therapeutics and targeted interventions to mitigate cholera spread.


Conflict of interest statement

The authors declare no competing interests.

Figures

Fig. 1
Fig. 1. Maximum likelihood phylogenetic tree of the whole cohort based on the core genome of 129 isolates cultured from in-patients admitted to hospitals in six districts (Barisal, Chittagong, Dhaka, Khulna, Rajshahi and Sylhet) of Bangladesh.
The two distinct BD-1.2 and BD-2 lineages are shown in the inner ring. The outer rings display serotypes, year of collection, presence of variants within the Vibrio pathogenic island 2 (VPI-2), Vibrio seventh pandemic island II (VSP-II) and phage-inducible chromosomal island-like elements 1 and 2 (PLE) and region of collection. A map of Bangladesh showing the proportion of samples collected from each regional division is also shown.
Fig. 2
Fig. 2. SNP network analysis of highly connected isolates.
Network diagram showing pairwise connections between isolates in our cohort with less than 15 pairwise SNP differences. The panels show the same network with the nodes colour-coded according to (A) lineages, (B) year of collection, (C) serotypes and (D) location of collection. The lines between pairs of isolates are colour-coded by the number of SNPs.
Fig. 3
Fig. 3. An overview of the metabolic pathways associated to the core genes underlying the BD-1.2 and BD-2 lineages separation.
All genes annotated were found to have reduced flux span through the metabolic system when knocked out. Genes coloured in blue have a significant different allelic distribution between BD-1.2 and BD-2, associated metabolic pathways are labelled in purple. All 3D protein structures were generated in Alphafold under a Creative Commons Attribution 4.0 license (CC-BY 4.0), no changes were made.
Fig. 4
Fig. 4. Supervised machine learning pipeline accurately predicts the clinical manifestations of hospitalised patients from the genomic determinants extracted from BD-1.2 isolates, collected among the same hospitalised patients.
A Flow diagram showing machine learning pipeline including data (green), pre-processing steps (yellow) and classification (blue). B Machine learning performance results measured by the area under the curve (AUC) from 30 training runs for clinical symptom combination. The results shown are for the best classifier Logistic Regression, as defined by the Nemenyi test (Fig. S18). The violin plots show the distribution of the data, with each data point representing one classification model. Inside each violin plot is a box plot, with the box showing the interquartile range (IQR), the whiskers showing the rest of the distribution as a proportion of 1.5 x IQR and the white circle representing the median value. C Number of features (accessory genes, core genome and intergenic SNPs) selected for each symptom. Predictive models were generated for six different clinical symptoms (X-axis): abdominal pain; dehydration Moderate vs. Severe; duration of diarrhoea <1 day vs. 1–3 days; number of stools 11–15 times vs. 16–20 times; number of stools 11–15 times vs. 21+ times; and vomit.
Fig. 5
Fig. 5. Undirected graph network illustrating the genomic features associated with clinical symptom models for V.
cholerae. Node colour denotes the genomic determinant category, (i.e. accessory genes and/or core genome coding, and intergenic SNPs) identified by machine learning. Nodes are labelled with numbers corresponding to specific genes associated with each genomic determinant, as detailed in the Genes Legend, while unnumbered nodes are related to unannotated (hypothetical) genes. The clinical symptom models are highlighted in different colours and explained in the legend Symptoms Legend featuring abdominal pain; dehydration Moderate vs. Severe; duration of diarrhoea <1 day vs. 1–3 days; number of stools 11–15 times vs. 16–20 times; number of stools 11–15 times vs. 21+ times; and vomiting.
Fig. 6
Fig. 6. An overview of the metabolic pathways impacted by statistically significant genes underlying clinical symptoms.
All genes annotated were found to have reduced the flux span through the metabolic system when knocked out. Genes coloured in pink and purple carried mutations or are accessory genes associated to the clinical symptom, respectively, and connected metabolic pathways (labelled in blue). The genes coloured in purple were also found as statistically significant in differentiating the BD-2 and BD-1.2 lineages (see previous sections). All 3D protein structures were generated in Alphafold under a Creative Commons Attribution 4.0 license (CC-BY 4.0), no changes were made.
Fig. 7
Fig. 7. 3D protein structure analysis of FabV allelic variants underlying BD-1.2 and BD-2 lineage evolution and clinical symptoms.
A Violin plot indicating the distribution of the diarrhoea duration score (0: no diarrhoea, 1: <1day, 2: 1–3 days, 3: 4–6 days and 4: 7–9 days) for the isolates containing either Pro149 (P) or His149 (H). Statistical significance was tested with a two-sided Mann Whitney U test, p-value is shown. B Violin plot indicating the distribution of the number of stools score (0: <3 times, 1: 3–5 times; 2: 6–10 times; 3: 11–15 times; 4: 16–20 times; 5: 21+ times) for the isolates containing either Pro149 (P) or His149 (H). Statistical significance was tested with a two-sided Mann Whitney U test, p-value is shown. C The bar graph displays the number of isolates in the two BD lineages associated with Pro149 (P) and His149 (H). D 3D structures of FabV (AlphaFold) with Pro149 and coloured by functional domains. Amino acid residues (Lys148, Ser151, and Trp159) interacting with Pro149 (green) are shown in sticks models. E 3D structures of FabV (AlphaFold) with His149 and coloured by functional domains. Amino acid residues (Lys148, Arg 150, Ser151, and Trp159) interacting with His149 (purple) are shown in sticks models.
Fig. 8
Fig. 8. 3D protein structure analysis of GshB allelic variants underlying BD-1.2 and BD-2 lineage evolution and clinical symptoms.
A Violin plot indicating the distribution of the diarrhoea duration score (0: no diarrhoea, 1: <1day, 2: 1–3 days, 3: 4–6 days and 4: 7–9 days) for the isolates containing either Thr93 (T) or Ile93 (I). Statistical significance was tested with a two-sided Mann Whitney U test, p-value is shown. B Violin plot indicating the distribution of the number of stools score (0: <3 times, 1: 3–5 times; 2: 6–10 times; 3: 11–15 times; 4: 16–20 times; 5: 21+ times) for the isolates containing either Thr93 (T) or Ile93 (I). Statistical significance was tested with a two-sided Mann Whitney U test, p-value is shown. C The bar graph displays the number of isolates in the two BD lineages associated Thr93 (T) or Ile93 (I). D 3D structures of GshB (AlphaFold) with Thr93 and coloured by functional domains. Amino acid residues (Asp92, Ile96, and Tyr97) interacting with Thr93 (green) are shown in sticks models. E 3D structures of GshB (AlphaFold) with Ile93 and coloured by functional domains. Amino acid residues interacting with Ile93 (orange) are shown in sticks models.

References

    1. Baddam, R. et al. Genome dynamics of Vibrio cholerae isolates linked to seasonal outbreaks of cholera in Dhaka, Bangladesh. MBio11, e03339–03319 (2020). - PMC - PubMed
    1. Banerjee, R., Das, B., Nair, G. B. & Basak, S. Dynamics in genome evolution of Vibrio cholerae. Infect. Genet. Evol.23, 32–41 (2014). - PubMed
    1. Ali, M., Nelson, A. R., Lopez, A. L. & Sack, D. A. Updated global burden of cholera in endemic countries. PLoS Negl. Trop. Dis.9, e0003832 (2015). - PMC - PubMed
    1. Kaper, J. B., Morris, J. G. Jr. & Levine, M. M. Cholera. Clin. Microbiol. Rev.8, 48–86 (1995). - PMC - PubMed
    1. Karaolis, D. K. et al. A Vibrio cholerae pathogenicity island associated with epidemic and pandemic strains. Proc. Natal Acad. Sci.95, 3134–3139 (1998). - PMC - PubMed

Publication types

LinkOut - more resources