Comparative Study
. 2024 Sep 23;14(1):22002.
doi: 10.1038/s41598-024-73057-9.

In vitro comparison of human and murine trabecular meshwork cells: implications for glaucoma research

Affiliations
Comparative Study

In vitro comparison of human and murine trabecular meshwork cells: implications for glaucoma research

Fridolin Langer et al. Sci Rep. .

Abstract

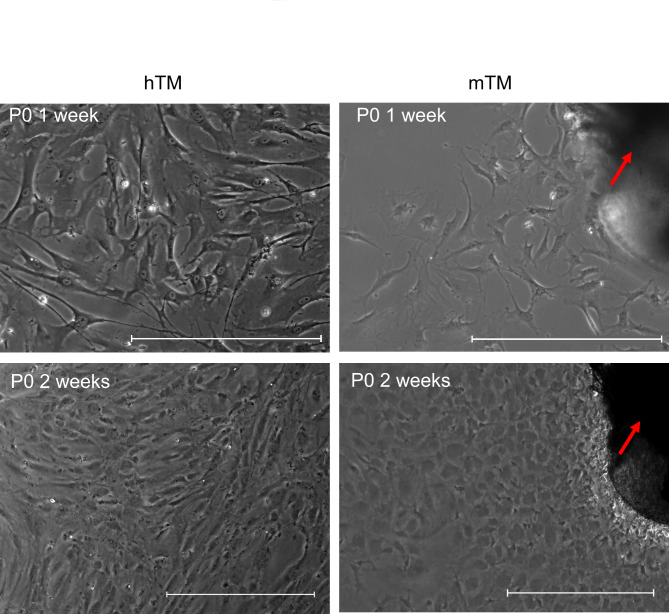
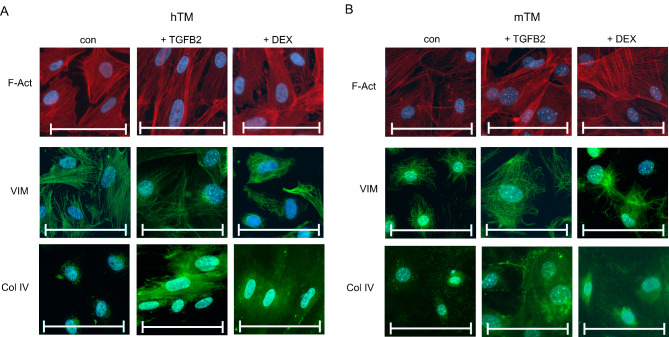
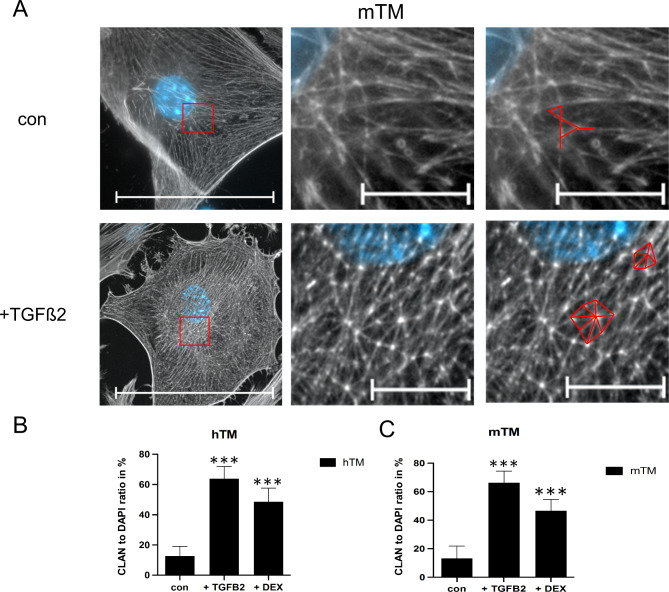
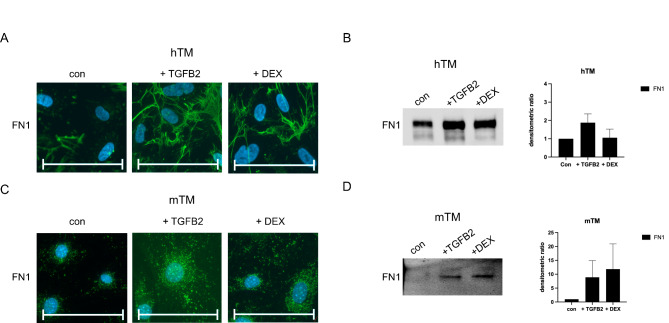
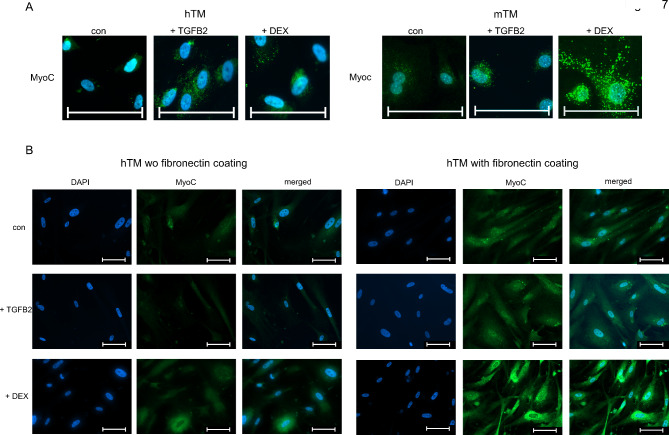
The trabecular meshwork (TM) is crucial for regulating intraocular pressure (IOP), and its dysfunction significantly contributes to glaucoma, a leading cause of vision loss and blindness worldwide. Although rodents are commonly used as animal models in glaucoma research, the applicability of these findings to humans is limited due to the insufficient understanding of murine TM. This study aimed to compare primary human TM (hTM) and murine TM (mTM) cells in vitro to enhance the robustness and translatability of murine glaucoma models. In this in vitro study, we compared primary hTM and mTM cells under simulated physiological and pathological conditions by exposing both cell types to the glucocorticoid dexamethasone (DEX) and Transforming Growth Factor β (TGFB2), both of which are critical in the pathogenesis of several ophthalmological diseases, including glaucoma. Phagocytic properties were assessed using microbeads. Cells were analyzed through immunocytochemistry (ICC) and Western blot (WB) to evaluate the expression of extracellular matrix (ECM) components, such as Fibronectin 1 (FN1) and Collagen IV (COL IV). Filamentous-Actin (F-Act) staining was used to analyze cross-linked actin network (CLAN) formation. Additionally, we evaluated cytoskeletal components, including Vimentin (VIM), Myocilin (MYOC), and Actin-alpha-2 (ACTA2). Our results demonstrated significant similarities between human and murine TM cells in basic morphology, phagocytic properties, and ECM and cytoskeletal component expression under both homeostatic and pathological conditions in vitro. Both human and murine TM cells exhibited epithelial-to-mesenchymal transition (EMT) after exposure to DEX or TGFB2, with comparable CLAN formation observed in both species. However, there were significant differences in FN1 and MYOC induction between human and murine TM cells. Additionally, MYOC expression in hTM cells depended on fibronectin coating. Our study suggests that murine glaucoma models are potentially translatable to human TM. The observed similarities in ECM and cytoskeletal component expression and the comparable EMT response and CLAN formation support the utility of murine models in glaucoma research. The differences in FN1 and MYOC expression between hTM and mTM warrant further investigation due to their potential impact on TM properties. Overall, this study provides valuable insights into the species-specific characteristics of TM and highlights opportunities to refine murine models for better relevance to human glaucoma.


Conflict of interest statement

The authors declare no competing interests.

Figures

Fig. 1
Fig. 1
Representative phase-contrast images of hTM and mTM one and two weeks after initial culture. Left column: Phase-contrast image for hTM at P0 after 1 and 2 weeks in cell culture. Right column: Phase-contrast for mTM at P0 after 1 and 2 weeks in cell culture. Red arrows mark the residual cornea/TM stripe. The scale bar represents 500 μm.
Fig. 2
Fig. 2
Identification and quantification of phagocytosing TM cells with fluorescent microbeads. (A) Representative ICC images of mTM cells previously exposed to green fluorescent microbeads for 48 h. Nuclei were stained with DAPI and F-actin with Alexa555-Phallodin. The scale bar represents 200 μm. (B) Quantitative analysis procedure of phagocytosing hTM cells using a microscope with automated XYZ stage. (B1) Merged image shows the cell nuclei (blue) and the fluorobeads (green) for the following analysis. (B2) DAPI-stained nuclei were gated in the blue channel. (B3) This primary mask was extended by 20 μm and used as a sub-mask in the green channel to identify fluorobeads-positive cells. (B4) After setting a threshold, fluorobeads-positive cells are highlighted in red, and yellow circles highlight fluorobeads-negative cells. The scale bar represents 200 μm. (C) XY-scatter plot for hTM cells consisting of 3 biological replicates showing the peak GFP intensity and nuclei size of 8215 analyzed cells. The fluorescent microbeads-positive counts are highlighted in green. (D) XY-scatter plot for mTM cells consisting of 3 biological replicates showing the peak GFP intensity and nuclei size of 1946 analyzed cells. The fluorescent microbeads-positive counts are highlighted in green.
Fig. 3
Fig. 3
ICC staining with EMT-associated markers F-actin, vimentin, and collagen IV of hTM and mTM cells exposed for ten days without or with TGFB2 or DEX. HTM cells (A) and mTM cells (B) were immunostained for F-Act, VIM, and COL IV. The cell nuclei were stained with DAPI. The scale bar corresponds to 100 μm.
Fig. 4
Fig. 4
Expression of CLAN formations for confluent hTM and mTM cells after 10 days of exposure to TGFB2 or DEX. (A) F-Act image of mTM cell under control and TGFB2 treatment conditions. Phalloidin-A488 was previously used to stain F-Actin Filaments. The red square marks the region of interest displayed in the middle image. In the right image, the orientation of F-Actin filaments is traced by red lines. A representative CLAN formation of 7 triangles is traced for the TGFB2 treatment, while the control only shows two triangles. (B) The ratio of CLAN-positive to DAPI-positive hTM cells in control and under exposure to TGFB2 or DEX. (C) The percentage of CLAN-positive to DAPI-positive mTM cells in the control and under exposure to TGFB2 or DEX. The nuclei were stained using DAPI. The F-act channel is displayed as a monochrome image. The scale bar in the left column represents 100 μm, and the scale bar in images of the region of interest represents 10 μm. For CLAN to DAPI ratios, an unpaired two-tailed t-test to the control revealed significant differences (***p < 0.0001). The error bars display SD.
Fig. 5
Fig. 5
ACTA2 expression for confluent hTM and mTM cells after 10 days of exposure to TGFB2 or DEX. (A) ACTA2 ICC staining for confluent hTM cells in control and after ten days of exposure to TGFB2 (20 ng/ml) or DEX (500 nm). The cell nuclei were stained with DAPI. The scale bar corresponds to 100 μm. (B) Representative WB of hTM cells for ACTA2 and the densitometric ratio of WB for ACTA2. (C) ICC staining of ACTA2 on confluent mTM cells in control and after ten days of exposure to TGFB2 (20ng/ml) or DEX (500nm). The cell nuclei were stained with DAPI. The scale bar corresponds to 100 μm. (D) Representative WB of mTM cells for ACTA2 and the densitometric ratio of WB for ACTA2.The densitometric ratio of WB for ACTA2 was calculated from three biological replicates and normalized to total protein with further normalization to the untreated control. Corresponding total protein blots are shown in Supplemental Fig. SF1. An unpaired two-tailed t-test was performed on the control, revealing significant differences (*p < 0.05). The error bars display SD.
Fig. 6
Fig. 6
FN1 expression for confluent hTM and mTM cells after 10 days of exposure to TGFB2 or DEX. (A) FN1 ICC staining for confluent hTM cells in control and after ten days of exposure to TGFB2 (20 ng/ml) or DEX (500 nm). The cell nuclei were stained with DAPI. The scale bar corresponds to 100 μm. (B) Representative WB of hTM cells for FN1 and the densitometric ratio of WB for ACTA2. (C) FN1 ICC staining for confluent mTM cells in control and after ten days of exposure to TGFB2 (20 ng/ml) or DEX (500 nm). The cell nuclei were stained with DAPI. The scale bar corresponds to 100 μm. (D) Representative WB of mTM cells for FN1 and the densitometric ratio of WB for FN1. The densitometric ratio of WB for FN1 was calculated from three biological replicates and normalized to total protein with further normalization to the untreated control. The corresponding total protein blots are shown in Supplemental Fig. SF1. An unpaired two-tailed t-test to the control was performed (*p < 0.05). The error bars display SD.
Fig. 7
Fig. 7
ICC staining of MYOC for confluent hTM and mTM cells after 10 days of exposure to TGFB2 or DEX. (A) HTM and mTM cells were immunostained for MYOC. The DAPI and MYOC channels are merged. (B) HTM cells immunostained for MYOC without (left side) and with (right side) fibronectin coating. DAPI and MYOC channels are displayed individually and merged. The cell nuclei were stained with DAPI. The scale bar corresponds to 100 μm.

References

    1. Quigley, H. A. & Broman, A. T. The number of people with glaucoma worldwide in 2010 and 2020. Br. J. Ophthalmol.90, 262–267 (2006). - PMC - PubMed
    1. Hollows, F. C. & Graham, P. A. Intra-ocular pressure, glaucoma, and glaucoma suspects in a defined population. Br. J. Ophthalmol.50, 570–586 (1966). - PMC - PubMed
    1. Acott, T. S. & Kelley, M. J. Extracellular matrix in the trabecular meshwork. Exp. Eye Res.86, 543–561 (2008). - PMC - PubMed
    1. Johnson, M. & Erickson, K. Mechanisms and routes of aqueous humor drainage. In Principles and Practice of Ophthalmology 2577–2595WB (Saunders Co., 2000).
    1. Weinreb, R. N., Aung, T. & Medeiros, F. A. The pathophysiology and treatment of glaucoma: a review. JAMA311, 1901–1911 (2014). - PMC - PubMed

Publication types