. 2024 Nov;6(11):2070-2081.
doi: 10.1038/s42255-024-01139-z. Epub 2024 Sep 23.

Loss of electrical β-cell to δ-cell coupling underlies impaired hypoglycaemia-induced glucagon secretion in type-1 diabetes

Affiliations

Loss of electrical β-cell to δ-cell coupling underlies impaired hypoglycaemia-induced glucagon secretion in type-1 diabetes

Thomas G Hill et al. Nat Metab. 2024 Nov.

Abstract

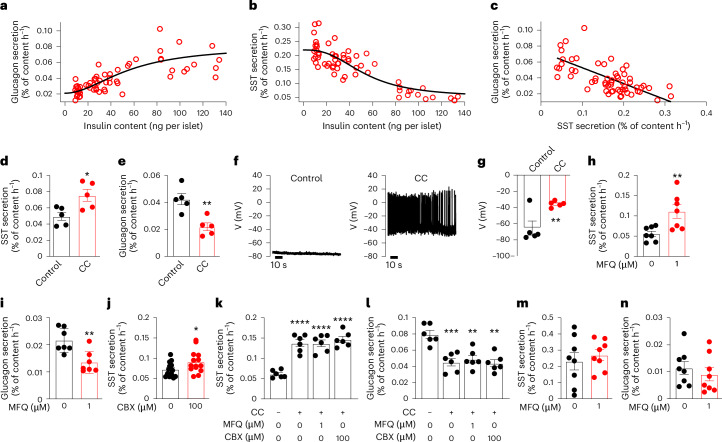
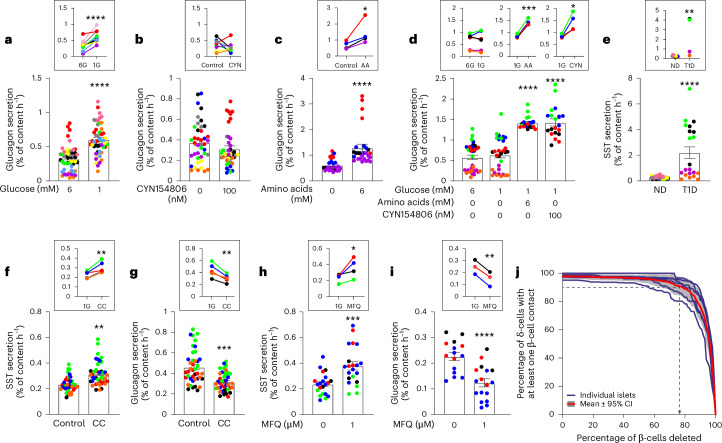
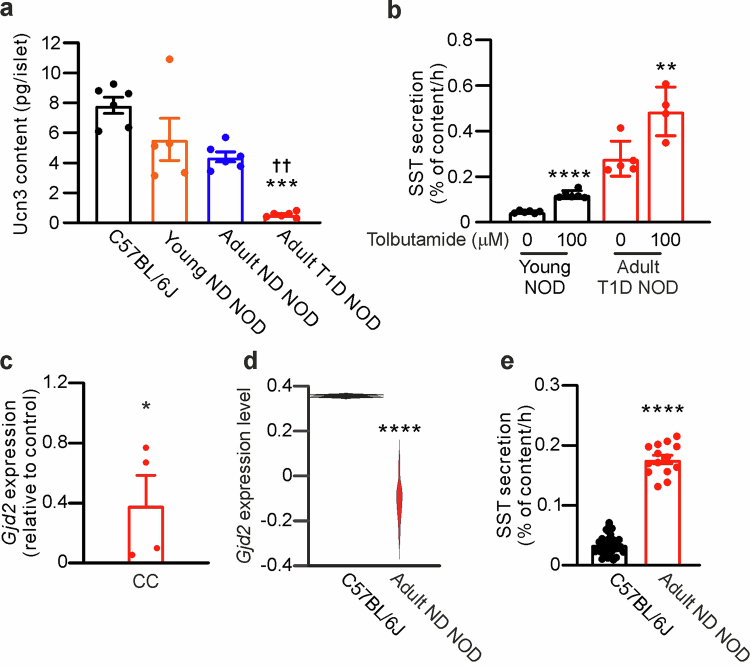
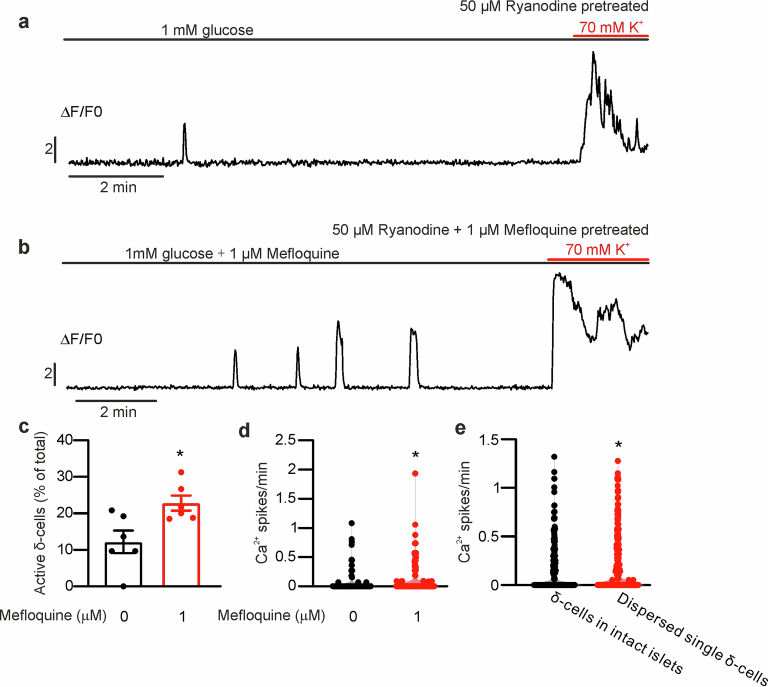
Diabetes mellitus involves both insufficient insulin secretion and dysregulation of glucagon secretion1. In healthy people, a fall in plasma glucose stimulates glucagon release and thereby increases counter-regulatory hepatic glucose production. This response is absent in many patients with type-1 diabetes (T1D)2, which predisposes to severe hypoglycaemia that may be fatal and accounts for up to 10% of the mortality in patients with T1D3. In rats with chemically induced or autoimmune diabetes, counter-regulatory glucagon secretion can be restored by SSTR antagonists4-7 but both the underlying cellular mechanism and whether it can be extended to humans remain unestablished. Here, we show that glucagon secretion is not stimulated by low glucose in isolated human islets from donors with T1D, a defect recapitulated in non-obese diabetic mice with T1D. This occurs because of hypersecretion of somatostatin, leading to aberrant paracrine inhibition of glucagon secretion. Normally, KATP channel-dependent hyperpolarization of β-cells at low glucose extends into the δ-cells through gap junctions, culminating in suppression of action potential firing and inhibition of somatostatin secretion. This 'electric brake' is lost following autoimmune destruction of the β-cells, resulting in impaired counter-regulation. This scenario accounts for the clinical observation that residual β-cell function correlates with reduced hypoglycaemia risk8.


Conflict of interest statement

Competing interests: The authors declare no competing interests.

Figures

Fig. 1
Fig. 1. T1D abolishes hypoglycaemia-induced glucagon secretion owing to elevated somatostatin secretion.
a, Glucagon secretion in perfused pancreases of adult ND or T1D NOD mice at indicated glucose concentrations (n = 15, 19 and 4 for 1, 10 and 20 mM glucose, respectively). b, Steady-state glucagon secretion in a under indicated conditions. ***P = 0.0003 vs 10 mM glucose; ††††P = 7.6 × 10−5 vs 1 mM glucose adult ND mice. c, As in a but the effect of arginine (arrow) in ND (n = 3) and T1D (n = 4 mice). Inset: mean glucagon secretion before and after addition of arginine in ND (black) and T1D (red) mice. *P = 0.046, ****P = 7.5 × 10−6 vs no arginine. d,e, Glucagon (d) and somatostatin (e) secretion at 1 mM and 10 mM glucose in young ND (n = 6 experiments with six mice; black), adult ND (n = 13 experiments with five mice; grey) and adult T1D islets (n = 7 experiments with five mice; red). **P < 0.01, ***P < 0.001 vs 1 mM glucose (same category); †††P < 0.001 vs 1 mM glucose young ND mice. f, As in d but testing CYN154806 (n = 9 experiments with six mice, n = 14 experiments with five mice and n = 5 experiments with five mice, respectively). ***P < 0.001 vs no CYN154806 (same category); †††P < 0.001 vs no CYN154806 young ND mice; ‡‡P < 0.01 vs no CYN154806 adult ND mice; §P < 0.05 vs CYN154806 young mice. gi, Glucagon secretion in pancreases of young ND (black, n = 4), adult ND (grey; n = 8) and T1D (red, n = 8) mice under indicated conditions (g), 5-min mean glucagon (h) or somatostatin secretion (i) under indicated conditions. *P < 0.05; **P < 0.01; ***P < 0.001 vs 1 mM glucose (same category); †P < 0.05; ††P < 0.01 vs 1 mM glucose young ND mice; ‡P < 0.05 vs 1 mM glucose adult ND mice; §§§P < 0.001 vs CYN154806 young ND mice; ¶¶P = 0.003 vs CYN154806 adult ND mice. Inset in g: fold stimulation by CYN154806 (stimulation index, SI). j, Area under the curve (AUC) of plasma glucagon during insulin-induced hypoglycaemia in adult ND and T1D mice ±CYN154806. *P = 0.015 vs no CYN154806 adult ND NOD mice n = 6–8; †P = 0.038 vs T1D mice (n = 5–8). One-sided (in c) or two-sided unpaired t-test (in b and j); ANOVA with Dunnett’s post hoc (in di). Rectangles and error bars behind data points represent mean values ± s.e.m. SST, somatostatin. Source data
Fig. 2
Fig. 2. Loss of electrical coupling in T1D contributes to elevated intraislet somatostatin.
a, Relationship between insulin content and glucagon secretion in isolated islets. The Hill equation (glucagon secretion = 1 ⁄ (1 + (EC50 / (insulin content)h) was fit to the data with an EC50 of 56 ± 9 nmol per islet and an h = 1.9 ± 0.5. b, As in a, but showing the relationship between insulin content and somatostatin secretion. EC50 = 53 ± 6 nmol per islet, h = −2.5 ± 0.5. c, Relationship between somatostatin secretion and glucagon secretion. Line: linear regression fitting of the data (r = 0.669; P < 0.0001). In ac, data points (n = 60) represent groups of 20 islets (using 12 young ND, 10 adult ND and 10 T1D NOD mice). d,e, Somatostatin (d) and glucagon (e) secretion at 1 mM glucose in islets with or without 24 h CC pretreatment. *P = 0.02, **P = 0.004 vs 1 mM glucose alone (n = 5 using four mice). f, Membrane potential recordings from δ-cells in intact islets treated with saline (left) or CC (right). g, Most negative δ-cell (interspike) potential with or without CC pretreatment. **P = 0.0049 vs control (one-sided unpaired t-test). n = 5 cells in five islets from two mice. h,i, Somatostatin (h) and glucagon secretion (i) at 1 mM glucose with or without MFQ. **P = 0.0095 (in h); **P = 0.0038 (in i) vs 1 mM glucose alone (n = 7 using four mice). j, As in h, but testing the effect of CBX (100 µM). *P = 0.04 vs 1 mM glucose alone (n = 14 using four mice). k,l, Somatostatin (k) and glucagon secretion (l) at 1 mM glucose in islet pretreated or not with CC and in the presence of MFQ or CBX as indicated. **P < 0.01; ***P < 0.001; ****P < 0.0001 vs 1 mM glucose (n = 6 using four mice). m,n, Somatostatin (m) and glucagon (n) secretion at 1 mM glucose in islets from T1D NOD mice with or without MFQ as indicated (n = 5 using five T1D NOD mice; blood glucose >33 mM). Somatostatin secretion at 1 mM glucose alone was higher than in young ND NOD mice (P = 0.0115). Two-sided unpaired t-test was used in d, e and hn. In dot plots, rectangles and error bars behind data points represent mean values ± s.e.m. CC, cytokine cocktail. Source data
Fig. 3
Fig. 3. β-cell hyperpolarization via gap junctions prevents δ-cell electrical activity and somatostatin secretion.
a,b, Examples of light-induced currents (a) and changes in membrane potential (b) in δ-cells of RIP-NpHR islets exposed to 10 mM glucose. Horizontal bars above the traces indicate onset of light activation (625 nm). In a, red dashed line indicates baseline. c, Amplitudes of light-induced currents (ΔI) in δ-cells ±200 μM CBX. Insets show δ-cell current excursions during optoactivation of NpHR in β-cells at 1 mM glucose in the absence (Ctrl) and presence of CBX. *P = 0.0328 vs no CBX (n = 7 cells without and n = 8 cells with CBX from seven mice). d, As in c but membrane potential changes (ΔVm) were measured. ****P = 1.4 × 10⁻⁶ (n = 17 cells without and n = 8 cells with CBX from seven mice). e, Somatostatin secretion in RIP-NpHR islets at 1 mM and 20 mM glucose ±NpHR activation in β-cells. ***P = 0.0009, ****P = 3.3 × 10−5 vs 1 mM glucose alone (±light activation); †P = 0.0126 vs 20 mM glucose without light activation (n = 11–16 experiments using islets from six mice). f, Membrane resistance in δ-cells at 1 mM glucose in islets from control and β-V59M mice. P = 0.96 vs control islets (n = 13 cells from eight control mice and n = 5 cells from four β-V59M mice). g, Electrical activity recorded from a δ-cell in a control islet at indicated glucose concentrations. Representative of five δ-cells from five mice. h, As in g but experiment performed in a δ-cell in an islet from hyperglycaemic β-V59M mouse 48 h after induction of the transgene expression (and diabetes) with tamoxifen. Representative of three δ-cells from three mice. i, Effects of injection of negative current (−1, −2 and −4 pA; top) on electrical activity (lower) in δ-cells at 10 mM glucose. j, Minimal current required to inhibit δ-cell electrical activity (n = 7 cells from five mice). Two-sided unpaired t-test was used in cf. In dot plots, rectangles and error bars behind data points represent mean values ± s.e.m. WT, wild type. Source data
Fig. 4
Fig. 4. Effects of T1D on glucagon and somatostatin secretion in human islets.
a–c, Glucagon secretion in human islets from ND donors at 6 mM and 1 mM glucose (6G and 1G) (n = 50, ten donors) (a), at 1 mM glucose ±100 nM CYN154806 (n = 41, eight donors) (b) or 6 mM amino acids (AA) (n = 27, four donors) (c). ****P = 6.676 × 10−10 (glucose) and ****P = 3.446*10−5 (AA). ****P = 7.7 × 10−5 (inset in a) and *P = 0.0362 (inset in c). d, Glucagon secretion in islets from donors with T1D at 6 mM and 1 mM glucose (n = 31–36 experiments, six donors) or ±CYN154806 or amino acids as indicated (n = 20 experiments, four donors). *P = 0.015, ***P = 0.00015, ****P < 0.0001. e, Somatostatin secretion at 1 mM glucose in islets from ND donors (n = 56, nine donors) and donors with T1D (n = 31, four donors). ****P = 1.8 × 10−5, **P = 0.004 (inset). f,g, Somatostatin (f) and glucagon (g) secretion at 1 mM glucose in islets from ND donors ±CC pretreatment for 24 h (n = 25, five donors). **P = 0.00105 (somatostatin), ***P = 0.00049 (glucagon) vs no CC. In insets, **P = 0.0024 (glucagon), **P = 0.0045 (somatostatin). h,i, Somatostatin (h) and glucagon (i) secretion at 1 mM glucose in islets from ND donors with or without MFQ (n = 21, four donors for somatostatin and n = 17, three donors for glucagon). ***P = 0.0005 (somatostatin), ****P = 9.39 × 10−5 (glucagon) vs control. In insets, *P = 0.035 (somatostatin) and **P = 0.002 (glucagon). j, Mathematical modelling of the fraction of δ-cells in contact with at least one β-cell expressed as a function of fraction β-cells deleted (%) in individual islets and mean of six islets. Shaded area, 95% confidence interval. Dotted lines, >90% of δ-cells are in contact with at least one β-cell until ~75% of β-cells have been removed. Rectangles and error bars behind data points represent mean values ± s.e.m. In ai, different colours are used for each donor. Insets show mean data of the individual donors. Two-tailed unpaired t-test was used in ac and ei, one-way ANOVA with Tukey’s post hoc test was used in d and one-tailed paired t-test was used in the insets in ad and fi. One-tailed unpaired t-test was used in the inset of e. Source data
Extended Data Fig. 1
Extended Data Fig. 1. Impact of T1D on plasma glucose and pancreatic insulin and glucagon contents in NOD mice.
a, Fed plasma glucose in adult NOD mice before (non-diabetic; ND, n = 27) and after onset of type-1 diabetes (T1D, n = 22). ****p = 3 × 10⁻²¹ vs ND. b, Kaplan Meier curves for the onset of T1D (loss of normoglycaemia) in NOD mice. Curves are based on 140 mice (70 males/70 females) of which 8 males (blue) and 31 females (red) developed T1D. Onset of diabetes displayed against age of mice (weeks). c, Whole-pancreas insulin content of adult ND (n = 22) and T1D NOD mice (n = 26). *p = 0.014 vs ND NOD mice. d, Representative immunohistochemistry of pancreatic islets from young ND NOD mice ( < 7 weeks old) and adult ( > 12 weeks old) ND and T1D NOD mice. Insulin (Ins) =white; glucagon (Gcg) =red; somatostatin (Sst) = green. Scale bar: 50 µm. Representative of 4 mice of each group. e, Islet area in young mice and adult mice with or without T1D. ****p < 0.0001 vs young ND NOD mice; ††††p < 0.0001 vs adult ND NOD mice. f, Relative β-cell area in young ND NOD mice and adult ND and T1D NOD mice. ****p < 0.0001 vs young ND NOD mice; ††††p < 0.0001 vs adult ND NOD mice. g, Whole-pancreas glucagon content of adult ND (n = 19) and T1D NOD mice (n = 27). In a, c and g, each dot corresponds to an individual animal. In (e-f), each dot represents an islet from 4 young ND NOD ( < 7 weeks old) or 4 adult ( > 12 weeks old) ND NOD mice and 4 adult T1D NOD mice. For each mouse, 3 representative sections were taken 100 µm apart. Rectangles and error bars behind data points represent mean values ± S.E.M. Two-sided Student’s t-test was used for (a and c) and one-way ANOVA with Tukey post hoc test was used for (e-f). Source data
Extended Data Fig. 2
Extended Data Fig. 2. Effects of T1D on islet hormone contents and insulin secretion.
a-c, Islet insulin (a), glucagon (b) and (c) somatostatin contents in young ND ( < 7 weeks old; n = 18 groups of 20 islets from 6 mice, black) and adult (n = 13 experiments with islets from 5 mice, >12 weeks old) ND (grey) and T1D NOD mice (n = 7 experiments with islets from 5 mice; red). ****p < 0.0001 vs young ND NOD islets; †††p = 0.0005, ††††p < 0.0001 vs adult ND NOD mice (one-way ANOVA with Tukey post hoc test). d, Insulin secretion at 1 and 10 mM glucose in young ND (n = 6 experiments with islets from 6 mice), adult ND (n = 13 experiments with islets from 5 mice) and adult T1D NOD mice (n = 7 experiments with islets from 5 mice). **p = 0.009 and ****p = 9.4 × 10⁻⁷ vs 1 mM glucose of the same category. ††††p = 7.6 × 10⁻⁵ (Adult ND) and ††††p = 2.6 × 10⁻⁷ (Adult T1D) vs 10 mM glucose in young NOD mice. Two-sided Student’s t-test. e, Circulating somatostatin in adult ND (n = 8) and T1D NOD mice (n = 5). *p = 0.0035 vs ND. Two-sided Student’s t-test. In dot plots, rectangles and error bars behind data points represent mean values ± S.E.M. Source data
Extended Data Fig. 3
Extended Data Fig. 3. Impaired counter-regulation in NOD mice with T1D and correction by CYN154806.
a-b, Changes in plasma glucose (a) and glucagon (b) in the absence (o; n = 8) and presence (•; n = 6) of CYN154806 in adult ND NOD mice. Insulin (0.75U/kg body weight) was injected at t = 0 (black arrow in a) and CYN154806 (0.5 mg/kg body weight) or vehicle was injected at t = −15 min (red arrow in a). c-d, As in (a-b) but using age-matched T1D NOD mice (n = 8 without and 5 with CYN154806). *p < 0.05 vs without CYN, two-sided Student’s t-test. e, Changes in plasma glucose (black) and glucagon (red) in T1D NOD mice (n = 3). Insulin (0.75U/kg body weight) was injected at t = 0 and 30 min (arrows). f, Plasma glucagon during hypoglycaemia induced by two consecutive insulin injections (0.75U/kg body weight) in T1D NOD mice (to lower plasma glucose to levels similar to those observed in ND mice). Data are expressed as the area under the curve (AUC) above basal (t = 30 min) during the 45 min following the second insulin injection (n = 3). For comparison, the responses in ND NOD mice are shown (mean value [dashed circle] ± S.E.M. [dashed lines], data taken from Fig. 1j); *p = 0.029 vs ND NOD mice, two-sided Student’s t-test. g-h, Relationship of plasma glucagon and glucose in ND (g) and T1D (h) NOD mice during insulin-induced hypoglycaemia in the absence (black) and presence (red) of CYN154806. Dashed lines mark the linear regression fittings of the data. Values of slopes (pM/mM) are given as well as the p values of the respective relationships obtained in the absence (vehicle) or presence of CYN154806. Statistical significance was evaluated using t-test. i, Glycogen content in livers from adult ND (n = 24) and T1D NOD (n = 9) mice. *p = 0.038 vs ND, two-sided Student’s t-test. In dot plots, rectangles and error bars behind data points represent mean values ± S.E.M. Source data
Extended Data Fig. 4
Extended Data Fig. 4. Immune cell infiltration in NOD islets and effects of cytokine treatment.
a-d, Representative micrographs of mouse pancreases of wild type C57BL/6 J mice (16 weeks of age); young ND NOD mice ( < 7 weeks old; blood glucose: 5.6 mM), adult ND NOD mice ( > 12 weeks of age; blood glucose: 6.1 mM) and T1D NOD mice (blood glucose: 33 mM) as indicated. Scale bar: 50 μm. Representatives of 3 mice of each group. e, qPCR analyses of genes encoding islet cell-specific (Ins1, Gcg, Sst, Pdx1), inflammatory (Ccl2-3, Il1b, Il6, Il10, Cd206, Cd163, Cd168) and ER stress and apoptosis markers (Bip, At4, Chop1, Casp1) after treatment of mouse islets from C57BL/6 J mice for 24 h with a cytokine cocktail (CC). Expression has been normalised to control islets (no cytokines; indicated by dashed horizontal line) (n = 2 using islets from 6 mice). f, Islet insulin, glucagon and somatostatin contents measured with and without CC treatment as indicated. ****p = 1.9 × 10⁻⁹ vs control, two-sided Student’s t-test. g, Insulin secretion measured at 1 mM glucose in islets from C57BL/6 J mice with or without CC treatment as indicated (n = 5 experiments with islets from 4 mice). In dot plots, rectangles behind the data points represent the mean values ± S.E.M. Source data
Extended Data Fig. 5
Extended Data Fig. 5. Impact of T1D on islet urocortin-3 contents and tolbutamide-induced somatostatin secretion.
a, Urocortin-3 (ucn3) contents of islets from C57BL/6 J, young ND NOD, adult ND and adult T1D NOD mice. ***p = 0.004 vs young ND islets; ††p = 0.0036 vs adult ND islets (n = 5-6 experiments with islets from 4–6 mice). Urocortin-3 content in C57BL/6 J islets is also significantly higher than that in adult ND (p = 0.0093) and T1D NOD (p < 0.0001) mouse islets. Statistical significances were evaluated using one-way ANOVA with Tukey post hoc test. b, Effects of tolbutamide on somatostatin secretion in isolated islets from young ND and adult T1D mice. **p = 0.006 and ****p = 5.4 × 10⁻⁷ vs no tolbutamide in the respective group of islets (n = 4–6 experiments with islets from 4 mice for ND and T1D mice), one-sided Student’s t-test. c, Quantitative PCR of Gjd2 expression in islets cultured with CC (n = 4 using islets from 6 mice). Data are normalised to Gjd2 expression in islets incubated without CC. *p = 0.0489 vs control, two-sided Student’s t-test. d, Violin plot of average scaled expression of Gjd2 from single-cell RNA sequencing data of δ-cells from wildtype (n = 298 cells; 2 samples; C57BL/6 J, black) and adult ND NOD (n = 1048 cells; 10 samples; red) mice. logFC = −0.16; ****p = 4.41 × 10⁻⁶, Wilcoxon Rank Sum test. e, Somatostatin secretion at 1 mM glucose in islets of wildtype (C57BL/6 J, black) and adult ND NOD (red) mice. ****p = 4.5 × 10⁻²⁵ vs C57BL/6 J islets (n = 31 and 14 experiments using 4 mice for each group), two-sided Student’s t-test. In dot plots, rectangles and error bars behind data points represent mean values ± S.E.M. Source data
Extended Data Fig. 6
Extended Data Fig. 6. Effects of gap junction inhibitors on islet hormone release.
a, Insulin secretion at 1 mM glucose in the absence and presence of the gap junction inhibitor mefloquine (1 μM) (n = 7 experiments with islets from 4 mice). b-c, KATP channel activity recorded in β-cells at 1 mM glucose in the absence (black) and presence (red) of 1 µM mefloquine (MFQ) as indicated (b). KATP channel activity is reported as conductance (GKATP), which was estimated from the current responses evoked by ±10 mV voltage pulses applied from a holding potential of −70 mV during perforated patch whole-cell measurements in β-cells in intact pancreatic islets (c) (n = 5 experiments). d, Insulin secretion from isolated islets from C57BL/6 J mice at 1 mM glucose in the absence or presence of the gap junction inhibitor carbenoxolone (CBX; 100 µM) as indicated. (n = 14 experiments with islets from 4 mice). e-f, Insulin (e) and somatostatin (f) secretion at 20 mM glucose in the absence and presence of CBX as indicated. ***p = 0.0002 and ****p = 8 × 10⁻⁶ vs no CBX (n = 8 from 4 mice), two-sided Student’s t-test. g, Insulin secretion at 1 mM glucose in islet pretreated or not with CC and in the presence of MFQ or CBX as indicated (n = 6 experiments from 4 mice). In dot plots, rectangles and error bars behind data points represent mean values ± S.E.M. Source data
Extended Data Fig. 7
Extended Data Fig. 7. Electrical coupling and [Ca2+]i in δ-cells.
a-b, [Ca2+]i oscillations recorded in single δ-cells in intact islets from Sst-GCaMP6f mice under control conditions (a) and after pretreatment (1 h) with 1 μM mefloquine (b). Experiments were concluded by increasing extracellular K+ to 70 mM to depolarise the δ-cells. Islets were pretreated with ryanodine (50 μM for 1 h) to minimise the contribution of intracellular Ca2+ release. (a, b) are each representative of 139–143 cells in 6 islets from 2 mice. c, Fraction of spontaneously active δ-cells within intact islets in the absence and presence of 1 µM mefloquine as indicated. *p = 0.019 vs no mefloquine (n = 6 islets obtained from 2 mice), two-sided Student’s t-test. d, Frequency of δ-cell [Ca2+]i oscillations in the absence and presence of 1 μM mefloquine as indicated. *p = 0.042 (139 δ-cells in 6 islets from 2 mice without mefloquine and 143 δ-cells in 6 islets from 2 mice with mefloquine), two-sided Student’s t-test. e, Violin plots of δ-cell [Ca2+]i oscillations in intact islets (240 δ-cells from 2 mice) and in dispersed islet cell preparations (380 δ-cells from 2 mice). *p = 0.038 vs intact islets, two-sided Student’s t-test. In dot plots, rectangles and error bars behind data points represent mean values ± S.E.M. Note stimulation of spontaneous [Ca2+]i oscillations in the presence of the gap junction blocker mefloquine and that the depolarization-induced (high K+-induced) [Ca2+]i increase was not affected by the inhibitor. Source data
Extended Data Fig. 8
Extended Data Fig. 8. Effects of optoinhibition of β-cells on insulin and glucagon secretion.
a, Insulin secretion at 1 and 20 mM glucose in islets from RIP-NpHR mice under control conditions (-) and during optoactivation (+) of NpHR in β-cells. ****p = 2 × 10⁻³⁴ vs 1 mM glucose without NpHR optoactivation and ****p = 3.4 × 10⁻¹⁹ vs 1 mM glucose without NpHR optoactivation. †p = 0.0177 vs 20 mM glucose without NpHR activation (19–22 experiments with islets from 5 mice), two-sided Student’s t-test. b, As in (a) but glucagon secretion was measured. ***p = 0.0006 and ****p = 8.5 × 10⁻⁶ vs 1 mM glucose of respective group. †p = 0.0226 vs 1 mM glucose without NpHR optoactivation (19–21 experiments with islets from 5 mice), two-sided Student’s t-test. In dot plots, rectangles and error bars behind data points represent mean values ± S.E.M. Source data
Extended Data Fig. 9
Extended Data Fig. 9. β-cell membrane potential controls somatostatin secretion.
a, Electrical activity recorded from a β-cell in a control islet. Glucose was varied between 1 and 20 mM glucose as indicated. Representative of 9 δ-cells from 7 control mice. b, As in a but for a β-cell in an islet from hyperglycaemic β-V59M mouse 48 h after induction of the transgene expression with tamoxifen. Representative of 3 δ-cells from 3 mice. c, Membrane potential at 1 and 20 mM glucose in control (o) and induced β-cells in intact islets from β-V59M mice (•) (n = 9 β-cells from 7 control mice and 3 β-cells from 3 β-V59M mice).****p = 1.2 × 10⁻⁷ vs 1 mM glucose in control islets and ***p = 0.0003 vs 1 mM glucose in β-V59M islets (paired one-tailed Student’s t-test); ††††p = 4.2 × 10⁻⁷ vs 20 mM glucose in control β-cells (unpaired one-tailed t-test). d, As in (c) but data for δ-cells (n = 6 δ-cells from 6 control mice and 4 δ-cells from 4 β-V59M mice). **p = 0.009 vs 1 mM glucose in the respective mouse strain for 20 mM glucose and **p = 0.004 for the effect of tolbutamide on δ-cells in β-V59M islets (paired one-tailed t-test). †p = 0.04 vs 20 mM glucose in control δ-cells (unpaired one-tailed t-test). e, Somatostatin secretion in islets from control (non-induced) β-V59M mice under the conditions indicated. ****p = 1.9 × 10⁻⁵ vs 1 mM glucose for 20 mM glucose alone and ****p = 3.7 × 10⁻⁵ vs 1 mM glucose for 20 mM glucose with tolbutamide, two-sided Student’s t-test. Data from 4 mice. f, As in e but using islets from induced β-V59M mice (4 mice). **p = 0.0013, ****p = 3.6 × 10⁻⁸ vs 1 mM glucose; ††††p = 3 × 10⁻⁵ vs 20 mM glucose; ‡‡‡‡p = 4 × 10⁻⁵ vs 20 mM glucose in control islets, two-sided Student’s t-test. In dot plots, rectangles and error bars behind data points represent mean values ± S.E.M. Source data
Extended Data Fig. 10
Extended Data Fig. 10. Islet hormone contents is reduced in T1D.
a-c, Violin plot of islet insulin (a), glucagon (b) and somatostatin (c) content in islets from ND and T1D donors (10 ND and 6 T1D donors for insulin and somatostatin and 20 ND and 6 T1D donors for glucagon). Different colours used for data from each donor. Insets show mean values of individual donors. **p = 0.005, ***p = 0.0005 and ****p < 0.0001 vs ND, two-sided Student’s t-test. d-e, Somatostatin (d) and glucagon secretion (e) at 1 mM glucose in islets from T1D donors in the absence and presence of 1 µM MFQ as indicated. Insets show average data for the individual donors. In dot plots, rectangles and error bars behind data points represent mean values ± S.E.M. Source data

References

    1. Unger, R. H. Glucagon and insulin: a bihormonal system. Compr. Ther.2, 20–26 (1976). - PubMed
    1. Gerich, J. E., Langlois, M., Noacco, C., Karam, J. H. & Forsham, P. H. Lack of glucagon response to hypoglycemia in diabetes: evidence for an intrinsic pancreatic alpha cell defect. Science182, 171–173 (1973). - PubMed
    1. Cryer, P. E. Glycemic goals in diabetes: trade-off between glycemic control and iatrogenic hypoglycemia. Diabetes63, 2188–2195 (2014). - PubMed
    1. Yue, J. T. et al. Amelioration of hypoglycemia via somatostatin receptor type 2 antagonism in recurrently hypoglycemic diabetic rats. Diabetes62, 2215–2222 (2013). - PMC - PubMed
    1. Yue, J. T. et al. Somatostatin receptor type 2 antagonism improves glucagon and corticosterone counterregulatory responses to hypoglycemia in streptozotocin-induced diabetic rats. Diabetes61, 197–207 (2012). - PMC - PubMed

LinkOut - more resources