. 2024 Oct;10(10):1514-1531.
doi: 10.1038/s41477-024-01796-8. Epub 2024 Sep 23.

The Arabidopsis U1 snRNP regulates mRNA 3'-end processing

Affiliations

The Arabidopsis U1 snRNP regulates mRNA 3'-end processing

Anchilie F Mangilet et al. Nat Plants. 2024 Oct.

Abstract

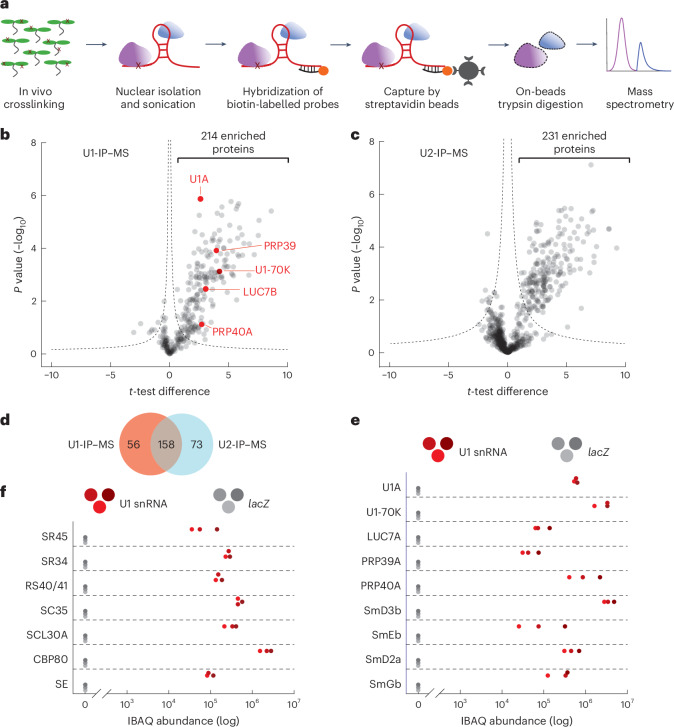
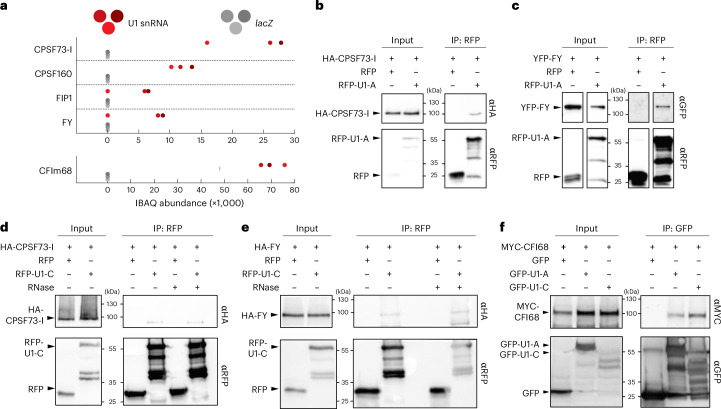
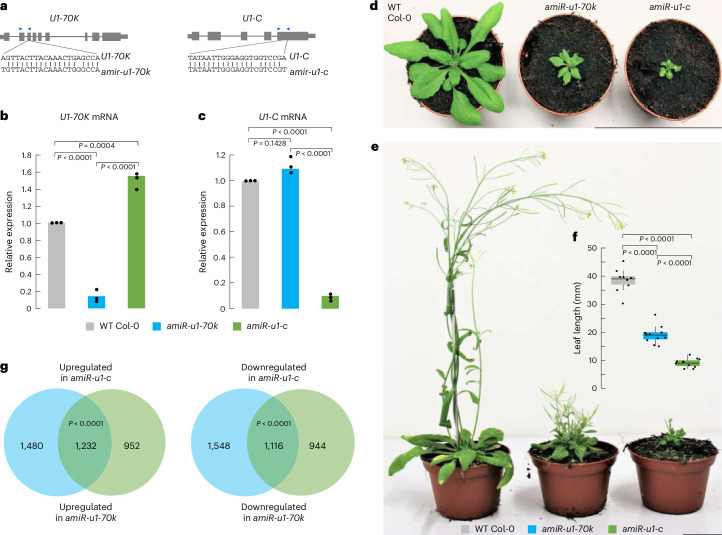
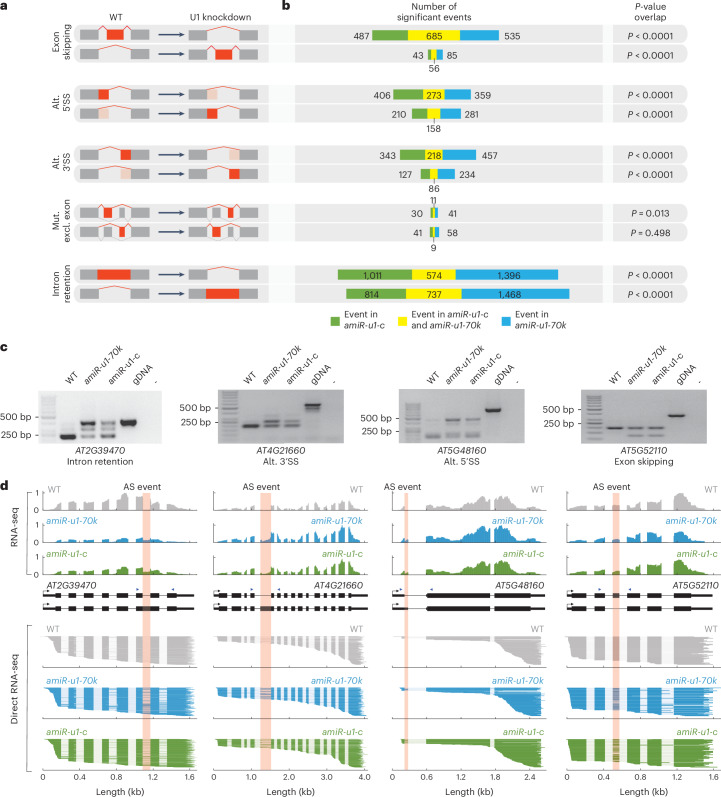
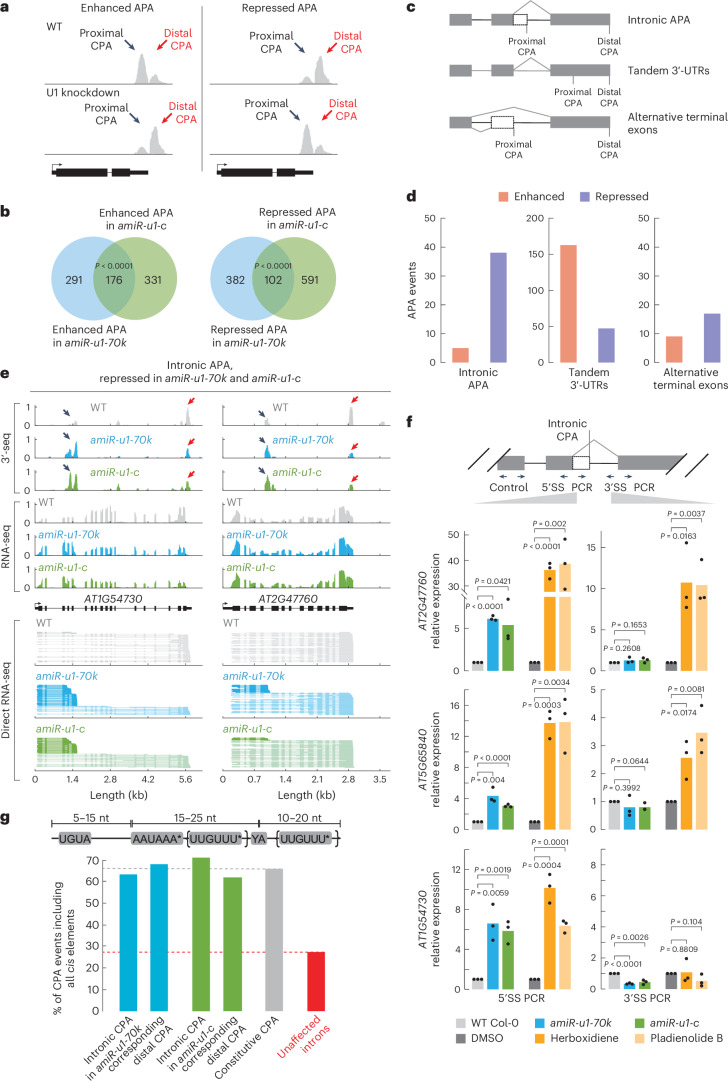
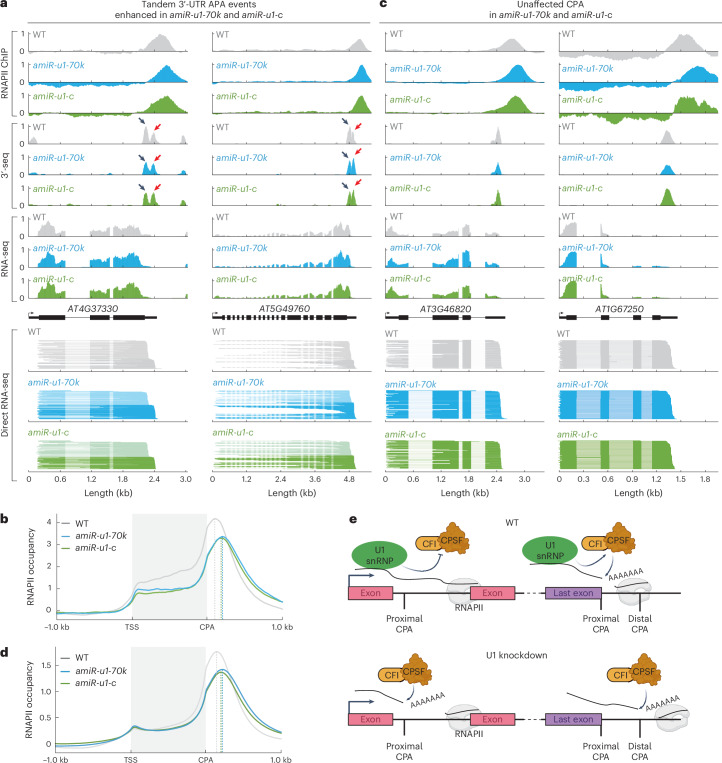
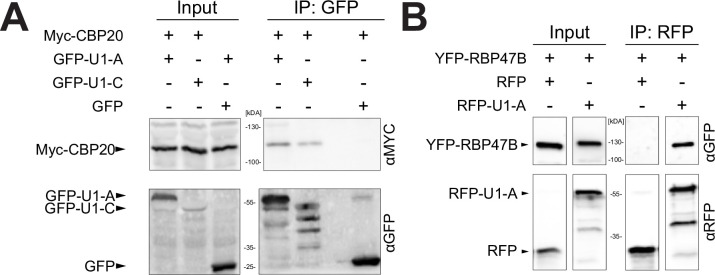
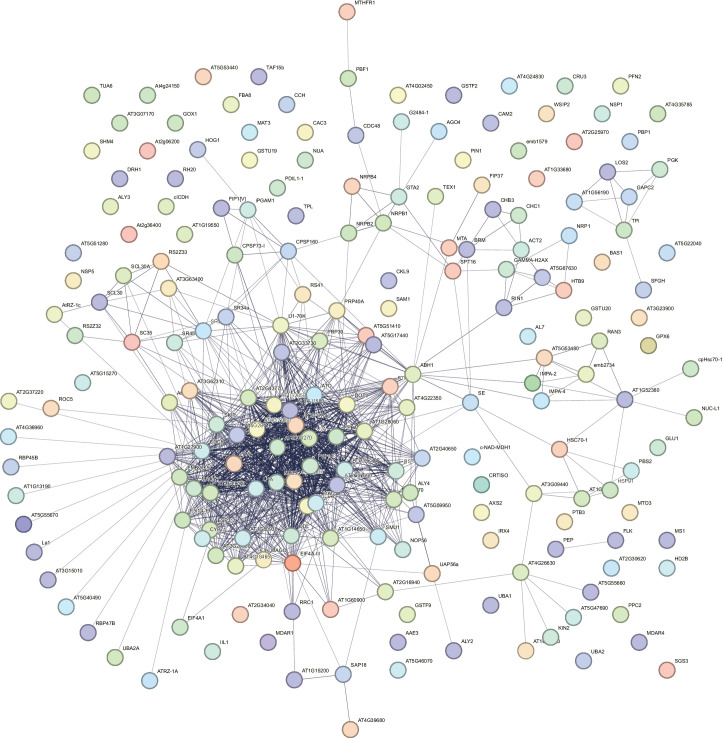
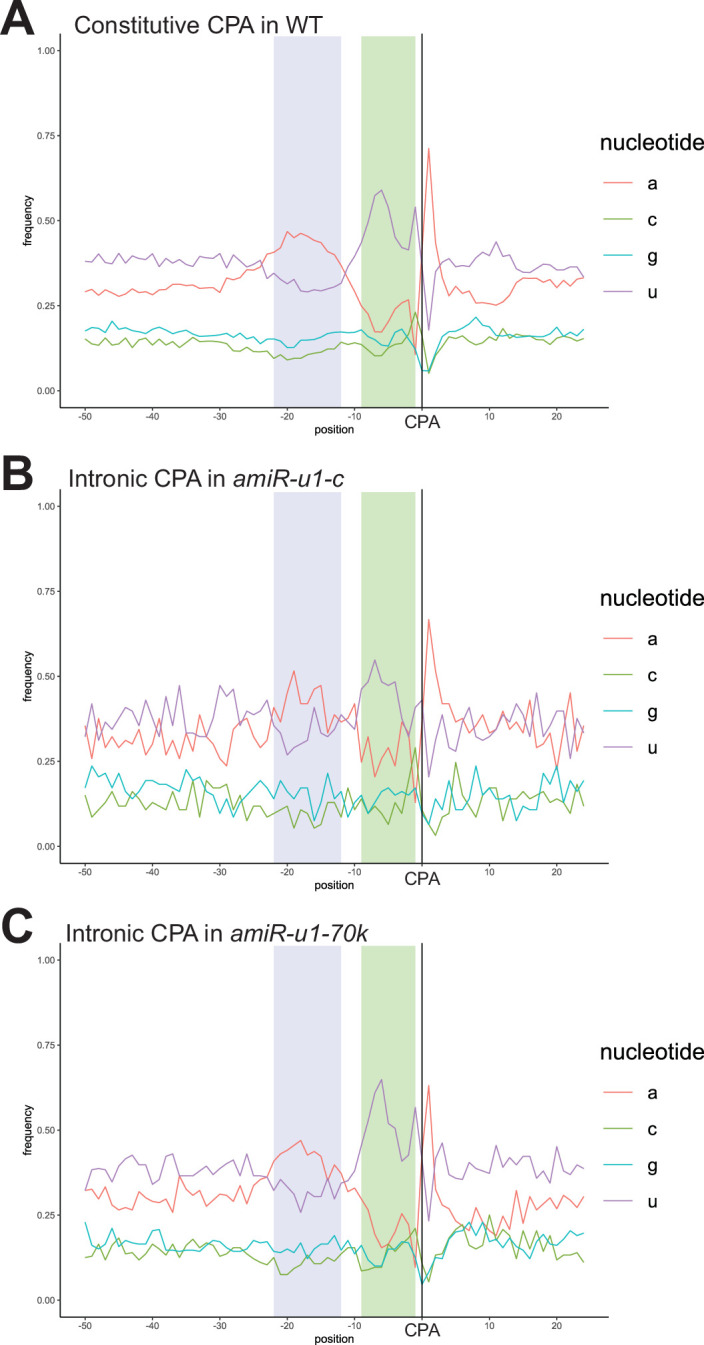
The removal of introns by the spliceosome is a key gene regulatory mechanism in eukaryotes, with the U1 snRNP subunit playing a crucial role in the early stages of splicing. Studies in metazoans show that the U1 snRNP also conducts splicing-independent functions, but the lack of genetic tools and knowledge about U1 snRNP-associated proteins have limited the study of such splicing-independent functions in plants. Here we describe an RNA-centric approach that identified more than 200 proteins associated with the Arabidopsis U1 snRNP and revealed a tight link to mRNA cleavage and polyadenylation factors. Interestingly, we found that the U1 snRNP protects mRNAs against premature cleavage and polyadenylation within introns-a mechanism known as telescripting in metazoans-while also influencing alternative polyadenylation site selection in 3'-UTRs. Overall, our work provides a comprehensive view of U1 snRNP interactors and reveals novel functions in regulating mRNA 3'-end processing in Arabidopsis, laying the groundwork for understanding non-canonical functions of plant U1 snRNPs.


Conflict of interest statement

The authors declare no competing interests.

Figures

Fig. 1
Fig. 1. Identification of Arabidopsis U1 snRNP-associated proteins by U1-IP–MS.
a, Schematic representation of the U1-IP–MS experiment. b,c, Analysis of U1 snRNA-associated (b) and U2 snRNA-associated (c) proteins identified by IP–MS. Volcano plot of three biological replicates showing significantly enriched proteins immunoprecipitated with a U1 (b) or U2 (c) antisense oligonucleotide compared with a lacZ oligonucleotide. For this, a two-sided t-test was performed between U1-IP–MS and lacZ-IP–MS (b) and between U2-IP–MS and lacZ-IP–MS (c). The hyperbolic curve indicates the significant threshold with an FDR of 0.04 for U1-IP–MS and 0.05 for U2-IP–MS. Known U1-specific proteins are highlighted in red (b). d, Venn diagram depicting the overlap between significantly enriched proteins in U1-IP–MS and U2-IP–MS experiments. e,f, Abundance of specific proteins in U1-IP–MS experiments. The three red and grey dots represent iBAQ values of three biological replicates using the U1 or the lacZ antisense oligonucleotide, respectively. Proteins known to be part of the U1 snRNP (e) and selected proteins that function in splicing and RNA processing (f) are shown.
Fig. 2
Fig. 2. The U1 snRNP core components, U1-A and U1-C, associate with mRNA cleavage and polyadenylation factors.
a, Abundance of CPAFs in U1-IP–MS experiments. The three red and grey dots represent iBAQ values of three biological replicates using the U1 or the lacZ antisense oligonucleotide, respectively. b,c, U1-A translationally fused to RFP was co-expressed with HA-tagged CFSF73-I (b) or YFP-tagged FY (c) in N. benthamiana plants for transient protein expression. RFP alone served as a negative control. Proteins were isolated and immunoprecipitated using an RFP-affinity matrix. Input and immunoprecipitated fractions (IP) were subjected to protein blot analysis using RFP-, HA- and G/YFP-specific antibodies. Each experiment was repeated two times independently with similar results. d,e, U1-C translationally fused to RFP was co-expressed with HA-tagged CFSF73-I (d) or FY (e) in N. benthamiana plants for transient protein expression. RFP alone served as a negative control. Proteins were isolated and immunoprecipitated using an RFP-affinity matrix in the presence or absence of RNase A. Input and immunoprecipitated fractions (IP) were subjected to protein blot analysis using RFP- and HA-specific antibodies. Each experiment was repeated three times independently with similar results. f, MYC-CFI68 was transiently co-expressed with GFP-U1-A, GFP-U1-C or GFP in N. benthamiana plants. After immunoprecipitation using a GFP-affinity matrix, the isolated proteins were subjected to protein blot analysis. GFP- and MYC-specific antibodies were used for the detection of the tagged proteins. Each experiment was repeated three times independently with similar results. Source data
Fig. 3
Fig. 3. Knockdown of two U1 snRNP core components, U1-70K and U1-C, drastically affects plant development and gene expression.
a, Gene models of U1-70K and U1-C and regions used for the design of amiRNAs. The blue arrowheads indicate the position of PCR primers used for RT–qPCR in Fig. 2b,c. b,c, RT–qPCR analysis of U1-70K (b) and U1-C (c) levels in 7-day-old WT, amiR-u1-70k and amiR-u1-c seedlings. The bars indicate the average relative expression in three biological replicates and the dots represent the three independent measurements. Statistical significance was tested using one-sided analysis of variance followed by Tukey’s honestly significant difference test. d,e, Phenotypes of WT, amiR-u1-70k and amiR-u1-c plants grown for 21 days (d) or 56 days (e) under long-day (16 h light/8 h darkness) conditions. f, Leaf length of WT, amiR-u1-70k and amiR-u1-c plants, measured after 21 days. In this boxplot, the dots represent the individual leaf length measurements (at least ten plants for each genotype) and the black lines inside the boxes represent the median length. The upper and lower boundaries are indicated by the coloured boxes showing the 25th and 75th quartiles, and the black whiskers represent the 5th and 95th percentiles. Statistical significance was tested using one-sided analysis of variance followed by Tukey’s honestly significant difference test for pairwise comparison. g, Venn diagrams depicting the overlap of differentially expressed genes in amiR-u1-70k and amiR-u1-c compared with WT. Expression was determined by RNA-seq and differentially expressed genes were considered as all genes that significantly differed between the WT and U1 knockdown line (Padj < 0.05). Significance was tested using one-sided hypergeometric overlap test.
Fig. 4
Fig. 4. Knockdown of U1-70K or U1-C causes overlapping splicing defects.
a,b, Changes in the splicing pattern were calculated on the basis of RNA-seq data from WT (a) and amiR-u1-70k and amiR-u1-c (b) plants using rMATS. Splicing changes were subcategorized into exon skipping, alternative (alt.) 5′SS, alternative 3′SS, mutually exclusive exons (mut. excl. exon) and intron retention. A schematic representation of the different splicing changes is shown in a. The numbers of significantly differential alternative splicing events are shown. Significance of overlaps in splicing changes in amiR-u1-70k and amiR-u1-c plants was tested using one-sided hypergeometric overlap test. c, RT–PCR analysis of selected alternative splicing events detected in the RNA-seq dataset. Primers used for amplification were designed to flank the splicing event. Position of primers is depicted by blue arrowheads in d. d, ONT direct RNA-seq reads aligned to the genes that produced alternative spliced RNAs (c). The coverage plot of one representative replicate of the RNA-seq dataset used for rMATS analysis (a,b) is shown. Pink boxes indicate the alternative splicing (AS) events detected by rMATS.
Fig. 5
Fig. 5. The U1 snRNP regulates alternative polyadenylation in Arabidopsis.
a, A schematic representation of enhanced and repressed APA events. In enhanced APA events, the proximal CPA site is preferentially utilized. In repressed APA events, the distal CPA site is preferentially utilized. Black arrows indicate the proximal CPA and red arrows indicate the distal CPA. b, Polyadenylation sites were detected by 3′-end sequencing of RNAs (3′-seq) experiments using RNA isolated from 7-day-old WT, amiR-u1-70k and amiR-u1-c seedlings. Venn diagrams depict the overlap of enhanced or repressed APA events in amiR-u1-70k and amiR-u1-c when compared with WT. Significance was tested using a one-sided hypergeometric overlap test. c, A schematic representation of three different types of APA: intronic APA, tandem 3′-UTRs and alternative terminal exons. d, Number of different APA events detected in both amiR-u1-70k and amiR-u1-c plants, when compared with WT. Intronic APA, tandem 3′-UTR and alternative terminal exons were further divided into enhanced and repressed events. e, Two examples of intronic APA events that are repressed in amiR-u1-70k and amiR-u1-c plants. The figure depicts the gene models and the corresponding coverage plots for 3′-seq, RNA-seq and direct RNA-seq. f, RT–qPCR analysis of 7-day-old WT, amiR-u1-70k and amiR-u1-c seedlings, or WT seedling grown in liquid culture for 7 days and treated with DMSO (mock), berboxidiene or pladienolide B. PCR was performed with oligonucleotides spanning the 5′SS or 3′SS and results were normalized to an internal control. The bars indicate the average relative expression in three biological replicates and the dots represent the three independent measurements. A one-sided t-test was applied. g, Analysis of the co-occurrence of three specific cis-elements in different genomic features. Existence of UGUA, AAUAAA (allowing one mismatch except AAAAAA) and a UUGUUU motif (allowing one mismatch except UUUUUU) before or after the cleavage sites were analysed. Genomic features were chosen as follows: introns that are pCPAed in amiR-u1-70k or amiR-u1-c (and the corresponding distal CPA site), CPA sites in genes exhibiting only a single CPA site (constitutive CPA) and all introns that are not pCPAed (unaffected introns).
Fig. 6
Fig. 6. The U1 snRNP affects the distribution of RNA polymerase II at the 3′-end of genes.
a, Two examples of a tandem 3′-UTR APA event enhanced in amiR-u1-70k and amiR-u1-c. The figure depicts the gene models and the corresponding coverage plots for polymerase II association (RNAPII ChIP), 3′-seq, RNA-seq and direct RNA-seq. b, Metaplot analysis of RNAPII binding to all genes exhibiting enhanced tandem CPA-site usage in WT, amiR-u1-70k and amiR-u1-c plants. c, Two examples of genes that exhibit a shift in RNAPII accumulation at the 3′-end, but the mRNAs of which are not subjected to APA. The figure depicts the gene models and the corresponding coverage plots for polymerase II association (RNAPII ChIP), 3′-seq, RNA-seq and direct RNA-seq. d, Metaplot analysis of RNAPII binding to all genes in WT, amiR-u1-70k and amiR-u1-c plants. e, Proposed model for the function of the U1 snRNP in RNA 3′ processing. The U1 snRNP associates with CPAFs. These interactions prevent premature intronic polyadenylation or ensure the usage of proximal polyadenylation sites in the last exons. In the absence of U1 snRNP function, intronic polyadenylation occurs and more distal polyadenylation sites are utilized in the last exons. Panel created with BioRender.com.
Extended Data Fig. 1
Extended Data Fig. 1. Interaction test between U1 snRNP components and CBP20 and RBP47B.
a: U1-A or U1-C translationally fused to GFP was co-expressed with MYC-tagged CBP20 in Nicotiana benthamiana plants for transient protein expression. GFP alone served as a negative control. Proteins were isolated and immunoprecipitated using a GFP-affinity matrix. Input and immunoprecipitated fractions (IP) were subjected to protein blot analysis using GFP- or –MYC specific antibodies. Each experiment was repeated three times independently with similar results. b: U1-A translationally fused to RFP was co-expressed with YFP-tagged RBP47 in Nicotiana benthamiana plants for transient protein expression. RFP alone served as a negative control. Proteins were isolated and immunoprecipitated using an RFP-affinity matrix. Input and immunoprecipitated fractions (IP) were subjected to protein blot analysis using RFP- or -YFP specific antibodies. Each experiment was repeated two times independently with similar results. Source data
Extended Data Fig. 2
Extended Data Fig. 2. String analysis reveals known interactions between significantly enriched proteins in the U1-IP-MS experiment.
We applied the following parameter for the String analysis: interaction sources: Textmining, Experiments, Databases, minimum required interaction score: high confidence.
Extended Data Fig. 3
Extended Data Fig. 3. miRNA are not widely differentially expressed in U1 knockdown lines.
a, b: miRNAs expression analysis by small RNA-seq from WT, amiR-u1-70k, and amiR-u1-c plants. Volcano plots show differentially expressed miRNAs in amiR-u1-70k (a) or amiR-u1-c (b) compared to WT Col-0 plants using three biological replicates. A total of 178 miRNAs were analyzed. Grey dots depict miRNAs not significantly changed (n.s.), green dots depict miRNAs with a log2 fold change ≥ 1, blue dots depict miRNAs with an FDR ≤ 0.05, and red dots depict miRNAs with a log2 fold change ≥ 1 and an FDR ≤ 0.05.
Extended Data Fig. 4
Extended Data Fig. 4. U1-C expression affect the splicing of U1-70K.
a-c: The figure depicts the gene models of U1-70K (a), U1-C (b) and U1-A (c) and the corresponding RNA-seq coverage plots in WT, amiR-u1-70k, and amiR-u1-c. The red line indicates an intron in U1-70K known to be subjected to alternative splicing.
Extended Data Fig. 5
Extended Data Fig. 5. Overlap between differentially expressed genes and differentially spliced genes in amiR-u1-70k, and amiR-u1-c.
Venn digramms depict the overlap between differentially expressed genes in amiR-u1-70k, and amiR-u1-c lines and differentially spliced genes found in amiR-u1-70k, and amiR-u1-c. Splicing changes were subcategorized into exon skipping, alternative 5′splice site (alt. 5′SS), alternative 3′splice site (alt. 3′SS), mutually exclusive exons (mut. excl. exon), and intron retention.
Extended Data Fig. 6
Extended Data Fig. 6. APA events in amiR-u1-70k and amiR-u1-c plants.
Number of different APA events detected in amiR-u1-70k and amiR-u1-c plants, when compared to WT. Tandem 3′UTRs, intronic APA, and alternative terminal exons were further divided into enhanced and repressed events. The overlap of the different APA events is depicted in Fig. 5e.
Extended Data Fig. 7
Extended Data Fig. 7. Nucleotide composition around CPA sites.
a-c: The plots depict the nucleotide composition 50 nucleotide downstream and 25 nucleotides upstream of CPA sites for constitutive CPA sites in WT plants (a), intronic CPA sites in amiR-u1-c (b) and intronic CPA sites in amiR-u1-70k (c). An A-rich region (probably reflecting the PAS, highlighted in blue) and an U-rich region (probably reflecting the DSE highlighted in green) are marked.

References

    1. Will, C. L. & Luhrmann, R. Spliceosome structure and function. Cold Spring Harb. Perspect. Biol.3, a003707 (2011). - PMC - PubMed
    1. Chen, W. & Moore, M. J. Spliceosomes. Curr. Biol.25, R181–R183 (2015). - PubMed
    1. Kondo, Y., Oubridge, C., van Roon, A. M. & Nagai, K. Crystal structure of human U1 snRNP, a small nuclear ribonucleoprotein particle, reveals the mechanism of 5′ splice site recognition. eLife4, e04986 (2015). - PMC - PubMed
    1. Li, Q. Q., Liu, Z., Lu, W. & Liu, M. Interplay between alternative splicing and alternative polyadenylation defines the expression outcome of the plant unique OXIDATIVE TOLERANT-6 gene. Sci. Rep.7, 2052 (2017). - PMC - PubMed
    1. Plaschka, C., Lin, P. C., Charenton, C. & Nagai, K. Prespliceosome structure provides insights into spliceosome assembly and regulation. Nature559, 419–422 (2018). - PMC - PubMed

Publication types

MeSH terms

LinkOut - more resources