Clinical Trial
. 2024 Nov;30(11):3261-3271.
doi: 10.1038/s41591-024-03235-9. Epub 2024 Sep 23.

Molecular profiling of BRAF-V600E-mutant metastatic colorectal cancer in the phase 3 BEACON CRC trial

Affiliations
Clinical Trial

Molecular profiling of BRAF-V600E-mutant metastatic colorectal cancer in the phase 3 BEACON CRC trial

Scott Kopetz et al. Nat Med. 2024 Nov.

Abstract

The BEACON CRC study demonstrated that encorafenib (Enco)+cetuximab (Cetux)±binimetinib (Bini) significantly improved overall survival (OS) versus Cetux + chemotherapy in previously treated patients with BRAF-V600E-mutant mCRC, providing the basis for the approval of the Enco+Cetux regimen in the United States and the European Union. A greater understanding of biomarkers predictive of response to Enco+Cetux±Bini treatment is of clinical relevance. In this prespecified, exploratory biomarker analysis of the BEACON CRC study, we characterize genomic and transcriptomic correlates of clinical outcomes and acquired resistance mechanisms through integrated clinical and molecular analysis, including whole-exome and -transcriptome tissue sequencing and circulating tumor DNA genomic profiling. Tumors with higher immune signatures showed a trend towards increased OS benefit with Enco+Bini+Cetux. RAS, MAP2K1 and MET alterations were most commonly acquired with Enco+Cetux±Bini, and more frequent in patients with a high baseline cell-cycle gene signature; baseline TP53 mutation was associated with acquired MET amplification. Acquired mutations were subclonal and polyclonal, with evidence of increased tumor mutation rate with Enco+Cetux±Bini and mutational signatures (SBS17a/b). These findings support treatment with Enco+Cetux±Bini for patients with BRAF-V600E-mutant mCRC and provide insights into the biology of response and resistance to MAPK-pathway-targeted therapy. ClinicalTrials.gov registration: NCT02928224.


Conflict of interest statement

Competing interests S.K.: Stock and Other Ownership Interests: Iylon, Lutris, MolecularMatch, Navire. Consulting or Advisory Role: AbbVie, Amal Therapeutics, AstraZeneca/MedImmune, Bayer Health, Bicara Therapeutics, Boehringer Ingelheim, Boston Biomedical, Carina Biotech, Daiichi Sankyo, EMD Serono, Endeavor BioMedicines, Flame Biosciences, Genentech, Gilead Sciences, GSK, HalioDx, Holy Stone Healthcare, Inivata, Ipsen, Iylon, Jacobio, Jazz Pharmaceuticals, Lilly, Lutris, Merck, Mirati Therapeutics, Natera, Novartis, Numab, Pfizer, Pierre Fabre, Redx Pharma, Repare Therapeutics, Servier, Xilis. Research Funding: Amgen (Inst), Array BioPharma (Inst), Biocartis (Inst), Daiichi Sankyo (Inst), EMD Serono (Inst), Genentech/Roche (Inst), Guardant Health (Inst), Lilly (Inst), MedImmune (Inst), Novartis (Inst), Sanofi (Inst). D.A.M.: Employment: Formerly Pfizer. Stock and Other Ownership Interests: Pfizer. J.P.: Employment: Formerly Pfizer. Stock and Other Ownership Interests: Pfizer. F.C.: Consulting or Advisory Role: Amgen, Bayer, Merck KGaA, Pfizer, Roche/Genentech. Research Funding: Amgen (Inst), Bayer (Inst), Bristol Myers Squibb (Inst), Ipsen (Inst), Merck KGaA (Inst), MSD (Inst), Roche/Genentech (Inst), Servier (Inst), Symphogen (Inst). J.D.: Consulting or Advisory Role: Amgen (Inst), Bayer, BeiGene, Daiichi Sankyo, Eisai, GSK, Merck KGaA, Pierre Fabre. Research Funding: AstraZeneca/MedImmune (Inst), BeiGene (Inst), Bionomics (Inst), Bristol Myers Squibb (Inst), GSK (Inst), Lilly (Inst), Novartis (Inst), Roche (Inst). E.V.C.: Consulting or Advisory Role: AbbVie, Agenus, ALX, Amgen, Arcus Biosciences, Astellas Pharma, AstraZeneca, Bayer, BeiGene, BioNTech, Boehringer Ingelheim, Bristol Myers Squibb, Daiichi Sankyo, Debiopharm, ElmediX, Eisai, GSK, Hookipa Biotech, Incyte, Ipsen, Lilly, Merck Sharp & Dohme, Merck KGaA, Mirati, Novartis, Nordic, Pierre Fabre, Pfizer, Roche, Seagen, Servier, Simcere, Takeda, Taiho Pharmaceutical, Terumo. H.S.W.: Consulting or Advisory Role: Amgen, Bayer, Bristol Myers Squibb (Celgene), Boehringer Ingelheim (DMC), BTG, EXACT Therapeutics, Erytech Pharma, Incyte, Merck KGaA, Oaktree Life Sciences, OncoSil, Pfizer, Pierre Fabre, Roche/Genentech, Seagen, Servier, Shire, Sirtex Medical, Takeda (Hutchinson Med), Zymeworks. Research Funding: Merck KGaA (Inst), MSD (Inst), Pfizer (Inst), Sirtex Medical (Inst). T.Y.: Honoraria: Bayer Yakuhin, Chugai Pharma, Merck KGaA, MSD, Ono Pharmaceutical, Sumitomo Corp., Takeda. Research Funding: Amgen (Inst), Boehringer Ingelheim (Inst), Chugai Pharma (Inst), Daiichi Sankyo Co., Ltd. (Inst), Eisai, FALCO Biosystems, Genomedia (Inst), Molecular Health, MSD (Inst), Nippon Boehringer Ingelheim, Ono Pharmaceutical (Inst), Pfizer (Inst), Roche Diagnostics, Sanofi (Inst), Sumitomo Dainippon (Inst), Sysmex (Inst), Taiho Pharmaceutical (Inst). H.S.: Employment: Pfizer. Stock and Other Ownership Interests: Pfizer. X.Z.: Employment: Pfizer. Stock and Other Ownership Interests: Pfizer. Patents, Royalties, Other Intellectual Property: Johns Hopkins University. P.H.: Employment: Pfizer. Stock and Other Ownership Interests: Pfizer. T.X.: Employment: Pfizer. Stock and Other Ownership Interests: Pfizer. R.Y.: Consulting or Advisory Role: Array BioPharma/Pfizer, Mirati Therapeutics, Zai Lab, Amgen. Research Funding: Array BioPharma (Inst), Boehringer Ingelheim (Inst), Mirati Therapeutics (Inst), Pfizer (Inst), Daiichi Sankyo (Inst). J.T.: Consulting or Advisory Role: Array BioPharma, AstraZeneca, Bayer, Boehringer Ingelheim, Chugai Pharma, Daiichi Sankyo, F. Hoffmann-La Roche, Genentech, HalioDx, Hutchison MediPharma, Ikena Oncology, Inspirna Inc., IQVIA, Lilly, Menarini, Merck Serono, Merus, Mirati Therapeutics, MSD, NeoPhore, Novartis, Ona Therapeutics, Orion Biotechnology, Peptomyc, Pfizer, Pierre Fabre, Samsung Bioepis, Sanofi, Scandion Oncology, Scorpion Therapeutics, Seagen Inc., Servier, Taiho Pharmaceutical, Tessa Therapeutics, TheraMyc. Other Relationship: Amgen, Array Biopharma, BeiGene, Boehringer Ingelheim, BMS, Cancer Research UK, Celgene, Debiopharm, F. Hoffman-La Roche, Fundación Científica de la Asociación Española Contra el Cáncer, Genentech, HalioDX, Hutchinson Medipharma, Imedex, Janssen-Cilag, MedImmune, Medscape, Menarini, Merck Health KGaA, MJH Life Sciences, MSD, Merus, Mirati, Novartis, Oniria Therapeutics, PeerView Institute for Medical Education, Pfizer, PharmaMar, Physicans’ Education Resource, Sanofi-Aventis, Servier, Taiho Pharmaceutical.

Figures

Fig. 1
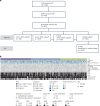
Fig. 1. Study cohorts for BEACON CRC biomarker analyses.
a, Patient flow in analysis sets. aFull analysis set included patients who were enrolled to receive randomized treatment. bSafety analysis set included patients who received one or more dose of any trial drug and had one or more post-treatment safety assessment. cBiomarker analysis set included patients who had baseline tumors analyzed by WTS or WES or who were analyzed for ctDNA at baseline. dBiomarker analysis subsets were not mutually exclusive. b, Heatmap of patient characteristics and molecular profiling coverage in the biomarker analysis set, across treatment arms. CEA, carcinoembryonic antigen; CRP, C-reactive protein; ECOG PS, Eastern Cooperative Oncology Group performance status; tx, treatment; ULN, upper limit of normal.
Fig. 2
Fig. 2. Mutational profiling of patients with BRAF-V600E-mutant mCRC in BEACON CRC.
a, Oncoprint showing frequency of cancer gene mutations in baseline tumors profiled by the GuardantOMNI panel, as well as TMB and MSI status (top bars), across treatment arms determined using WES. BRAF alterations included V600E and other alterations. The MSS group also included patients who were MSI-low. b, Baseline tumor size (left panel) and baseline ctDNA maxVAF (right panel) by baseline ctDNA BRAF-V600E status. P values were based on the Wilcoxon rank-sum test (two-sided). The boxes show medians and IQR; the whiskers represent 1.5 × IQR. c, Kaplan–Meier plots of OS by ctDNA BRAF-V600E VAF status (split on median) in each treatment arm. P values (two-sided Wald test) were based on the Cox model without adjustment for baseline covariates. d, Distribution of BM1 and BM2 subtypes across CMS subgroups. aThe ‘not detected’ group included patients with no ctDNA detected. bPatients with no ctDNA detected were excluded from the analysis. cThe BM1 subtype is characterized by high KRAS/mTOR/AKT/4EBP1, epithelial–mesenchymal transition (EMT) and immune infiltration, whereas the BM2 subtype is characterized by cell-cycle checkpoint dysregulation. dCMS1 is characterized by MSI and immune patterns and enrichment for BRAF mutations; CMS2 by chromosomal instability and WNT activation; CMS3 by metabolic pattern and enrichment for KRAS mutations and CMS4 by EMT, angiogenesis and stromal infiltration.
Fig. 3
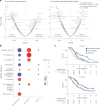
Fig. 3. Association between OS tumor baseline mutational status.
Forest plots of HRs for OS with Enco+Cetux (top panel) or Enco+Bini+Cetux (bottom panel) versus control in subgroups defined by specific gene mutations, MSI status or TMB levels. The diamonds show HRs and the lines show 95% CI. P values for interaction (two-sided Wald test) were based on the Cox model without adjustment for baseline covariates. aThe MSS subgroup included patients with MSI-low; those with inconclusive results were excluded from the analysis.
Fig. 4
Fig. 4. Immune gene associations with OS benefit from Enco+Cetux±Bini.
a, Associations between OS and immune gene expression (scaled) were determined by Cox proportional hazards models (two-sided Wald test). Genes in the top quartile of variance in expression (based on IQR and measured in log2(TPM)) were tested. b, GSEA hallmark genesets; highest average absolute normalized enrichment score (NES) across arms are shown; point size indicates Benjamini–Hochberg-adjusted P values from permutation testing. c, Kaplan–Meier plots of OS by cytolytic score (split on median). P values for interaction (two-sided Wald test) were based on Cox proportional hazard models with and without adjustment for baseline covariates.
Fig. 5
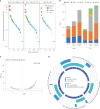
Fig. 5. Top acquired resistance alterations in BEACON CRC.
a, Status of selected gene alterations (analyzed by ctDNA genomic profiling) at EoT versus baseline and survival outcomes by treatment arm. b, Mutational landscape of KRAS, NRAS and MAP2K1 variants in the Enco+Cetux and Enco+Bini+Cetux arms.
Fig. 6
Fig. 6. Characterization of acquired putative resistance alterations.
a, Subgroups based on rate of acquiring resistance. Poisson mixture model was used to identify the low-, medium- and high-rate subgroups. b, Number of mutations grouped by SBS mutational signature at C1D1 and EoT. c, GSEA against hallmark reactome signatures based on the association between baseline gene expression and acquiring one or more top alteration at EoT. The dashed red line corresponds to an adjusted P value of 0.05 from GSEA. d, Association of top acquired alterations with baseline TP53 mutation status and GSEA hallmark cell-cycle signature (split on median) (OR = 4.3; P = 0.006); Benjamini–Hochberg-adjusted P values (two-sided) are based on permutation tests (two-sided). aThe value 0 was coded as half of the smallest nonzero value, 0.03, for display.
Extended Data Fig. 1
Extended Data Fig. 1. Genomic ctDNA profiling of baseline plasma samples.
*Multiple mutations were defined as genes with ≥ 2 alterations of different categories (for example missense mutation + amplification). ctDNA, circulating tumor DNA; MSI-H, microsatellite instability-high; mut; mutation; TMB, tumor mutational burden.
Extended Data Fig. 2
Extended Data Fig. 2. Association between BRAF V600E VAF and ctDNA maxVAF at baseline.
a, Percentages of baseline BRAF V600E positivity across ctDNA maxVAF subgroups. The low maxVAF subgroup included patients with ctDNA maxVAF below the first quartile (2.01%); the high maxVAF subgroup included patients with ctDNA maxVAF in the third quartile (33.77%) and above; the medium maxVAF subgroup included the remaining patients. P-value was calculated based on logistic regression analysis (two-sided Wald test). b, Pearson correlation and the associated two-sided P value of the association between BRAF V600E VAF and ctDNA maxVAF at baseline. Only patients with BRAF V600E ctDNA detected were included in the analysis involving VAF. Silent mutations, clonal hematopoiesis of indeterminate potential, and alterations from genes with copy number alterations were excluded. ctDNA, circulating tumor DNA; max, maximum; VAF, variant allele frequency.
Extended Data Fig. 3
Extended Data Fig. 3. Kaplan–Meier plots of OS by ctDNA maxVAF status in each treatment arm.
ctDNA maxVAF was categorized as ≤ or > the median of 11.005. Cox proportional hazard models with or without adjustment of baseline covariates (ECOG performance status, C-reactive protein, number of organs, tumor status, cetuximab source, and prior use of irinotecan at randomization) were used. A two-sided Wald test was used for P value of interaction terms, where ctDNA maxVAF was regarded as a continuous variable. Bini, binimetinib; Cetux, cetuximab; CI, confidence interval; ctDNA, circulating tumor DNA; ECOG, Eastern Cooperative Oncology Group; Enco, encorafenib; HR, hazard ratio; max, maximum; OS, overall survival; VAF, variant allele frequency.
Extended Data Fig. 4
Extended Data Fig. 4. Association between OS and CRC subtypes.
Forest plots of HRs for OS with Enco+Cetux (top panel) or Enco+Bini+Cetux (bottom panel) vs control in subgroups defined by BM subtypes and CMS. The diamonds show HRs and the lines show 95% CI. P values for interaction (two-sided Wald test) were based on the Cox model without adjustment for baseline covariates. *The CMS2 subgroup was excluded due to small sample size.
Extended Data Fig. 5
Extended Data Fig. 5. Immune gene associations with OS benefit in each treatment arm.
a, Associations between OS and immune gene expression (scaled) in each treatment arm were determined by Cox proportional hazards models (two-sided Wald test). Genes in the top quartile of variance in expression (based on IQR and measured in log2[TPM]) were tested. Genes showing an interaction (unadjusted P value < 0.001) for Enco+Cetux vs Control are shown with blue circles and for Enco+Cetux vs Enco+Bini+Cetux (top panel) are shown as red dots across panels. b, Enrichment plots from GSEA against the hallmark IFN-γ gene signature in each treatment arm.
Extended Data Fig. 6
Extended Data Fig. 6. Correlation between tumor immune status and cytolytic score.
a, Correlation between cytolytic score and ssGSEA scores for the IFN-γ response (top panel), allograft rejection (middle panel) and inflammatory response (bottom panel) hallmark signatures; r denotes Pearson correlation. Data points are color coded based on CMS classification. b, Pearson correlation between cytolytic score and sample scores for multiple metrics of CD8+ T-cell infiltration and gene signatures of immune infiltration. CMS, consensus molecular subtypes; CYT, cytolytic; ssGSEA, single-sample gene set enrichment analysis; ICR, immune constant of rejection.
Extended Data Fig. 7
Extended Data Fig. 7. Kaplan–Meier plots of PFS by cytolytic score between and within each treatment arm.
a, Kaplan–Meier plots of PFS by cytolytic score between treatment arms (inter-arm comparison). b, Kaplan–Meier plots of PFS by cytolytic score within each treatment arm (intra-arm comparison). Tumors were categorized as cytolytic high or low, defined as score > and ≤ the median value of 3.11, respectively. Cox proportional hazard models with or without adjustment of baseline covariates (ECOG performance status, C-reactive protein, number of organs, tumor status, cetuximab source, and prior use of irinotecan at randomization) were used. A two-sided Wald test was used for P value of interaction terms, where cytolytic score was regarded as a continuous variable. Bini, binimetinib; Cetux, cetuximab; CYT, cytolytic; ECOG, Eastern Cooperative Oncology Group; Enco, encorafenib; HR, hazard ratio; PFS, progression-free survival.
Extended Data Fig. 8
Extended Data Fig. 8. Abundance of immune cell types and fibroblasts (estimated using xCell) by CYT score and CRC subtype.
Bini, binimetinib; BM, BRAF mutant; Cetux, cetuximab; CMS, consensus molecular subtypes; CRC, colorectal cancer; CYT, cytolytic; Enco, encorafenib; HR, hazard ratio; IQR, interquartile range; NES, normalized enrichment score; NK, natural killer; OS, overall survival; TPM, transcripts per million.
Extended Data Fig. 9
Extended Data Fig. 9. Kaplan-Meier plots of OS by presence of top acquired alterations (top panel) or MET amplification (bottom panel) following treatment with Enco+Cetux±Bini.
Cox proportional hazard models with and without adjustment of baseline covariates (ECOG performance status, C-reactive protein, number of organs, tumor status, cetuximab source, and prior use of irinotecan at randomization) were used. Bini, binimetinib; Cetux, cetuximab; CI, confidence interval; Enco, encorafenib; HR hazard ratio; OS, overall survival.
Extended Data Fig. 10
Extended Data Fig. 10. Clonality of acquired alterations determined by ctDNA genomic profiling analysis.
Violin plots showing clonality (EoT VAF/EoT max VAF) of all acquired putative resistance alterations (left); acquired KRAS, NRAS, and MAP2K1 mutations (middle); and all maintained putative resistance alterations (right). *P value for comparison between all acquired vs maintained putative resistance alterations was based on the Wilcoxon rank-sum test (two-sided). The resulting p-value from the analysis is < 0.0001. Only mutations were evaluated in the KRAS, NRAS, and MAP2K1 group. Silent mutations, clonal hematopoiesis of indeterminate potential, and alterations from genes that also had copy number alterations were excluded from the analysis.

References

    1. De Roock, W. et al. Effects of KRAS, BRAF, NRAS, and PIK3CA mutations on the efficacy of cetuximab plus chemotherapy in chemotherapy-refractory metastatic colorectal cancer: a retrospective consortium analysis. Lancet Oncol.11, 753–762 (2010). - PubMed
    1. Tabernero, J., Ros, J. & Élez, E. The evolving treatment landscape in BRAF-V600E-mutated metastatic colorectal cancer. Am. Soc. Clin. Oncol. Educ. Book42, 1–10 (2022). - PubMed
    1. Kopetz, S. et al. Encorafenib, binimetinib, and cetuximab in BRAF V600E-mutated colorectal cancer. N. Engl. J. Med.381, 1632–1643 (2019). - PubMed
    1. Tabernero, J. et al. Encorafenib plus cetuximab as a new standard of care for previously treated BRAF V600E-mutant metastatic colorectal cancer: updated survival results and subgroup analyses from the BEACON study. J. Clin. Oncol.39, 273–284 (2021). - PMC - PubMed
    1. Barras, D. et al. BRAF V600E mutant colorectal cancer subtypes based on gene expression. Clin. Cancer Res.23, 104–115 (2017). - PubMed

Publication types

MeSH terms

Associated data