. 2024 Oct;56(10):2158-2173.
doi: 10.1038/s41588-024-01875-8. Epub 2024 Sep 23.

Self-sustaining long-term 3D epithelioid cultures reveal drivers of clonal expansion in esophageal epithelium

Affiliations

Self-sustaining long-term 3D epithelioid cultures reveal drivers of clonal expansion in esophageal epithelium

Albert Herms et al. Nat Genet. 2024 Oct.

Abstract

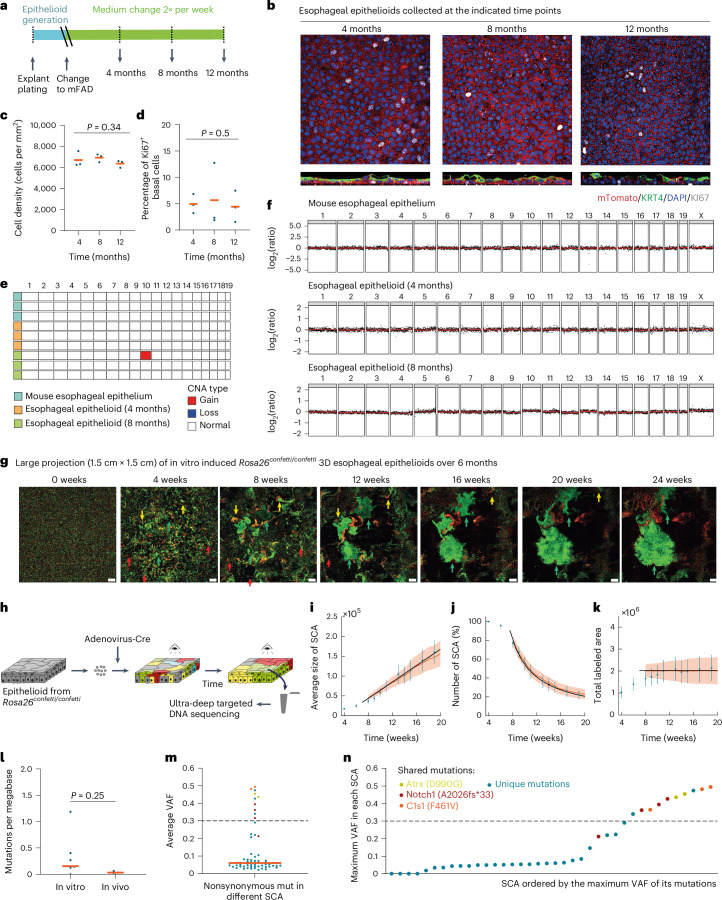
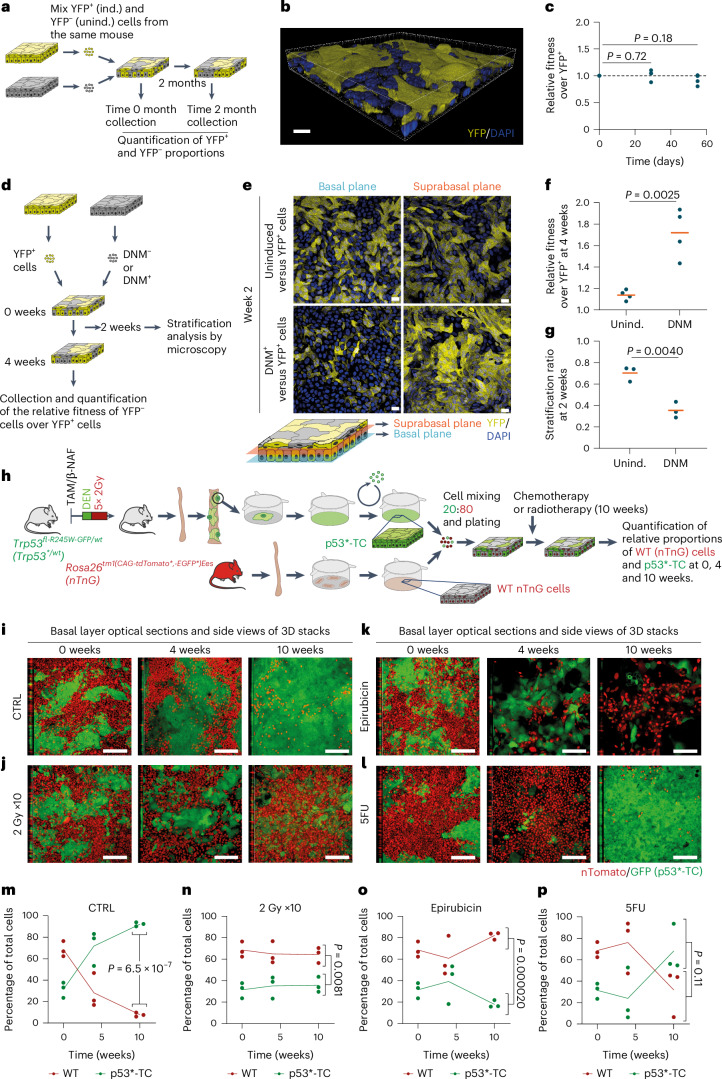
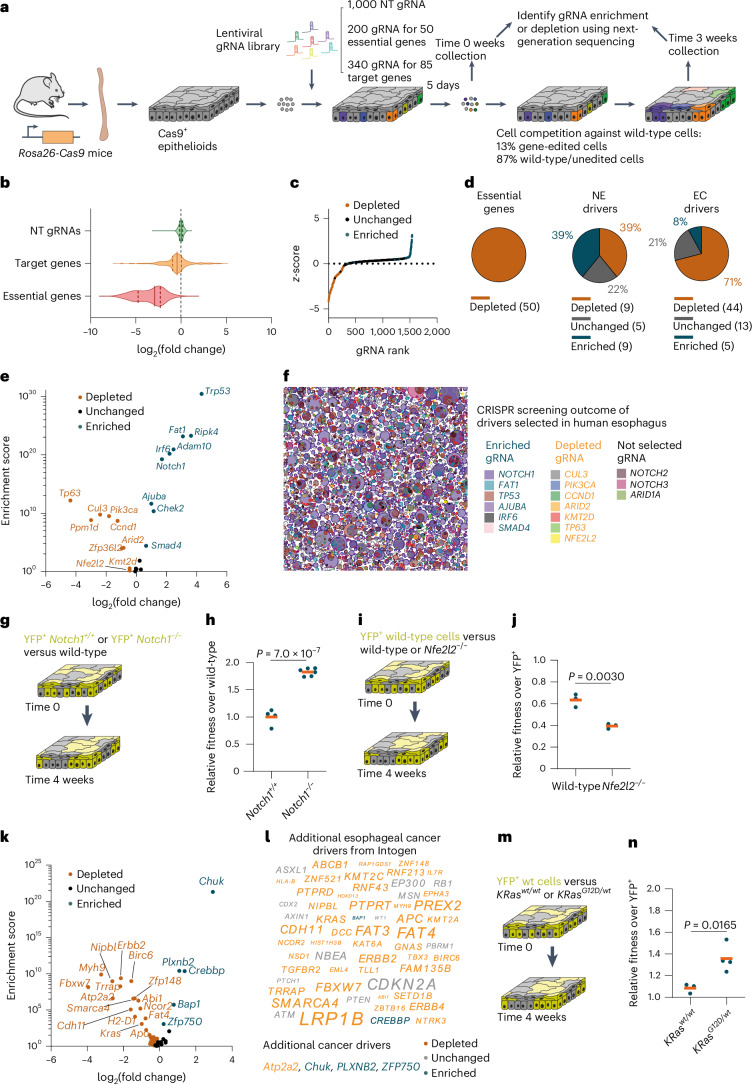
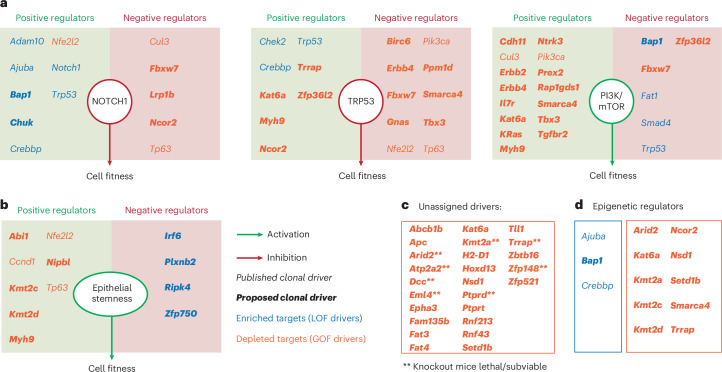
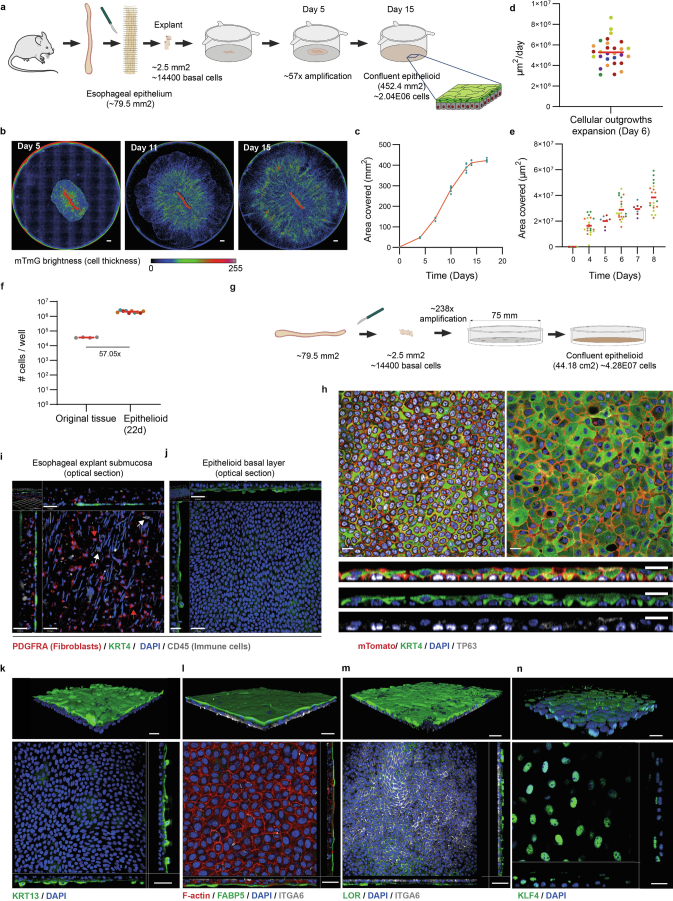
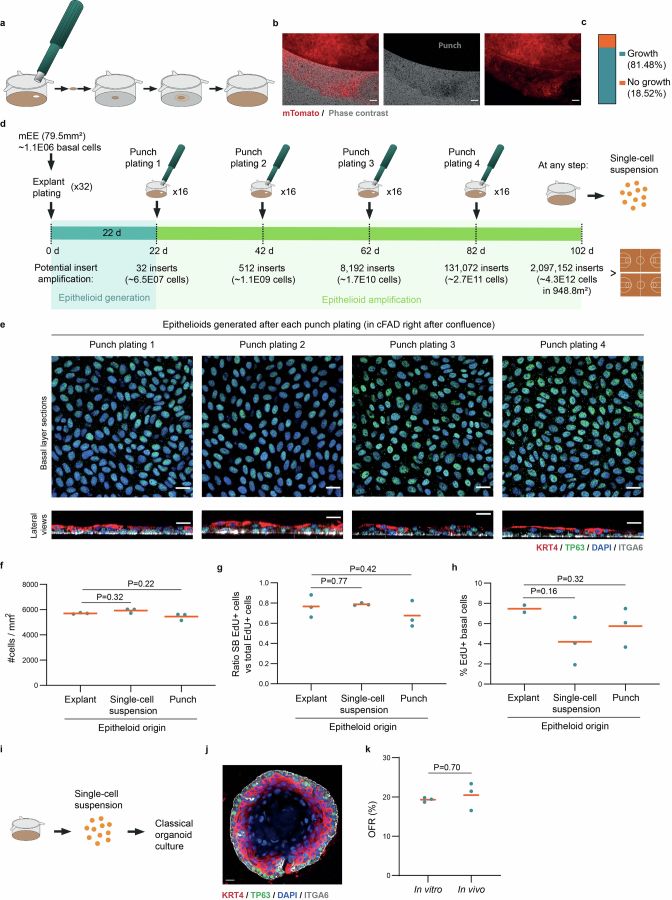
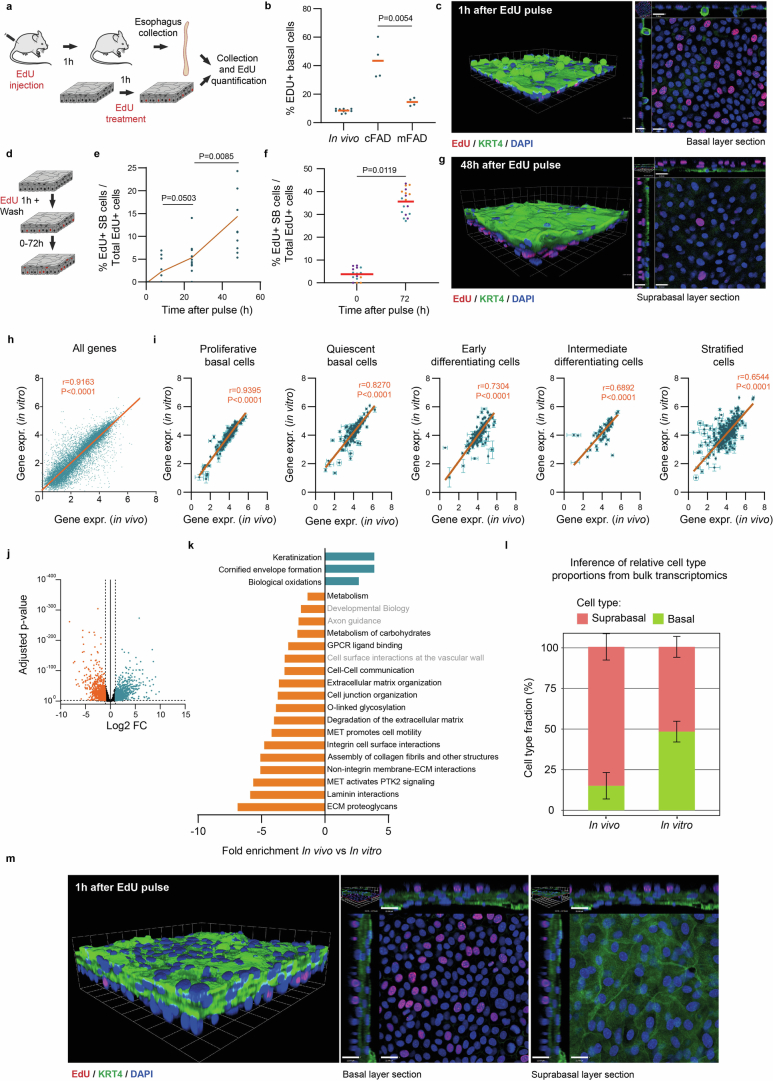
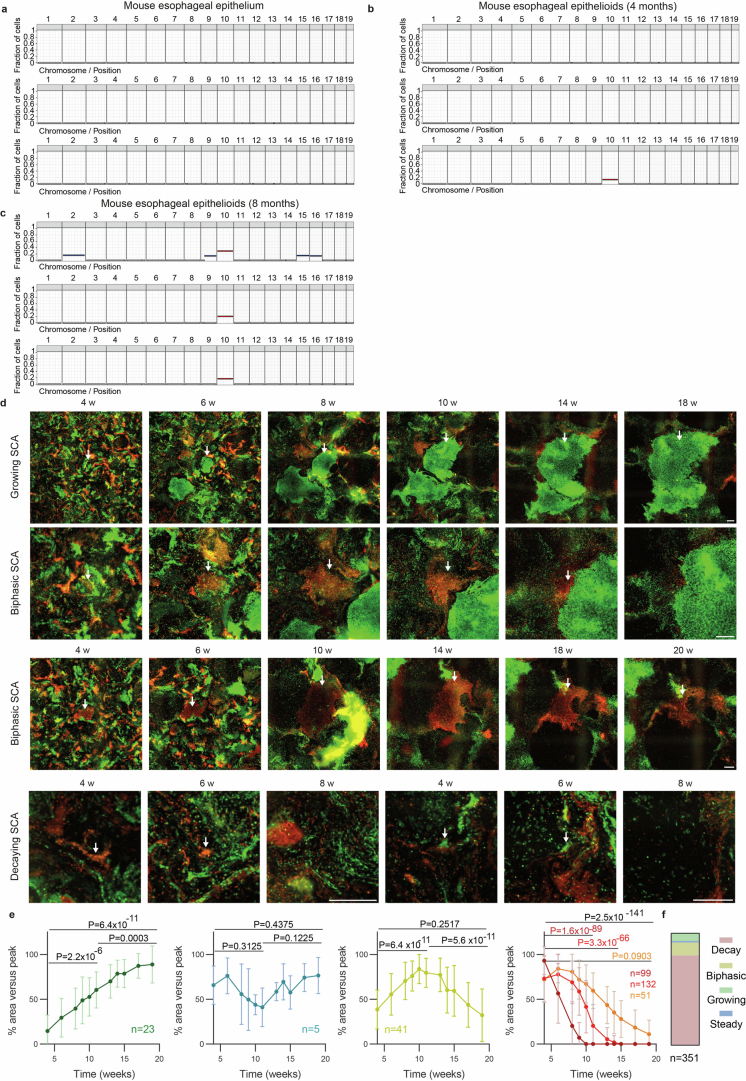
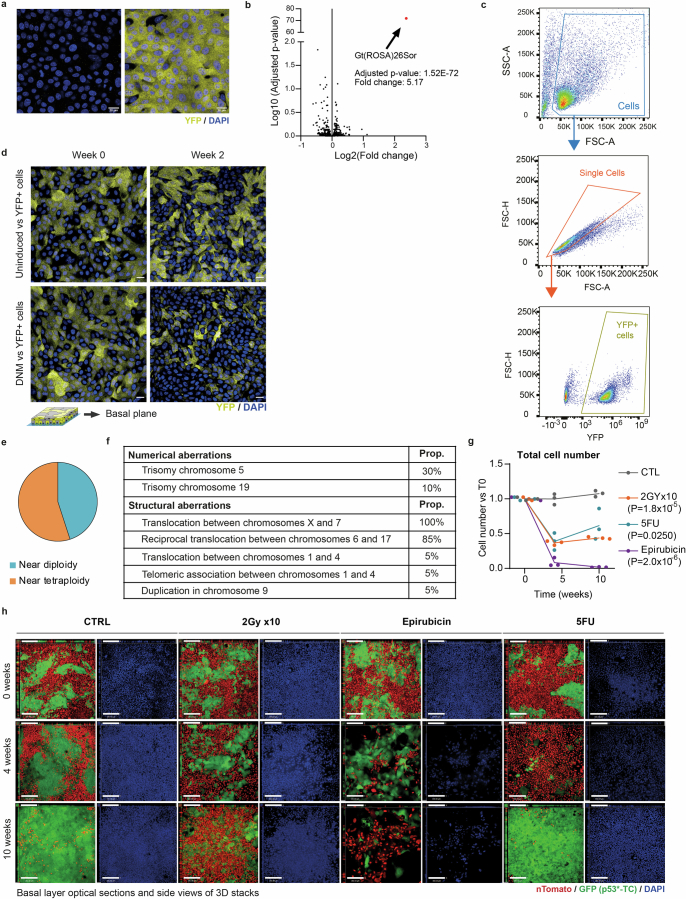
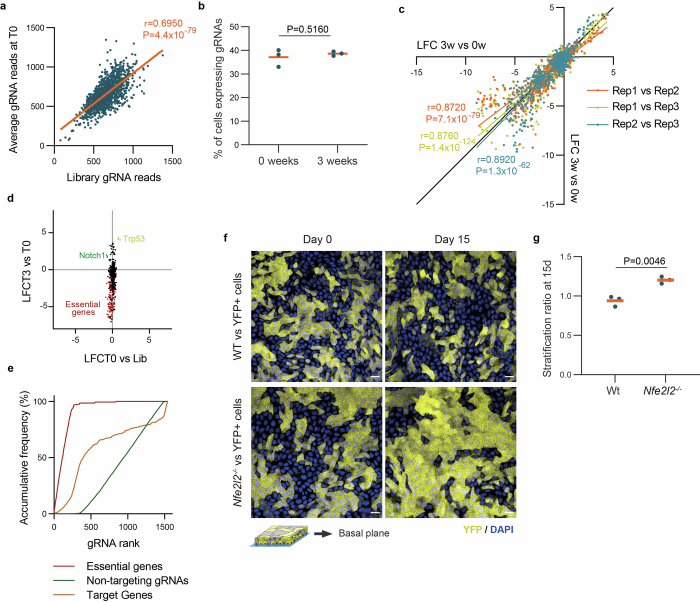
Aging epithelia are colonized by somatic mutations, which are subjected to selection influenced by intrinsic and extrinsic factors. The lack of suitable culture systems has slowed the study of this and other long-term biological processes. Here, we describe epithelioids, a facile, cost-effective method of culturing multiple mouse and human epithelia. Esophageal epithelioids self-maintain without passaging for at least 1 year, maintaining a three-dimensional structure with proliferative basal cells that differentiate into suprabasal cells, which eventually shed and retain genomic stability. Live imaging over 5 months showed that epithelioids replicate in vivo cell dynamics. Epithelioids support genetic manipulation and enable the study of mutant cell competition and selection in three-dimensional epithelia, and show how anti-cancer treatments modulate competition between transformed and wild-type cells. Finally, a targeted CRISPR-Cas9 screen shows that epithelioids recapitulate mutant gene selection in aging human esophagus and identifies additional drivers of clonal expansion, resolving the genetic networks underpinning competitive fitness.


Conflict of interest statement

The authors declare no competing interests.

Figures

Fig. 1
Fig. 1. Primary epithelial culture methods.
Standard,, organotypic,,, and organoid,, primary cultures of esophageal, oral and bladder epithelium, compared with the esophageal epithelioid cultures described in the text. aExpansion of cells from primary tissue can be enhanced by addition of Y27632 to the media; this is not required for epithelioid cultures. 2D, two-dimensional; FCS, fetal calf serum.
Fig. 2
Fig. 2. Characterization of mouse esophageal epithelioids.
a, Protocol. The mouse esophagus is opened longitudinally, cut into 32 pieces and 4 pieces are plated per insert. Once large cellular outgrowths are formed (day 7), the explants are removed. Once the culture is confluent, the medium is changed to mFAD. One week later cultures are ready for experimental use and are maintained by changing the medium two or three times a week. b, Proportion of explants that form epithelioids (n = 538 explants from 33 mice plated in 175 inserts by 5 different researchers). c, Rendered confocal z-stack of a typical confluent epithelioid after 1 h incubation with EdU and stained for KRT4 (red, suprabasal cells), WGA (gray), EdU (green, proliferating cells) and DAPI (blue). d,e, Rendered confocal z-stack (upper) and basal layer optical section with orthogonal views (lower) of typical esophagus whole-mount (d) (scale bar, 41 μm (xy, main panel, top down view) and 32 μm (z, inset, side view)) and esophageal epithelioid (e) (scale bar, 38 μm (xy) and 16 μm (z)) stained for ITGA6 (gray), KI67 (green), WGA (red) and DAPI (blue). f,g, Basal layer optical section with orthogonal views (lower) of a typical esophagus whole-mount (f) (scale bar, 40 μm (xy) 24 μm (z)) and esophageal epithelioid (g), scale bar, 38 μm (xy) and 15 μm (z), stained for TP63 (green), KRT4 (red) and DAPI (blue). Images typical of esophagi from three mice and three epithelioid cultures derived from three mice. hk, Confocal live imaging of H2BGFP-expressing epithelioids showing multiple z-projection time frames labeled with a rainbow color scale, where color indicates the cell position in the z plane. h, Scheme of the esophageal epithelioid structure with the z-scale color labeling used in ik, with basal cells (blue), suprabasal cells (green) and shedding cells (red). Selected live images showing cells undergoing mitosis (i), differentiation (j) and shedding (k) from Supplementary Videos 3–5, respectively. Time is indicated in each frame. Scale bar, 20 μm. The cells shown are representative examples of four imaged regions each from two independent epithelioid cultures. l, RNA-seq comparing gene expression from mouse esophageal epithelium (in vivo) and esophageal epithelioids 1 week post confluence and cultured in mFAD (in vitro). n = 4 animals and 4 epithelioids from 4 different animals. Heatmap shows selected basal cell, differentiation, cell cycle and cell fate modulator transcripts. Source data
Fig. 3
Fig. 3. Generation of human esophageal epithelioids and mouse oral and bladder epithelioids.
a, Epithelioid generation from human esophagus. b, Age distribution of human donors expanded as epithelioids. Each dot represents one donor. c, Proportion of explants that form cellular outgrowth and contribute to epithelioid generation. The total number of explants plated per donor is indicated. n = 480 explants from 2 donors. d,e, Rendered confocal z-stack (d) and basal plane optical section with orthogonal views (e) of a typical human esophageal epithelioid stained for KRT4 (red), ITGA6 (gray), KI67 (green) and DAPI (blue). Scale bar, 38 μm (top down view, xy) and 15 μm (inset, side view, z). f, Mouse epithelioid generation from mouse oral mucosa and bladder urothelium. g, Rendered confocal z-stack (upper) and basal layer optical section with orthogonal views (lower) of a typical mouse oral mucosa epithelioid stained for WGA (gray), TRP63 (green) and DAPI (blue). Scale bar, 38 μm (xy) and 17 μm (z). h, Basal layer optical section (upper) and lateral view 15 μm width projection (lower) of a typical mouse oral mucosa epithelioid stained for KI67 (red), KRT4 (green), ITGA6 (gray) and DAPI (blue). Scale bar, 20 μm. i, Rendered confocal z-stack (upper) and basal plane section with orthogonal views (lower) of a typical mouse bladder epithelioid stained for KRT20 (gray), KRT5 (green), KRT14 (red) and DAPI (blue). Scale bar, 28 μm (xy) and 11 μm (z). j, Outgrowth expansion velocity at day 6 post-plating for mouse oral epithelium (mOrE), esophageal epithelium (mEsE) and bladder epithelium (mBlE) explants. Unpaired two-tailed Student’s t-test. n = 9, 29 and 33 explants from 3, 6 and 10 mice, respectively. P values: mOrE versus mEsE, 0.0049; mOrE versus mBlE, 2.7 × 10−9; mBlE versus mEsE, 1.4 × 10−7. Red lines represent mean values. k, Proportion of explants that form a cellular outgrowth and contribute to epithelioid generation from oral mucosa and bladder epithelium. The proportion of explants generating cell growth, the number of explants and mice is indicated. Source data
Fig. 4
Fig. 4. Epithelioids have barrier function and repair capacity.
a,b, Esophageal epithelioids grown in mFAD immunostained with TJP1 (ZO-1) antibody (tight junctions, green), phalloidin (actin, red) and DAPI (nuclei, blue). Suprabasal (a) and basal layer (b) planes selected from the same culture area. Scale bar, 20 µm. Images are representative of three biological replicates. c, mFAD-grown esophageal epithelioids immunostained for CDH1 (adherens junctions, green) and DAPI (nuclei, blue); the basal layer plane is shown. Scale bar, 20 µm. d, Lucifer yellow permeability assay. Lucifer yellow is added for 30 min to the upper culture compartment of esophageal epithelioids and its transference to the lower compartment is quantified and compared with inserts without cells (100% permeability). n = 8 inserts from 4 mice. Each dot represents the average permeability of the inserts from each mouse. eg, Esophageal epithelioids established from Rosa26mTmG mice and incubated in mFAD were wounded using a microscalpel (e). Daily images were taken in an Incucyte system (f) and the wound area was quantified (g). Each dot corresponds to a different culture, their color indicates the mouse of origin. Lines connect means of cultures from the same mouse. n = 6 inserts from 3 mice. Scale bar, 5 mm. hj, Immunostaining of a Rosa26mTmG insert during the wound healing process using KRT4 (green), membrane Tomato (red) and DAPI (blue). h, Rendered confocal z-stack of a portion of the wound healing culture. 3D scale bar, 200 µm. i, Left: basal layer plane of a z-stack with white squares selecting a front area and a rear area of the wound. Orthogonal sections of the front (i, middle) and rear (j, right) areas selected from the left-hand panel. kn, Rosa26mTmG esophageal epithelioids cultured in mFAD were wounded as in e, with the addition of bone marrow cells extracted from Rosa26mito-roGFP2-Orp1 mice (green) to the upper compartment right after wounding. k, Protocol scheme. l, Confocal live imaging images showing cell front and immune cells during wound healing (upper) and magnification of the cell front to follow immune cell internalization in the membrane Tomato membrane GFP (mTmG) epithelial cell layer (lower). Scale bar, 20 µm. m, Immunostaining of CD11b (gray) in an esophageal epithelioid co-cultured with bone marrow derived Rosa26mito-roGFP2-Orp1 cells (green), DAPI (blue). Scale bar, 14 µm. n, Quantification of the proportion of wound closed per day. Unpaired two-tailed Student’s t-test. Lines represent mean values. n = 3 biological replicates for each condition. BM, bone marrow; CTL, control; roGFP2, reduction-oxidation sensitive green fluorescent protein 2; SB, supra basal. Source data
Fig. 5
Fig. 5. Long-term maintenance and tissue dynamics of esophageal epithelioids.
ad, Esophageal epithelioids generated from Rosa26mTmG mice maintained without passaging for up to 12 months and stained for KI67 (gray, proliferating cells), KRT4 (green, differentiated cells) and DAPI (blue). Protocol (a) and optical confocal section (b) of the basal cell layer (upper), lateral views (lower). Scale bar, 20 μm. Cell density (c) and the proportion of KI67+ basal cells (d). Lines indicate mean values, n = 3 inserts from different animals per time point. Page’s L test. e,f, Whole-genome sequencing of mouse esophageal epithelium and epithelioids after 4 and 8 months in culture. n = 3 animals and 3 esophageal epithelioids from different animals per time point. Summary plot showing all gain and loss of chromosome regions that affect more than 20% of cells (e) and copy number profile (f). gk, Epithelioids from Rosa26confetti/confetti mice cultured for 24 weeks after in vitro Cre recombination (Methods). g, Representative images of the same region of an epithelioid at the indicated time points. Scale bar, 1 mm. Red arrows indicate shrinking SCA, yellow arrows indicate SCA with biphasic growth and green arrows indicate growing SCA. h, Experimental protocol for g and ln. ik, Average SCA size (i), SCA number (j) and total labeled area (k) with experimental values (blue, mean ± s.d.) and a theoretical, single-parameter fit (black) as well as lattice-based simulations (orange) of a single-progenitor model. n = 351 SCA from 9 epithelioids from 6 different animals. ln, Thirty-eight surviving SCA were collected by laser-capture microdissection and DNA was sequenced. The estimated mutation burden of the collected SCA (in vitro) and three control mice samples (in vivo) (l), average VAF of nonsynonymous mutations in different SCA (m) and SCA ordered by the maximum VAF of its mutations, mutations represented in more than one sample are highlighted in the specified colors shown (n). Orange bars indicate mean values, and dashed lines indicate a VAF threshold for clonal mutations in the sample. Unpaired two-sided Student’s t-test. Source data
Fig. 6
Fig. 6. Epithelioids as a tool to study clonal competition.
ac, Cell competition in mixed epithelioid cultures formed by induced (ind.; YFP+) and uninduced (unind.; YFP) Rosa26YFP/YFP cells was maintained for 2 months. a, Protocol. b, Rendered confocal z-stack of a typical epithelioid with both competing subpopulations. c, Relative fitness of YFP versus YFP+ cells at different time points. n = 4 inserts per time point from 4 mice. Unpaired two-sided Student’s t-test. d, Protocol for DNM and wild-type (WT) cell competition. Primary cells from R26flDNM mice epithelioids, uninduced (wild-type, DNM) or induced (DNM+) in vitro, were mixed with YFP+ cells and kept in culture. e, Optical sections of basal and suprabasal cell planes at 2 weeks of competition of conditions shown in d. Scale bar, 20 μm. f,g, Relative fitness over YFP+ cells (f, n = 4) at 4 weeks and stratification ratio of DNM and DNM+ cells at 2 weeks (g, n = 3). Replicates correspond to primary cultures from different animals. Orange lines show mean values. Unpaired two-sided Student’s t-test. hp, Co-culture of transformed and wild-type cells. h, Protocol to generate Trp53 mutant transformed cells (p53*-TC). il, p53R245W mutant esophageal tumors were generated and expanded using the epithelioid protocol (Methods) to obtain p53*-TC. p53*-TC were mixed with primary wild-type cells from Rosa26nTnG (nuclear Tomato, nuclear green fluorescent protein) mice (20:80, respectively) (i) and exposed to 10 weeks of weekly dosing with 2 Gy gamma-irradiation (j), 1 µM epirubicin (k) or 5 µM 5FU (l). Orthogonal views of basal layer optical sections of z-stacks at 0, 4 and 10 weeks of treatment. Scale bar, 80 μm. mp, Proportion of each subpopulation over time: control (m), 2 Gy gamma-irradiation (n), 1 µM epirubicin (o) and 5 µM 5FU (p). n = 3. Replicates and lines connecting mean values are shown. P values indicate comparison between subpopulations at the 10-week time point. Unpaired two-sided Student’s t-test. β-NAF, beta-naphthoflavone; TAM, tamoxifen. Source data
Fig. 7
Fig. 7. CRISPR–Cas9 cell fitness screen identifies additional drivers of clonal expansion.
a, Protocol for the CRISPR–Cas9 targeted cell fitness screen. n = 3 biological replicates from different animals. b, Violin plots showing the distribution of log2(fold change) of gRNAs targeting essential genes (red), known or putative clonal expansion drivers (orange) and NT gRNAs (green), between the 3 and 0 week time points. c, The z-score is plotted against gene rank with each dot corresponding to a gRNA. gRNAs targeting significantly depleted genes are shown in orange and those targeting significantly enriched genes are shown in blue. d, Proportion of significantly enriched (blue), depleted (orange) or unchanged (gray) genes for essential genes (left), known clonal expansion drivers (NE, middle) or putative esophageal cancer drivers (EC, right). Gene numbers and proportions are shown. e, Volcano plot of the log2(fold change) versus enrichment score for known positively selected mutant genes in normal esophagus. f, Schematic representation of positively selected mutant clones in normal human esophagus from donors aged between 44 and 75 years. Depleted, unchanged and enriched targets in the screen are shown in orange, gray and blue, respectively. g,h, Protocol (g) and relative fitness over wild-type cells (h) of Notch1+/+ YFP+ cells (wt) or Notch1−/− YFP+ cells competing with uninduced cells from the same animals (wild-type cells) for 4 weeks. Dots are epithelioids from different animals. Orange bars indicate mean values. Unpaired two-sided Student’s t-test. n = 4–6 epithelioids from different animals. i,j, Protocol (i) and relative fitness over YFP+ cells (j) of wild-type or Nfe2l2−/− cells competing with YFP+ cells for 4 weeks. Dots are epithelioids from different animals. Orange bars indicate mean values. Unpaired two-sided Student’s t-test. n = 3 epithelioids from different animals. k,l, Volcano plot of log2(fold change) versus enrichment score (k) and illustration (l) of candidate esophageal cancer drivers from ref. . The font size in l reflects the proportion of mutant samples from ref. . m,n, Protocol (m) and relative fitness over YFP+ cells (n) of uninduced (KRaswt/wt) or induced (KRasG12D/wt) cells from LSL Kras+/G12D mice competing with YFP+ cells for 4 weeks. Dots correspond to epithelioids from different animals. Orange bars indicate mean values. Unpaired two-sided Student’s t-test. n = 3–4 epithelioids from different animals. Source data
Fig. 8
Fig. 8. Effect of the identified drivers of cell competition on signaling pathways.
a, For each pathway (NOTCH, TRP53 and PI3K/mTOR, respectively), diagrams indicate the effect of each pathway on esophageal progenitor cell fitness (enhancement in green and reduction in red), inferred from the selection outcome of their positive and negative regulators in the screen. Positive and negative regulators of each pathway (Supplementary Table 1) are placed in green and red boxes, respectively. b, Diagram similar to a, depicting the effect of genes known to regulate epithelial stemness (Supplementary Table 1). c, Esophageal cell fitness regulators identified in the screen that do not regulate the pathways shown in a. **Genes that are lethal or sub-viable when knocked out in mice. d, Epigenetic regulators that modulate progenitor cell fitness. For ad, significantly enriched and depleted targets in the CRISPR–Cas9 screen are shown in blue and orange, respectively. Clonal drivers previously described are shown in italics and novel regulators of esophageal cell competition identified in the screen are shown in bold italics. Source data
Extended Data Fig. 1
Extended Data Fig. 1. Generation of mouse esophageal epithelioids.
a, Epithelioid generation from a single esophageal explant. b, Live microscopy ‘Incucyte’ images 5, 11 and 15 days after plating Rosa26mTmG esophageal explants. Color scale shows fluorescence intensity. Scale bar, 1000 μm. Images representative of 20 independent explants. c, Area of covered by cells from a single esophageal explant. Each dot represents an epithelioid. n = 6 epithelioids. d-e, Expansion velocity at Day 6 after plating and area of cellular outgrowth 8 days after plating. Each dot represents a cellular outgrowth and each colour a different mouse (n = 29 epithelioids from 6 mice). Red bar, mean. f, Number of cells in epithelioids 22 days after plating an explant of 1/32th of esophagus (Epithelioid) compared to the basal cell number in original explant (Original tissue). Each dot represents a mouse or an epithelioid. Dots with the same color correspond to same mouse. n = 9 epithelioids from 3 mice. Red bar, mean. g Protocol: 5 explants from Rosa26mTmG mouse esophagus were plated in 75 mm diameter inserts and cultured for 20 days basal cell numbers quantified at the start and end of experiment. h optical sections of basal layer (top-left), suprabasal layer (top-right) with lateral views (bottom) of a representative area of 20 day culture from g. Grey, TP63, green, KRT4, and blue, DAPI. Scale bars, 20 μm. i and j, Immunostaining against PDGFRA (red, fibroblasts), KRT4 (green), CD45 (grey, immune cells) and DAPI (blue), of explant and surrounding cellular outgrowth. Optical section with orthogonal views of explant submucosa (I, scale bars=44 μm) and newly formed epithelioid basal layer membrane (j, scale bars=41 μm). Images representative of 3 biological replicates. k-n, Mouse esophageal epithelioids cultured in mFAD immunostained against (k) KRT13 (green) and DAPI (blue); (l) FABP5 (green), F-actin (red), ITGA6 (grey) and DAPI (blue); (m) LOR (green), ITGA6 (grey) and DAPI (blue); (n) KLF4 (green) and DAPI (blue). Scale bars correspond to 40μm (k, top panel), 30μm (k, bottom panel and l), 50μm (m) and 20μm (n). Source data in Supplementary Table 1. Images representative of 3 biological replicates. Source data
Extended Data Fig. 2
Extended Data Fig. 2. Amplification of mouse esophageal epithelioids.
a, Scheme of the punch plating procedure. b, Epifluorescence microscopy images showing a front of Rosa26mTmG cells exiting a punch to colonize the insert. Phase contrast (grey) and mTomato (red). Scale bar, 100 μm. Image representative of 9 independent experiments. c, Proportion of epithelioid punch biopsies able to generate new cultures, n = 9 independent experiments. d, Protocol for punch plating amplification. e, Optical sections of basal cell layer (top panels) and lateral views (bottom panels) from confocal 3D image stacks of epithelioids stained for TRP63 (green), KRT4 (red), ITGA6 (grey) and DAPI (blue). Scale bars, 20 μm. f-h, Epithelioids generated from explants, single-cell suspensions, or punch biopsies from epithelioids (Punch plating 1) incubated for 2 weeks after confluence and the last 3 hours with 10 µM EdU. Cell density in the basal layer (f), stratification ratio (g, percentage of EdU+ suprabasal cells versus total EdU+ cells 96 h after EdU pulse) and the proportion of EdU+ basal cells immediately after the 3 h EdU pulse (h). Each dot corresponds to a biological replicate (epithelioid from a different mouse). n = 3. Orange lines indicate average. Two-tailed paired (f-g) or two-tailed unpaired (h) Student’s t-test. i-k, Organoid generation from epithelioids. Protocol (i), representative image of esophageal organoid (j) stained for ITGA6 (grey), KRT4 (red), TP63 (green) and DAPI (blue), scale bar=14 μm, and organoid formation rate (OFR, %) (k) from esophageal epithelioids and mouse esophagus. n = 3 replicates from different original epithelioid cultures or mice. Orange bars indicate mean values. Two-tailed Mann-Whitney test. Source data
Extended Data Fig. 3
Extended Data Fig. 3. Characterization of mouse esophageal epithelioids.
a-c Proliferation assays. a, Protocol. S phase cells in esophagus or epithelioids were labeled with EdU. b, Percentage of EdU+ basal cells, each dot is an animal or epithelioid, orange bars, mean values. Two-tailed unpaired Student t-Test. n = 4–10 epithelioids or animals. c 3D rendered confocal z stack (left) and basal section with orthogonal views (right) of typical epithelioid, KRT4 (green), EdU (red), DAPI (blue). Scale bars=20 μm for x-y and 14 μm for z plane. d-g, In vitro cell tracking 0–72 h after an EdU pulse. d, Protocol, EdU labels S phase cells, after 0–72 hours EdU+ cell location was determined by imaging, revealing rates of division and stratification. e and f, percentage of EdU+ suprabasal cells versus total EdU+ cells at the indicated times (mean ± SD). Two-tailed unpaired Students t-Test. n = 10–18 different areas from 3 epithelioids from 3 animals. g, rendered confocal z stack (left) and basal section with orthogonal views (right) of typical epithelioid. KRT4 (green), EdU (red) and DAPI (blue). Scale bars=21 μm for x-y and 18 μm for z plane. h- l, RNA sequencing comparing esophageal epithelium (in vivo) and confluent epithelioids (in vitro). n = 4 animals and 4 epithelioids from 4 different animals. Correlation of Log10 normalized RNA counts of all transcripts (h) and selected basal cell, differentiation, cell cycle and cell fate modulator mRNAs (i),. Orange line shows linear regression between samples with Pearson’s coefficient and two-tailed p-value of correlation: p = 0.0 (h), p = 6.43 × 10⁻⁹ (proliferative basal), p = 1.14 × 10−42 (quiescent basal), p = 1.57 × 10−47(early differentiating), p = 9.5 × 10⁻¹¹ (intermediate differentiating), p = 1.04 × 10−64 (stratified). Values are mean ± SD. j, Volcano plot showing Log2 fold change of expression between in vivo and in vitro and adjusted p-value (corrected for multiple testing, Supplementary Note). Orange, downregulated in vivo, blue, upregulated in vivo, black unchanged. k, Gene ontology analysis of Reactome pathways upregulated (blue) or downregulated (orange) in vivo. l, Inferred cell type representation from RNAseq data (Supplementary Note). m, Rendered confocal z stack (left), basal section (middle), suprabasal section (right) both with orthogonal views of epithelioid cultured at air-liquid interface for 15 days, incubated for 1 h with EdU. KRT4 (green), EdU (red) and DAPI (blue). Scale bars=22 μm for x-y and 22 μm for z plane. Source data
Extended Data Fig. 4
Extended Data Fig. 4. Long-term maintenance and tissue dynamics of esophageal epithelioids.
a-d, Whole genome sequencing of mouse esophageal epithelium and epithelioids after 4 and 8 months in culture. n = 3 animals and 3 esophageal epithelioids from different animals per time point. Graphs showing the fraction of cells bearing a DNA gain or loss in each chromosome in normal esophageal epithelium of three mice (events present in more than 10 % of cells) (a), epithelioids from three different mice after 4 (b) and 8 (c) months in culture. d-e, Epithelioids from Rosa26confetti/confetti mice after in vitro labelling (see Methods), cultured for 24 weeks. Representative examples (d) and area quantification (e) of 351 SCA showing growing, biphasic, constant and decreasing changes in area. Arrows indicate selected SCA. Scale bar=500 µm. Two-tailed Wilcoxon matched-pairs signed rank test. Mean ± SD per time point and pattern are indicated. Areas of SCA, grouped by change in area (see Methods), as indicated in each graph. f, Proportion of SCA showing each group.
Extended Data Fig. 5
Extended Data Fig. 5. Epithelioids as a tool to study cell competition.
a, Uninduced (left, YFP-) or induced (right, YFP+) cells from mouse esophageal epithelioids from Rosa26YFP/YFP mice. Scale bar, 20 μm. b, Volcano plot comparing RNA expression (Log2 of the fold change) of induced and uninduced cells from a and log10 of adjusted p-value (corrected for multiple testing using the Benjamini and Hochberg method) after dSeq2 differential expression analysis. Red dot shows the only significant gene. Wald test corrected for multiple testing using the Benjamini and Hochberg method. c, Gating strategy for quantifying the YFP+ cell population in cell competition experiments with YFP+ and non-fluorescent subpopulations shown in Fig. 5. d, Optical sections of basal cell planes at 0 and 2 weeks of competition of conditions shown in Fig. 5e, Scale bar, 20 μm. e-f, M-FISH karyotyping analysis of p53R245W mutant cancer cells (p53*-TC) used in Fig. 5. g, Effect of each treatment on cell numbers (including wt and p53*-CCL cells) relative to T0. n = 3 independent cultures. P-values indicate comparison between each treatment and control at the 10-week time point. Unpaired two-sided Student’s t-test. h, Images shown in Fig. 5i–l with their corresponding panels of DAPI channel in blue. Scale bars, 80 μm.
Extended Data Fig. 6
Extended Data Fig. 6. CRISPR/Cas9 fitness screen validation.
a, Correlation between normalized read counts of the plasmid library and average gRNA reads at the initial time point (T0). The orange line shows the linear regression between samples with the Pearson’s coefficient and two-tailed p-value of the correlation. b, Proportion of cells expressing the BFP reporter present in the gRNA plasmid at the initial time point (0 weeks) and late time point (3 weeks). Every dot corresponds to a biological replicate. Orange bars show mean values. Unpaired two-sided Student’s t-test, n = 3 biological replicates. c, Correlation between the log fold changes (LFC) between 3 weeks and 0 weeks of each biological replicate (Rep 0, Rep1 and Rep2). Each color represents the correlation between a pair of biological replicates. The colored lines show the linear regression between samples with the Pearson’s coefficient and two-tailed p-value of the correlation. Black line indicates the identity line. d, Correlation of LFC between 0w and gRNA library and the LFC between 3 weeks and 0 weeks, for each biological replicate and gRNA. gRNA targeting essential genes are highlighted in red and gRNA targeting Notch1 and Trp53 in green and yellow respectively. e, Area under the curve analysis for the non-targeting gRNAs, gRNAs targeting essential genes and the rest of gRNAs used. f-g, Primary cells from wild type or Nfe2l2−/− cells, were mixed with YFP+ cells and kept for 15 days in culture. Optical sections of the basal cell plane at 0 and 15 days of competition (f, Scale bar, 20 μm) and stratification ratio of wild type and Nfe2l2−/− cells at day 15 (g, n = 3). Replicates correspond to primary cultures from different animals. Orange bars show mean values. Unpaired two-sided Student’s t-test. Source data

References

    1. Marchetti, M., Caliot, E. & Pringault, E. Chronic acid exposure leads to activation of the cdx2 intestinal homeobox gene in a long-term culture of mouse esophageal keratinocytes. J. Cell Sci.116, 1429–1436 (2003). - PubMed
    1. Compton, C. C., Warland, G., Nakagawa, H., Opitz, O. G. & Rustgi, A. K. Cellular characterization and successful transfection of serially subcultured normal human esophageal keratinocytes. J. Cell. Physiol.177, 274–281 (1998). - PubMed
    1. Doran, T. I., Vidrich, A. & Sun, T.-T. Intrinsic and extrinsic regulation of the differentiation of skin, corneal and esophageal epithelial cells. Cell22, 17–25 (1980). - PubMed
    1. Suprynowicz, F. A. et al. Conditionally reprogrammed cells represent a stem-like state of adult epithelial cells. Proc. Natl Acad. Sci. USA109, 20035–20040 (2012). - PMC - PubMed
    1. Mou, H. et al. Dual SMAD signaling inhibition enables long-term expansion of diverse epithelial basal cells. Cell Stem Cell19, 217–231 (2016). - PMC - PubMed

LinkOut - more resources