. 2024 Sep 23;22(1):854.
doi: 10.1186/s12967-024-05677-8.

Innovative biomarkers TCN2 and LY6E can significantly inhibit respiratory syncytial virus infection

Affiliations

Innovative biomarkers TCN2 and LY6E can significantly inhibit respiratory syncytial virus infection

Bochun Cao et al. J Transl Med. .

Abstract

Background: Respiratory syncytial virus (RSV) is a prominent etiological agent of lower respiratory tract infections in children, responsible for approximately 80% of cases of pediatric bronchiolitis and 50% of cases of infant pneumonia. Despite notable progress in the diagnosis and management of pediatric RSV infection, the current biomarkers for early-stage detection remain insufficient to meet clinical needs. Therefore, the development of more effective biomarkers for early-stage pediatric respiratory syncytial virus infection (EPR) is imperative.

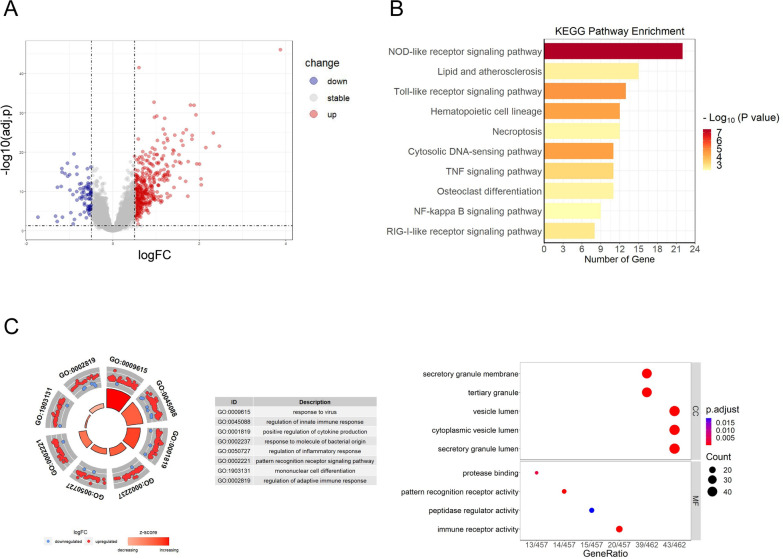
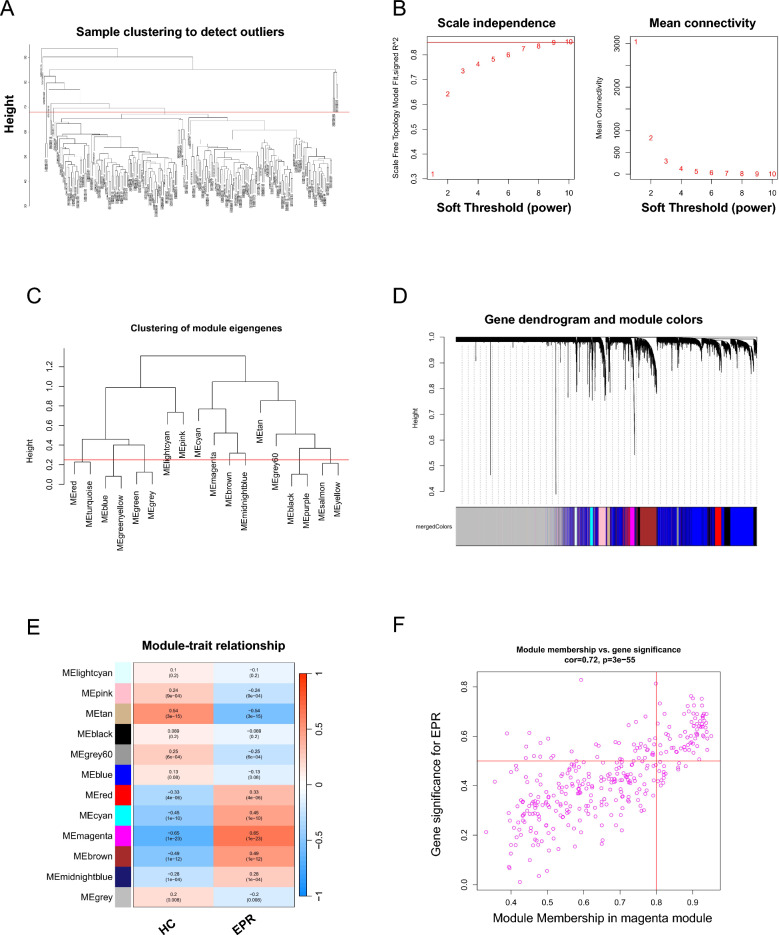
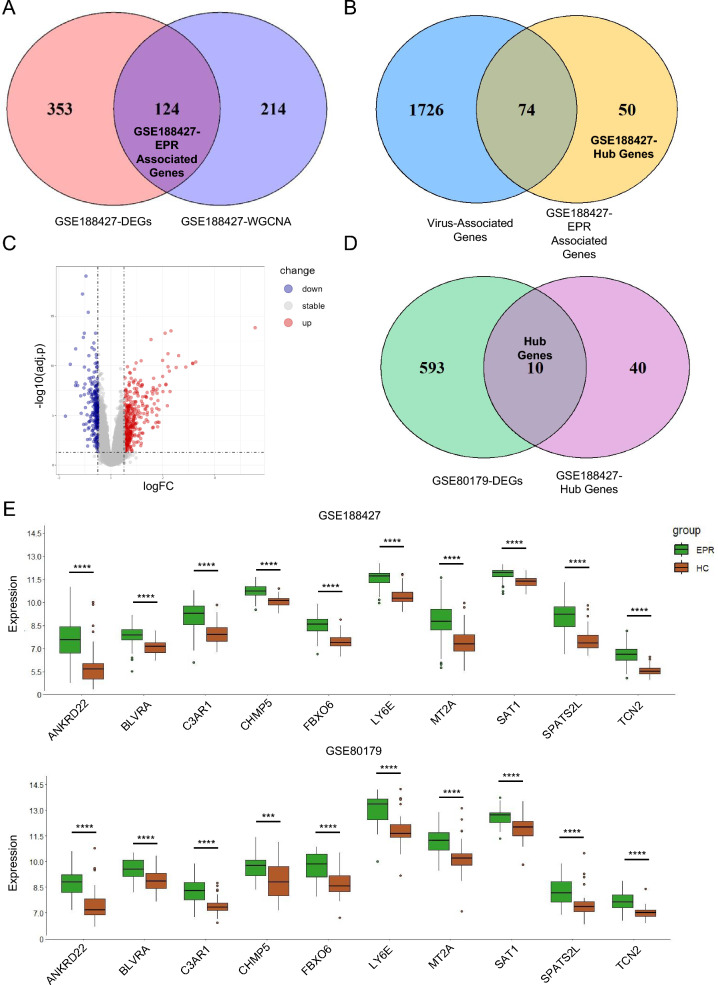
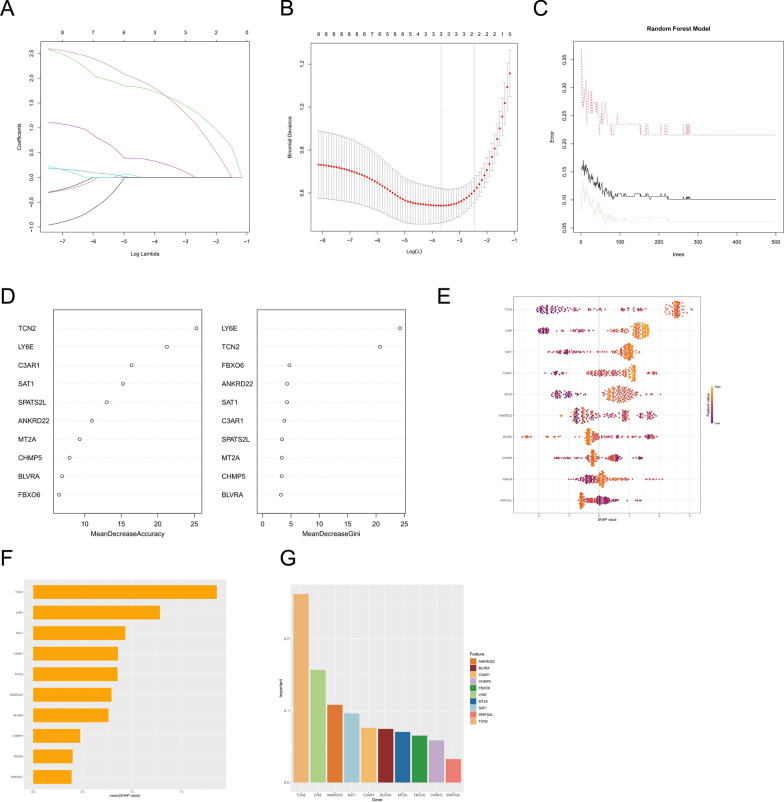
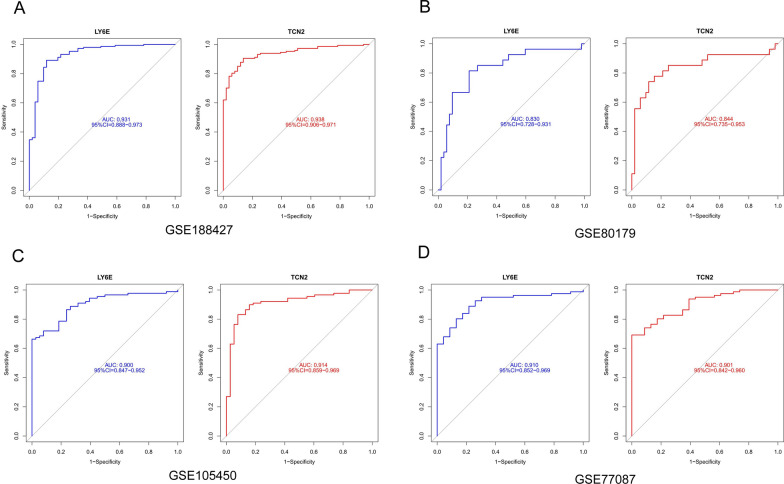
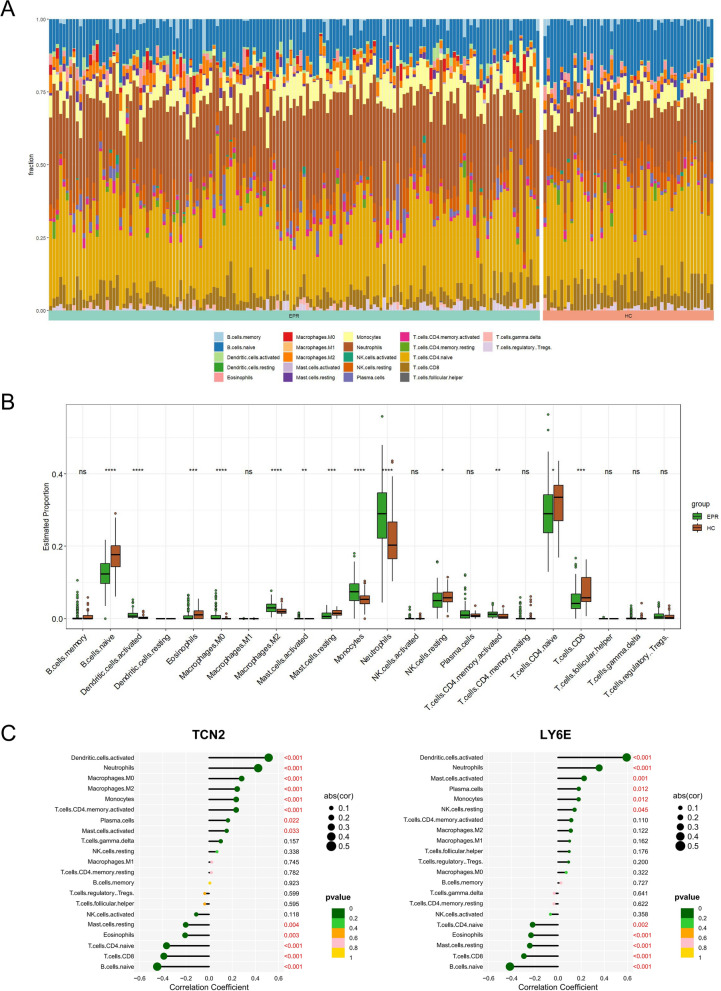
Methods: The datasets used in this study were derived from the Gene Expression Omnibus (GEO) database. We used GSE188427 dataset as the training set to screen for biomarkers. Biomarkers of EPR were screened by Weighted Gene Co-expression Network Analysis (WGCNA), three machine-learning algorithms (LASSO regression, Random Forest, XGBoost), and other comprehensive bioinformatics analysis techniques. To evaluate the diagnostic value of these biomarkers, multiple external and internal datasets were employed as validation sets. Next, an examination was performed to investigate the relationship between the screened biomarkers and the infiltration of immune cells. Furthermore, an investigation was carried out to identify potential small molecule compounds that interact with selected diagnostic markers. Finally, we confirmed that the expression levels of the selected biomarkers exhibited a significant increase following RSV infection, and they were further identified as having antiviral properties.

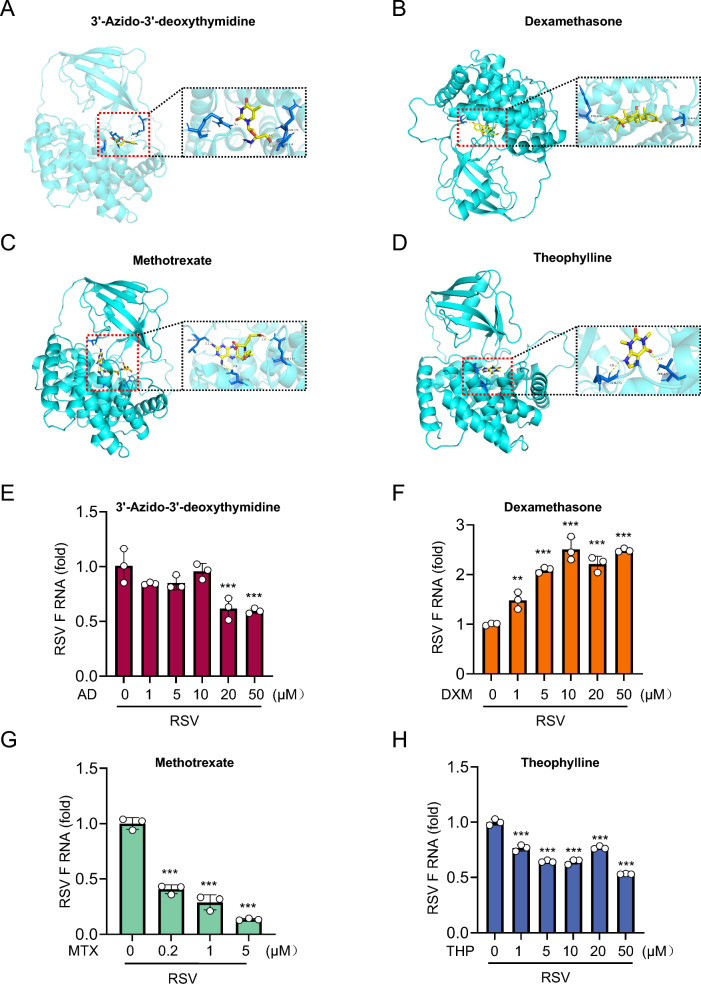
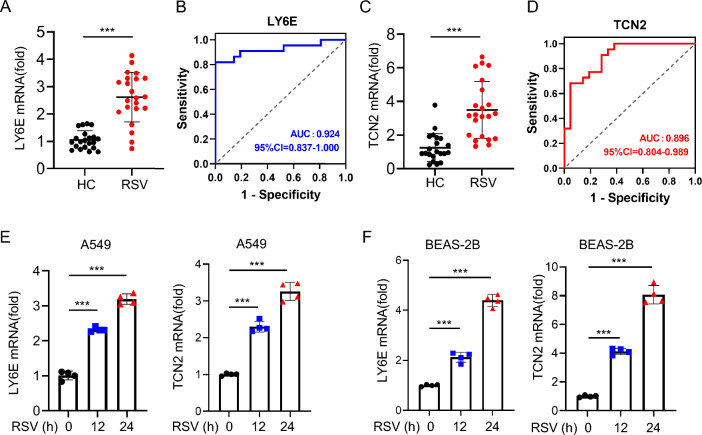
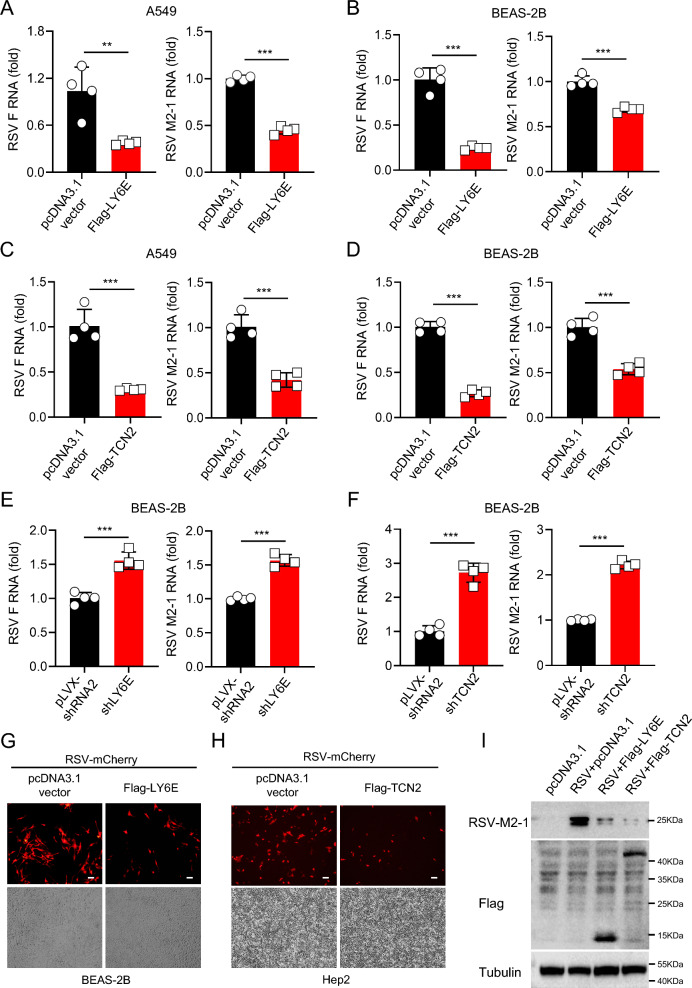
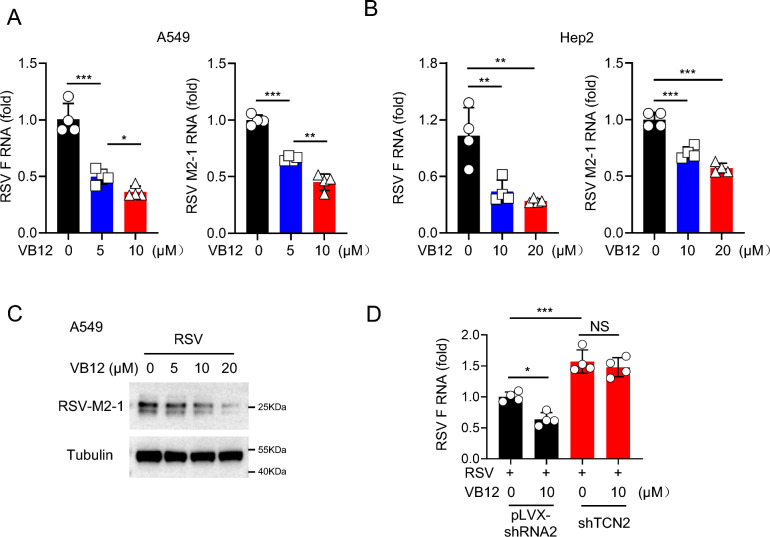
Results: The study found that lymphocyte antigen 6E (LY6E) and Transcobalamin-2 (TCN2) are two biomarkers with diagnostic significance in EPR. Analysis of immune cell infiltration showed that they were associated with activation of multiple immune cells. Furthermore, our analysis demonstrated that small molecules, 3'-azido-3'-deoxythymine, methotrexate, and theophylline, have the potential to bind to TCN2 and exhibit antiviral properties. These compounds may serve as promising therapeutic agents for the management of pediatric RSV infections. Additionally, our data revealed an upregulation of LY6E and TCN2 expression in PBMCs from patients with RSV infection. ROC analysis indicated that LY6E and TCN2 possessed diagnostic value for RSV infection. Finally, we confirmed that LY6E and TCN2 expression increased after RSV infection and further inhibited RSV infection in A549 and BEAS-2B cell lines. Importantly, based on TCN2, our findings revealed the antiviral properties of a potentially efficacious compound, vitamin B12.

Conclusion: LY6E and TCN2 are potential peripheral blood diagnostic biomarkers for pediatric RSV infection. LY6E and TCN2 inhibit RSV infection, indicating that LY6E and TCN2 are potential therapeutic target for RSV infection.

Keywords: Biomarker; LY6E; Pediatric RSV infection; Respiratory syncytial virus (RSV); TCN2.


Conflict of interest statement

The authors declare no competing interests.

Figures

Fig. 1
Fig. 1
DEGs of EPR were identified and functional enrichment analysis was performed. A The volcano plot showed 477 DEGs between the EPR and HC groups in the GSE188427 dataset. B, C Functional enrichment revealed a significant association between DEGs and host immunity. The enrichment analysis of DEGs was performed by KEGG (B) and GO (C)
Fig. 2
Fig. 2
Construction of weighted co-expression network-related datasets in EPR. A A cluster tree of 198 samples. B Analysis of network topology for various soft thresholds (β). C Clustering dendrogram of genes. D Gene dendrograms from average linkage hierarchical clustering. E Module-trait relationships. F A scatterplot of gene significance for recurrence vs. module membership in the magenta module
Fig. 3
Fig. 3
Selecting ten key genes as EPR hub genes. A Venn diagram of magenta module genes versus GSE188427-DEGs. B Venn diagram of Virus-Associated Genes versus GSE188427-EPR Associated Genes. C The volcano plot showed 603 DEGs between pediatrics RSV infection and HC groups in the GSE80179 dataset. D Venn diagram of GSE80179-DEGs versus GSE188427-Hub Genes. E The expression levels of ten Hub genes were verified, and the boxplot showed that the expression of these ten genes increased after pediatric RSV infection
Fig. 4
Fig. 4
Detection of novel biomarkers using machine-learning algorithms. A, B Based on LASSO regression algorithm to screen biomarkers. C, D Based on RF algorithm to screen biomarkers. E–G Based on XGBoost algorithm to screen biomarkers
Fig. 5
Fig. 5
LY6E and TCN2 diagnostic ROC curves for discriminating RSV infected from healthy controls. A ROC analysis for LY6E and TCN2 in dataset GSE188427. B ROC analysis for LY6E and TCN2 in dataset GSE80179. C ROC analysis for LY6E and TCN2 in dataset GSE105450. D ROC analysis for LY6E and TCN2 in dataset GSE77087
Fig. 6
Fig. 6
Immune cell infiltration analysis. A The proportion of immune cells in the EPR and HC groups. B The CIBERSORT-based boxplot demonstrated a significant difference in immune infiltration patterns between the two groups. C Correlation between TCN2 and infiltrating immune cells (left), Correlation between LY6E and infiltrating immune cells (right)
Fig. 7
Fig. 7
Molecular docking validation of TCN2 with candidate therapeutic agents, followed by an analysis of the antiviral functions of these agents. In this illustration, potentially effective drugs are shown in yellow, and TCN2 is shown in green. Amino acid residues that interact with potentially effective drugs by hydrogen bonding are highlighted in blue. The and yellow dashed line represented a hydrogen bond. A 3ʹ-Azido-3ʹ-deoxythymidine, B Dexamethasone, C Methotrexate, D Theophylline. E RT–qPCR analysis of RSV F RNA level in BEAS-2B cells pretreated with 3ʹ-Azido-3ʹ-deoxythymidine (0, 1, 5 10, 20 and 50 μM) for 24 h, and then infected with RSV (MOI = 1.0) for 20 h. The relative expression of RSV RNA was normalized to GAPDH mRNA. F RT–qPCR analysis of RSV F RNA level in BEAS-2B cells pretreated with Dexamethasone (0, 1, 5 10, 20 and 50 μM) for 24 h, and then infected with RSV (MOI = 1.0) for 20 h. The relative expression of RSV RNA was normalized to GAPDH mRNA. G RT–qPCR analysis of RSV F RNA level in BEAS-2B cells pretreated with Methotrexate (0, 0.2, 1 and 5 μM) for 12 h, and then infected with RSV (MOI = 1.0) for 20 h. The relative expression of RSV RNA was normalized to GAPDH mRNA. H RT–qPCR analysis of RSV F RNA level in BEAS-2B cells pretreated with Theophylline (0, 1, 5 10, 20 and 50 μM) for 24 h, and then infected with RSV (MOI = 1.0) for 20 h. The relative expression of RSV RNA was normalized to GAPDH mRNA. **p < 0.01 and ***p < 0.001 (one-way analysis of variance). All data are shown as mean ± s.d. of three independent replicates (A, B)
Fig. 8
Fig. 8
RSV infection promoted the transcriptional expression of LY6E and TCN2. A RT-qPCR analysis of LY6E mRNA levels in human PBMCs from healthy controls (n = 21) and RSV infected patients (n = 23). The relative expression of the LY6E was normalized to GAPDH mRNA. B ROC analysis of LY6E expression in healthy controls and RSV infected patients. C RT-qPCR analysis of TCN2 mRNA levels in human PBMCs from healthy controls (n = 21) and RSV infected patients (n = 23). The relative expression of the TCN2 was normalized to GAPDH mRNA. D ROC analysis of TCN2 expression in healthy controls and RSV infected patients. E RT-qPCR analysis of LY6E (Left) and TCN2 (Right) mRNA in A549 cells infected with RSV (MOI = 1.0) for indicated durations. The relative expression of the LY6E and TCN2 genes was normalized to GAPDH mRNA. F RT-qPCR analysis of LY6E (Left) and TCN2 (Right) mRNA in BEAS-2B cells infected with RSV (MOI = 1.0) for indicated durations. The relative expression of the LY6E and TCN2 genes was normalized to GAPDH mRNA. ***p < 0.001 (two-tailed unpaired Student’s t-test or one-way analysis of variance). All data are shown as mean ± s.d. of four independent replicates (E, F)
Fig. 9
Fig. 9
LY6E and TCN2 inhibited RSV infection. A RT-qPCR analysis of the RSV F (Left) and M2-1 (Right) RNA in A549 cells transfected with pcDNA3.1 vector or Flag-LY6E followed by infection with RSV (MOI = 1.0) for 20 h. The relative expression of RSV RNA was normalized to GAPDH mRNA. B RT-qPCR analysis of the RSV F (Left) and M2-1 (Right) RNA in BEAS-2B cells transfected with pcDNA3.1 vector or Flag-LY6E followed by infection with RSV (MOI = 1.0) for 20 h. The relative expression of RSV RNA was normalized to GAPDH mRNA. C RT-qPCR analysis of the RSV F (Left) and M2-1 (Right) RNA in A549 cells transfected with pcDNA3.1 vector or Flag-TCN2 followed by infection with RSV (MOI = 1.0) for 20 h. The relative expression of RSV RNA was normalized to GAPDH mRNA. D RT-qPCR analysis of the RSV F (Left) and M2-1 (Right) RNA in BEAS-2B cells transfected with pcDNA3.1 vector or Flag-TCN2 followed by infection with RSV (MOI = 1.0) for 20 h. The relative expression of RSV RNA was normalized to GAPDH mRNA. E RT-qPCR analysis of the RSV F (Left) and M2-1 (Right) RNA in BEAS-2B cells transfected with pLVX-shRNA2 vector or shLY6E followed by infection with RSV (MOI = 1.0) for 20 h. The relative expression of RSV RNA was normalized to GAPDH mRNA. F RT-qPCR analysis of the RSV F (Left) and M2-1 (Right) RNA in BEAS-2B cells transfected with pLVX-shRNA2 vector or shTCN2 followed by infection with RSV (MOI = 1.0) for 20 h. The relative expression of RSV RNA was normalized to GAPDH mRNA. G Fluorescence microscopy analysis of RSV-mCherry in BEAS-2B cells transfected with pcDNA3.1 vector or Flag-LY6E followed by infection with RSV-mCherry (MOI = 1.0) for 20 h. Scale bars, 200 μm. H Fluorescence microscopy analysis of RSV-mCherry in Hep2 cells transfected with pcDNA3.1 vector or Flag-TCN2 followed by infection with RSV-mCherry (MOI = 1.0) for 20 h. Scale bars, 200 μm. I Western blot analysis of the RSV M2-1 protein in A549 cells transfected with pcDNA3.1 vector or Flag-LY6E or Flag-TCN2 followed by infection with RSV (MOI = 1.0) for 20 h. **p < 0.01 and ***p < 0.001 (two-tailed unpaired Student’s t-test). All data are shown as mean ± s.d. of four independent replicates (AF)
Fig. 10
Fig. 10
Vitamin B12 inhibited RSV infection. A RT–qPCR analysis of RSV F (Left) and M2-1 (Right) RNA in A549 cells pretreated with VB12 (0, 5 and 10 μM) for 24 h, and then infected with RSV (MOI = 1.0) for 20 h. The relative expression of RSV RNA was normalized to GAPDH mRNA. B RT–qPCR analysis of RSV F (Left) and M2-1 (Right) RNA in Hep2 cells pretreated with VB12 (0, 10 and 20 μM) for 24 h, and then infected with RSV (MOI = 1.0) for 20 h. The relative expression of RSV RNA was normalized to GAPDH mRNA. C Western blot analysis of RSV M2-1 protein in A549 cells pretreated with VB12 (0, 5, 10 and 20 μM) for 24 h, and then infected with RSV (MOI = 1.0) for 20 h. D RT-qPCR analysis of the RSV F RNA in BEAS-2B cells transfected with pLVX-shRNA2 vector or shTCN2 and then treated with VB12 (10 μM) for 24 h, followed by infection with RSV (MOI = 1) for 20 h. *p < 0.05, **p < 0.01 and ***p < 0.001 (two-tailed unpaired Student’s t-test or one-way analysis of variance). All data are shown as mean ± s.d. of four independent replicates (A, B, D)

Similar articles

References

    1. Guzmán Molina C, Rodríguez-Belvís MV, Coroleu Bonet A, Vall Combelles O, García-Algar O. Antibiotics in respiratory tract infections in hospital pediatric emergency departments. Arch Bronconeumol. 2014;50(9):375–8. - PubMed
    1. Tenenbaum T. Respiratory tract infections in children. Pathogens. 2021;10(12). - PMC - PubMed
    1. Qiu X, Xu S, Lu Y, Luo Z, Yan Y, Wang C, Ji J. Development of mRNA vaccines against respiratory syncytial virus (RSV). Cytokine Growth Factor Rev. 2022;68:37–53. - PubMed
    1. Esposito S, Abu Raya B, Baraldi E, Flanagan K, Martinon Torres F, Tsolia M, Zielen S. RSV prevention in all infants: which is the most preferable strategy? Front Immunol. 2022;13: 880368. - PMC - PubMed
    1. Ramagopal G, Brow E, Mannu A, Vasudevan J, Umadevi L. Demographic, clinical and hematological profile of children with bronchiolitis: a comparative study between respiratory synctial virus [RSV] and [Non RSV] groups. J Clin Diagn Res. 2016;10(8):Sc05-08. - PMC - PubMed