. 2024 Aug 20;27(9):110773.
doi: 10.1016/j.isci.2024.110773. eCollection 2024 Sep 20.

β-hydroxybutyrate recapitulates the beneficial effects of ketogenic metabolic therapy in polycystic kidney disease

Affiliations

β-hydroxybutyrate recapitulates the beneficial effects of ketogenic metabolic therapy in polycystic kidney disease

Jacob A Torres et al. iScience. .

Abstract

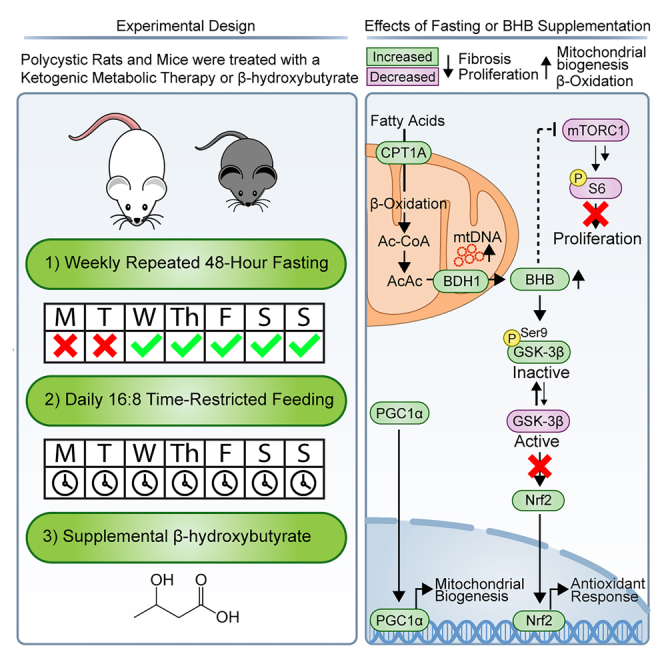
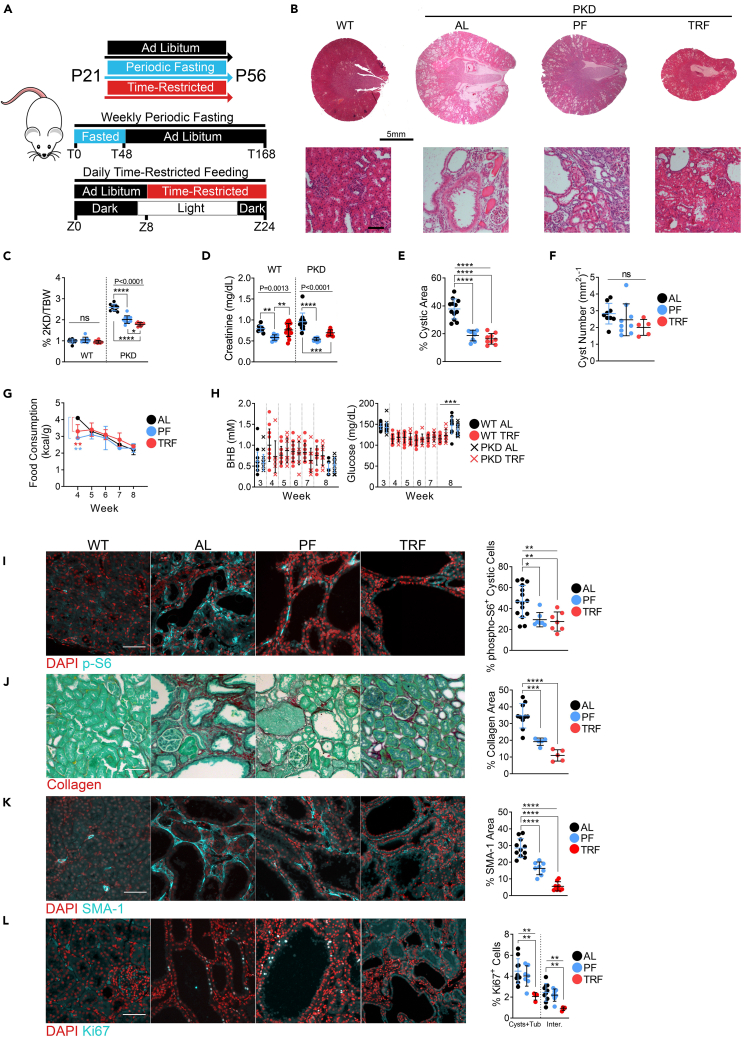
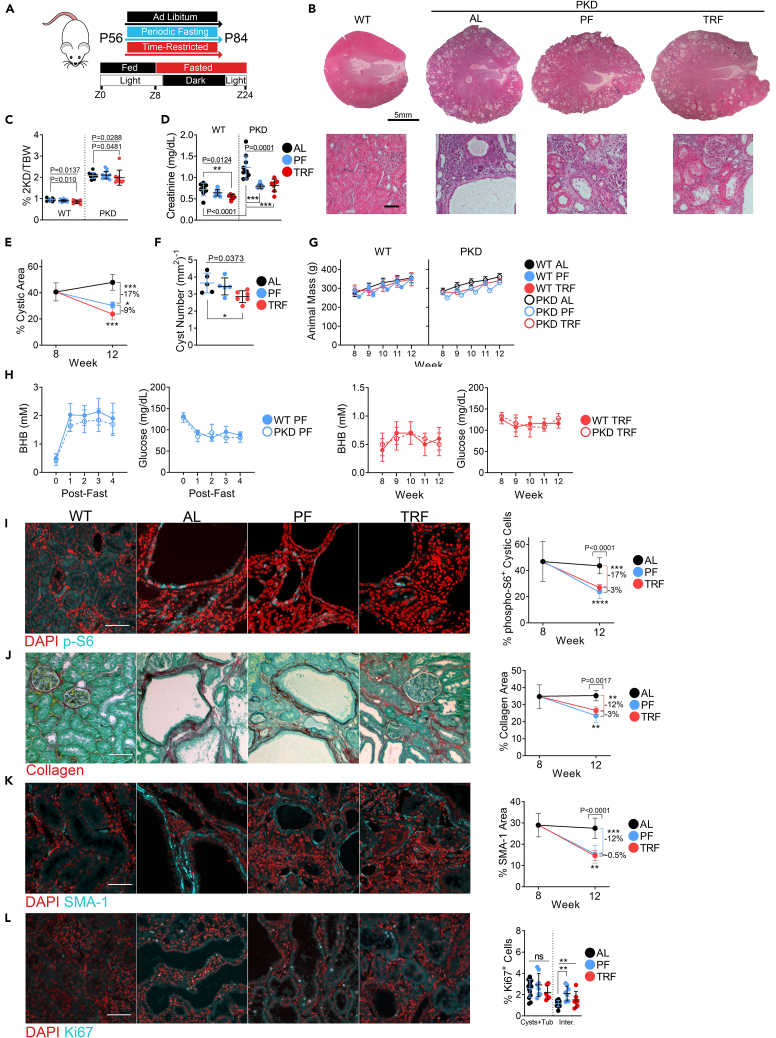
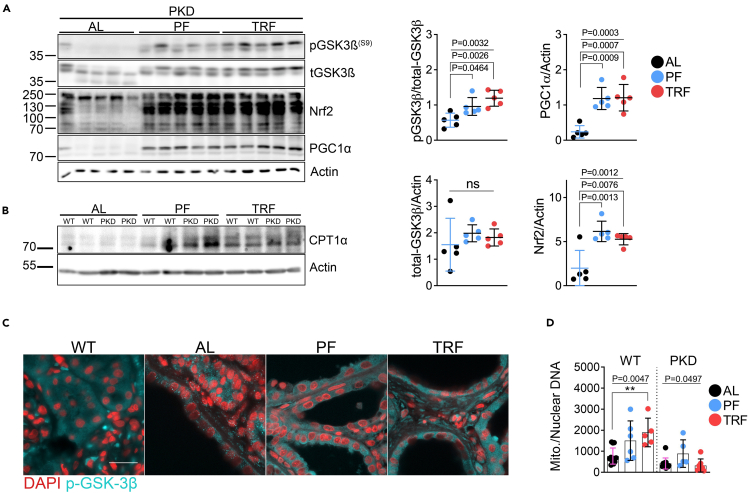
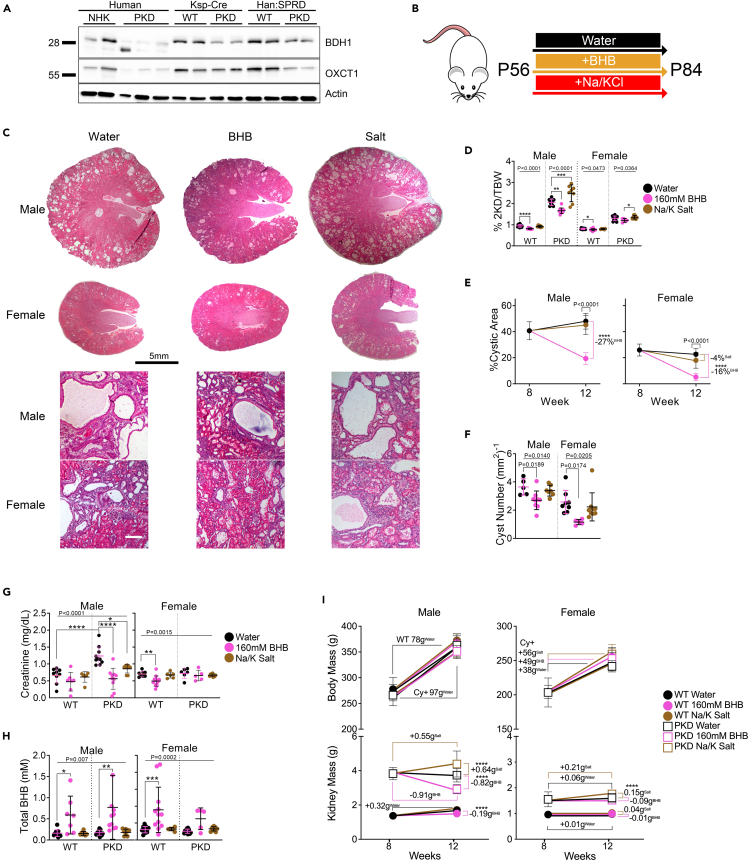
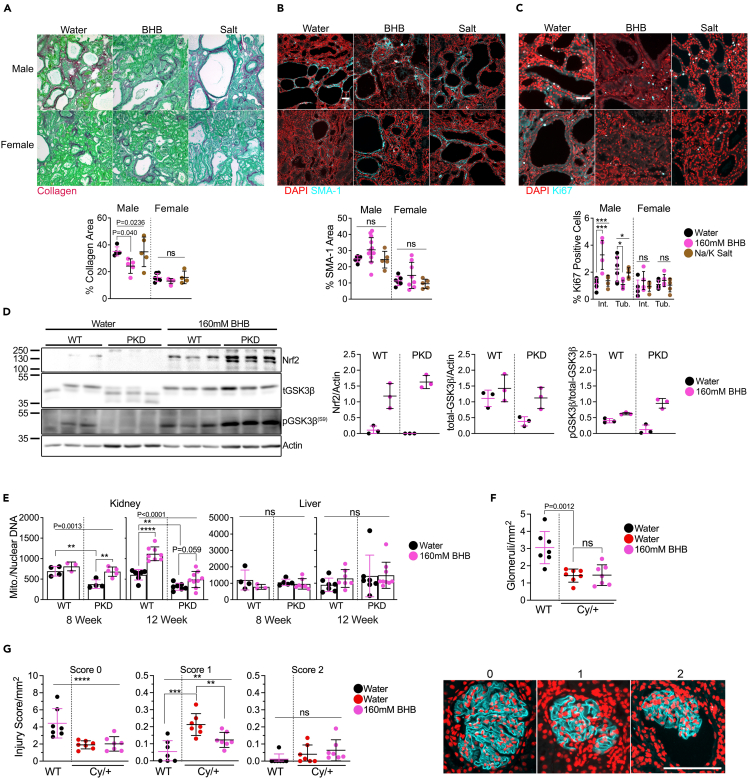
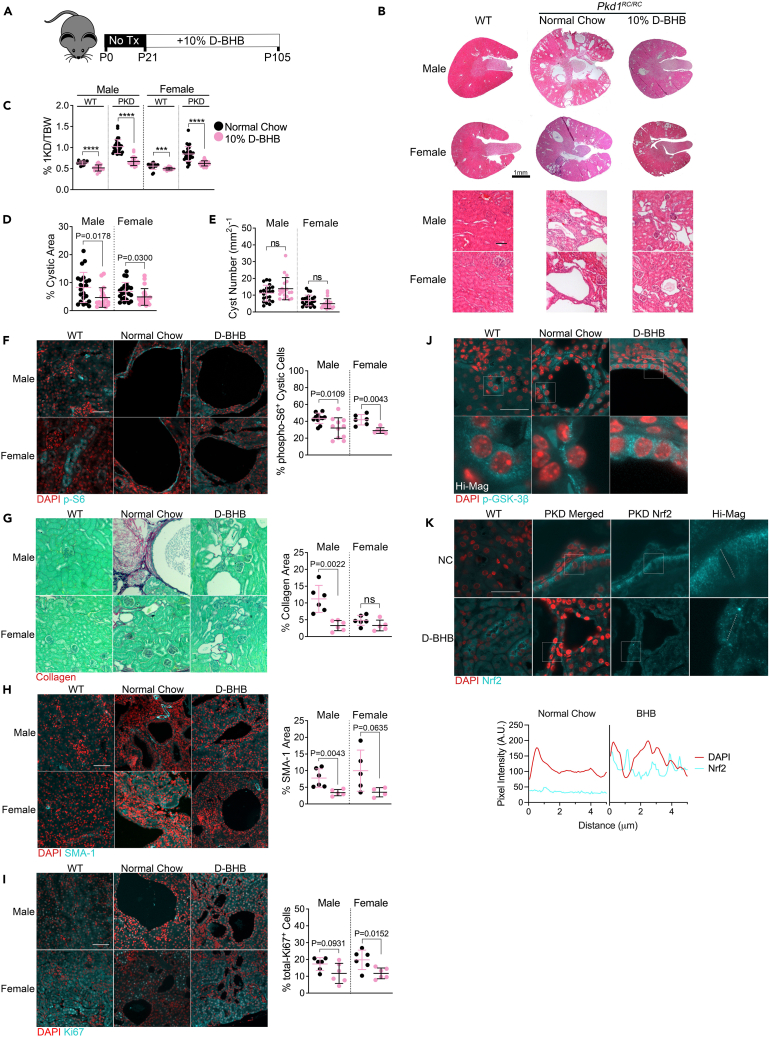
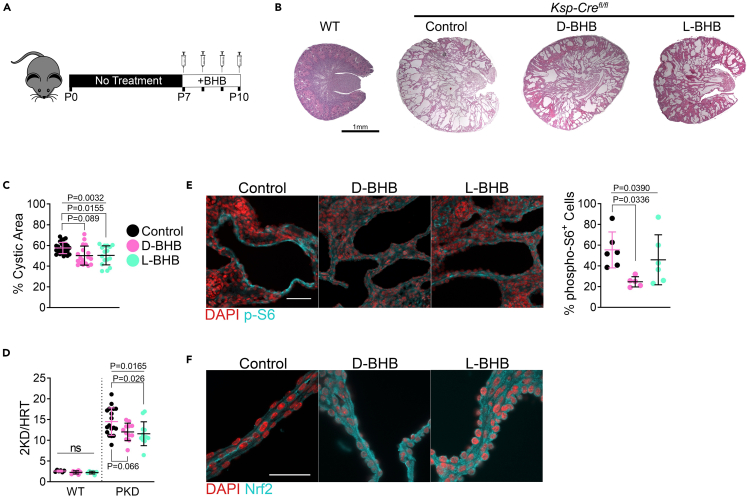
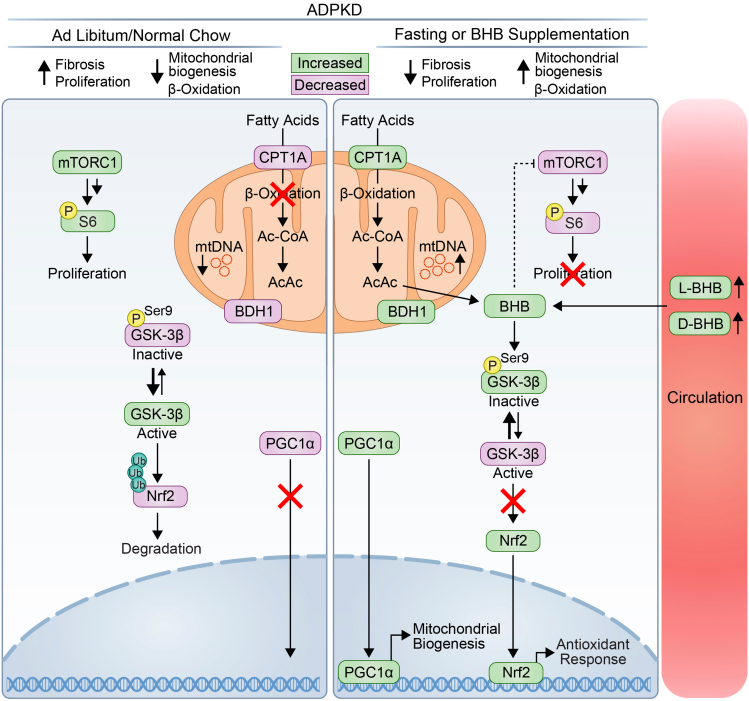
Autosomal-dominant polycystic kidney disease (ADPKD) is a common monogenic disease characterized by the formation of fluid-filled renal cysts, loss of mitochondrial function, decreased fatty acid oxidation, increased glycolysis, and likely renal failure. We previously demonstrated that inducing a state of ketosis ameliorates or reverses PKD progression in multiple animal models. In this study, we compare time-restricted feeding and 48-h periodic fasting regimens in both juvenile and adult Cy/+ rats. Both fasting regimens potently prevent juvenile disease progression and partially reverse PKD in adults. To explore the mechanism of fasting, we administered β-hydroxybutyrate (BHB) to Cy/+ rats and orthologous mouse models of PKD (Pkd1 RC/RC , Pkd1-Ksp:Cre). BHB recapitulated the effects of fasting in these models independent of stereoisomer, suggesting the effects of BHB are largely due to its signaling functions. These findings implicate the use of ketogenic metabolic therapy and BHB supplementation as potential disease modifiers of PKD and point toward underlying mechanisms.

Keywords: Diet; Pathophysiology; Therapy.


Conflict of interest statement

J.A.T. and T.W. are partial owners in the Benefit Corporation Santa Barbara Nutrients and are inventors on US patent No. 11,013,705 and International Publication No. WO 2020/186154 A1 for the use of the combination of BHB and citrate in PKD. T.W. was on the scientific advisory board of Chinook Therapeutics and has received research funding from Chinook Therapeutics and Kyowa Kirin, and speaker fees from Otsuka. T.W. was on the scientific advisory board of Chinook Therapeutics.

Figures

None
Graphical abstract
Figure 1
Figure 1
Periodic fasting and time-restricted feeding ameliorate polycystic kidney disease progression in juvenile Cy/+ Rats (A) Schematic of feeding and experimental designs for juvenile rat experiments. (B) Hematoxylin and Eosin stained kidneys from male wild-type and male polycystic ad libitum, PF and TRF rats. Scale = 5mm (Top); 100μm (Bottom). (C) 2-kidney over body weight of ad libitum, PF and TRF male wild-type and polycystic rats. (D) Serum creatinine of ad libitum, PF and TRF male wild-type and polycystic rats. (E) Cystic area of ad libitum, PF and TRF male wild-type and polycystic rats. (F) Cyst number per mm2 of kidney from ad libitum, PF and TRF male wild-type and polycystic rats. (G) Weekly food consumption of ad libitum, PF and TRF male rats. (H) Blood BHB and blood glucose of ad libitum, PF and TRF male wild-type and polycystic rats. (I) Immunofluorescence of phospho-S6235/236 and quantification of cytoplasmic phospho-S6235/236 within cystic epithelia in male wild-type ad libitum, and male polycystic ad libitum, PF and TRF rats. Scale = 50μm. (J) Sirius Red and Fast Green stain for collagen (red) and quantification from male wild-type ad libitum and male polycystic ad libitum, PF and TRF rats. Scale = 70μm. (K) Immunofluorescence of Smooth Muscle Actin (SMA-1) and quantification from male wild-type ad libitum and male polycystic ad libitum, PF and TRF rats. Scale = 50μm. (L) Immunofluorescence of Ki67 and quantification from male wild-type ad libitum and male polycystic ad libitum, PF and TRF rats. Scale = 50μm. (See also Figures S1 and S2. One-way ANOVA followed by ad hoc Tukey’s test was used for multiple comparisons. A paired t-test was used for single groups. Mean and standard deviations are shown. ∗ = p < 0.05, ∗∗∗ = p < 0.01, ∗∗ = p < 0.001, ∗∗∗∗ = p < 0.0001).
Figure 2
Figure 2
Periodic fasting and time-restricted feeding ameliorate and reverse polycystic kidney disease progression in adult Cy/+ Rats (A) Schematic of PF and TRF feeding experimental timeline and time-restricted feeding schedule for adult Cy/+ rats. (B) Hematoxylin and Eosin stained of 12-week-old male wild-type ad libitum and male polycystic ad libitum, PF and TRF rats. Scale = 5mm (Top); 100μm (Bottom). (C) 2-kidney over body weight of ad libitum, PF and TRF male wild-type and polycystic rats. (D) Serum creatinine of ad libitum, PF and TRF male wild-type and polycystic rats. (E) Change in the cystic area between 8-week-old ad libitum and 12-week-old ad libitum, PF and TRF male polycystic rats. (F) Cyst number per mm2 of kidney from ad libitum, PF and TRF male polycystic rats. (G) Weekly average animal masses of ad libitum, PF and TRF male wild-type and polycystic rats. (H) Weekly blood BHB and blood glucose averages from male wild-type and polycystic rats. (Left) Blood measurements were taken before fasting (time 0) and at the end of each 2-day fast for periodic fasted rats. (Right) The weekly blood values for time-restricted rats collected at the end of the time-restricted fasting period. (I) Immunofluorescence of phospho-S6235/236 and the change in cytoplasmic phospho-S6235/236 signals within cystic epithelia between 8-week-old ad libitum and 12-week-old ad libitum, PF and TRF male polycystic rats. Scale = 50μm. (J) Sirius Red and Fast Green stain for collagen (red) and the change in collagen deposition between 8-week-old ad libitum and 12-week-old ad libitum, PF and TRF male polycystic rats. (K) Immunofluorescence of Smooth Muscle Actin (SMA-1) and the change in SMA-1 signal between 8-week-old ad libitum and 12-week-old ad libitum, PF and TRF male polycystic rats. Scale = 50μm Scale = 70μm. (L) Immunofluorescence of Ki67 and the quantification of Ki67 signal in cysts/tubules and interstitial cells from ad libitum, PF and TRF adult male polycystic rats. Scale = 50μm. (See also Figures S3–S6. One-way ANOVA followed by ad hoc Tukey’s test was used for multiple comparisons. Mean and standard deviations are shown. ∗ = p < 0.05, ∗∗ = p < 0.01, ∗∗∗ = p < 0.001, ψ = p < 0.0001).
Figure 3
Figure 3
Periodic fasting and time-restricted feeding increases Nrf2 expression, GSK-3ß phosphorylation and proteins for fatty acid oxidation (A) Western blot and quantification of total and phosphorylated GSK-3βS9, Nrf2, and PGC1α from 12-week-old ad libitum, PF and TRF male polycystic rat kidneys. (B) Western blot of CPT1α from 12-week-old ad libitum, PF and TRF male polycystic rat kidneys. (C) Immunofluorescence of phosphorylated-GSK-3βS9 in male wild-type ad libitum and male polycystic ad libitum, PF and TRF rats. Scale = 20μm. (D) Quantification of mitochondrial and nuclear DNA from 12-week-old ad libitum, PF and TRF male wild-type and cystic rat kidneys. (See also Figures S3–S6. One-way ANOVA followed by ad hoc Tukey’s test was used for multiple comparisons. Mean and standard deviations are shown. ∗ = p < 0.05, ∗∗ = p < 0.01).
Figure 4
Figure 4
BHB alone reverses signs of polycystic kidney disease in adult Cy/+ Rats (A) Western blot of β-hydroxybutyrate dehydrogenase 1 (BDH1) and 3-oxoacid CoA-transferase (OXCT1) from human, Pkd1-Ksp:Cre and Han:SPRD (Cy/+) rat wild-type and polycystic kidneys. NHK = Normal Human Kidney. (B) Treatment scheme for adult BHB experiments. (C) Hematoxylin and eosin stained kidneys from 12-week-old polycystic rats supplemented with water, 160mM BHB, or sodium/potassium salts in drinking water. Scale bar = 5mm (Top) and 50μm (Bottom). (D) 2-kidney over body weight of water, 160mM BHB, and salt-supplemented wild-type and polycystic rats. (E) Change in the cystic area between 8-week-old water and 12-week-old water, 160mM BHB, and salt-supplemented male and female polycystic rats. (F) Quantification of the number of cysts per mm2 from whole kidney sections of water, 160mM BHB, and salt-supplemented male and female polycystic rats. (G) Serum creatinine from water, 160mM BHB, and salt-supplemented male and female wild-type and polycystic rats. (H) Serum total-BHB (L and D-BHB combined) values from water, 160mM BHB, and salt-supplemented male and female wild-type and polycystic rats. (I) Changes in kidney and body masses between 8-week-old water and 12-week-old water, 160mM BHB, and salt-supplemented male and female wild-type and polycystic rats. (See also Figure S7. One-way ANOVA followed by ad hoc Tukey’s test was used for multiple comparisons. Mean and standard deviations are shown. ∗ = p < 0.05, ∗∗ = p < 0.01, ∗∗∗ = p < 0.001, ∗∗∗∗ = p < 0.0001).
Figure 5
Figure 5
BHB ameliorates fibrosis in adult Cy/+ rats, activates preserves mitochondrial number, and increases phosphorylated-GSK-3β and Nrf2 expression (A) Sirius Red and Fast Green stain and quantification of water, 160mM BHB, and salt-supplemented male and female polycystic rats. Scale = 50μm. (B) Smooth Muscle Actin (SMA-1) immunofluorescence and quantification of water, 160mM BHB, and salt-supplemented male and female wild-type and polycystic rats. Scale = 50μm. (C) Ki67 immunofluorescence stain and quantification of water, 160m BHB, or salt-supplemented male and female wild-type and polycystic rats. Scale = 50μm. (D) Western blot and quantification of Nrf2 and total and phosphorylated GSK-3β from water and 160mM BHB supplemented male wild-type and polycystic rats. (E) Quantification of mitochondrial and nuclear DNA from kidneys and livers of water and 160Mm BHB supplemented 8-week-old and 12-week-old male wild-type and polycystic rats. (F) Number of glomeruli counted from 12-week-old male water-supplemented wild-type, water-supplemented PKD, and 160mM BHB-supplemented PKD rats. (G) (Left) Glomerular injury scoring over the measured kidney area from 12-week-old male water-supplemented wild-type, water-supplemented PKD, and 160mM BHB-supplemented PKD rats and (Right) examples of glomeruli immunostained for podocin and used for scoring rubric for quantification. Scale bar = 100μm. Rats were scored as follows. 0: No obvious morphological changes; normal. 1: Morphological change, e.g., changes in shape and structure. 2: Morphological changes as well as decreased filling of glomeruli space, increase in distance between Bowman’s capsule and podocin staining. (See also Figure S7. One-way ANOVA followed by ad hoc Tukey’s test was used for multiple comparisons. Mean and standard deviations are shown. ∗∗ = p < 0.01, ∗∗∗ = p < 0.001, ∗∗∗∗ = p < 0.0001).
Figure 6
Figure 6
BHB supplementation ameliorates PKD progression in an orthologous mouse model of PKD (A) Schematic of experimental design for BHB administration in Pkd1+/+and Pkd1RC/RC mice. (B) Hematoxylin and eosin-stained male and female mice kidneys from 3-month-old Pkd1+/+, Pkd1RC/RC, or Pkd1RC/RC supplemented with D-BHB. Scale = 1mm. (C) Kidney over bodyweight of all kidneys collected from Normal Chow and D-BHB supplemented 3-month-old Pkd1+/+ and Pkd1RC/RC male and female wild-type and polycystic mice. (D) Cystic area of all kidneys collected from Normal Chow and D-BHB supplemented 3-month-old Pkd1+/+ and Pkd1RC/RC male and female wild-type and polycystic mice. (E) Total Cyst Number of all kidneys collected from Normal Chow and D-BHB supplemented 3-month-old Pkd1+/+ and Pkd1RC/RC male and female wild-type and polycystic mice. (F) Immunofluorescence of phospho-S6235/236 and quantification of cytoplasmic phospho-S6235/236 within cystic epithelia in 3-month-old Pkd1RC/RC male and female wild-type and polycystic mice. Scale = 50μm. (G) Sirius Red and Fast Green stain of collagen (red) and quantification from Normal Chow and D-BHB supplemented 3-month-old Pkd1RC/RC male and female wild-type and polycystic mice. Scale = 70μm. (H) Immunofluorescence images and quantification of total Smooth Muscle Actin (SMA-1) positive area in kidneys from Normal Chow and D-BHB supplemented 3-month-old Pkd1RC/RC male and female wild-type and polycystic mice. Scale = 50μm. (I) Immunofluorescence images and quantification of total Ki67 positive cells in kidneys from Normal Chow and D-BHB supplemented 3-month-old Pkd1RC/RC male and female wild-type and polycystic mice. Scale = 50μm. (J) Immunofluorescence of phospho-GSK-3βS9 in kidneys from Normal Chow and D-BHB supplemented 3-month-old Pkd1RC/RC male wild-type and polycystic mice. Scale = 30μm. (K) Immunofluorescence of Nrf2 in kidneys from Normal Chow and D-BHB supplemented 3-month-old Pkd1RC/RC male wild-type and polycystic mice. Pixel intensity plot of DAPI and Nrf2 fluorescence from high-magnification panels indicated with dotted lines. Scale = 30μm. (See also Figure S8. Mann-Whitney analysis was used to compare the mean between two groups. Mean and standard deviations are shown. ∗∗∗ = p < 0.001, ∗∗∗∗ = p < 0.0001).
Figure 7
Figure 7
Parenteral BHB administration ameliorates disease progression in a juvenile orthologous mouse model (A) Schematic of experimental design for parenteral BHB administration in neonatal Pkd1-Ksp:Cre mice. (B) Hematoxylin and eosin-stained kidneys from P10 wild-type or Pkd1fl/fl-Ksp:Cre control, D-BHB, or L-BHB injected mice. Scale = 1mm. (C) Cystic area of all kidneys collected from P10 control, D-BHB, or L-BHB treated wild-type and Pkd1fl/fl-Ksp:Cre mice. (D) 2–kidney-to-heart ratio from P10 control, D-BHB, or L-BHB-treated wild-type and Pkd1fl/fl-Ksp:Cre mice. (E) Immunofluorescence of phospho-S6235/236 and quantification of cytoplasmic phospho-S6235/236 within cystic epithelia in P10 control, D-BHB, and L-BHB-treated Pkd1fl/fl-Ksp:Cre mice kidneys. Scale = 50μm. (F) Immunofluorescence of Nrf2 in P10 control, D-BHB, and L-BHB-treated Pkd1fl/fl-Ksp:Cre mice kidneys. Scale = 50μm. (See also Figure S9. Male and female mice were used for this experiment. One-way ANOVA followed by ad hoc Tukey’s test was used for multiple comparisons. Mean and standard deviations are shown).
Figure 8
Figure 8
Mechanistic model of action of BHB during fasting in ADPKD mTORC1 and GSK-3beta activity are high during ad libitum normal chow feeding in PKD, leading to ubiquitination and degradation of Nrf2. Fasting or BHB supplementation inhibits mTORC1 activity and promotes GSK-3β phosphorylation and subsequent accumulation of Nrf2 and nuclear translocation. Additionally, fasting and BHB facilitate an increase in mitochondrial DNA number, and fatty acid oxidation and mitochondrial-associated proteins. Functionally, fasting and BHB affects PKD by decreasing fibrosis and proliferation. (Green highlighted symbols represent proteins increased, and purple highlighted symbols represent decreased proteins. Dashed line represents indirect inhibition. Multiple arrows represent multi-step activation).

References

    1. Rossetti S., Consugar M.B., Chapman A.B., Torres V.E., Guay-Woodford L.M., Grantham J.J., Bennett W.M., Meyers C.M., Walker D.L., Bae K., et al. Comprehensive Molecular Diagnostics in Autosomal Dominant Polycystic Kidney Disease. J. Am. Soc. Nephrol. 2007;18:2143–2160. doi: 10.1681/ASN.2006121387. - DOI - PubMed
    1. Erickson K.F., Chertow G.M., Goldhaber-Fiebert J.D. Cost-Effectiveness of Tolvaptan in Autosomal Dominant Polycystic Kidney Disease. Ann. Intern. Med. 2013;159:382–389. doi: 10.7326/0003-4819-159-6-201309170-00004. - DOI - PMC - PubMed
    1. Anderson C.L. Doubts about the efficacy of tolvaptan for polycystic kidney disease. Clin. Nephrol. 2020;93:307–309. doi: 10.5414/CN109927Letter. - DOI - PubMed
    1. Warner G., Hein K.Z., Nin V., Edwards M., Chini C.C.S., Hopp K., Harris P.C., Torres V.E., Chini E.N. Food Restriction Ameliorates the Development of Polycystic Kidney Disease. J. Am. Soc. Nephrol. 2016;27:1437–1447. doi: 10.1681/ASN.2015020132. - DOI - PMC - PubMed
    1. Torres J.A., Kruger S.L., Broderick C., Amarlkhagva T., Agrawal S., Dodam J.R., Mrug M., Lyons L.A., Weimbs T. Ketosis Ameliorates Renal Cyst Growth in Polycystic Kidney Disease. Cell Metabol. 2019;30:1007–1023.e5. doi: 10.1016/j.cmet.2019.09.012. - DOI - PMC - PubMed