[Preprint]. 2024 Sep 9:2024.09.09.611245.
doi: 10.1101/2024.09.09.611245.

Three-dimensional analysis of mitochondria in a patient-derived xenograft model of triple negative breast cancer reveals mitochondrial network remodeling following chemotherapy treatments

Affiliations

Three-dimensional analysis of mitochondria in a patient-derived xenograft model of triple negative breast cancer reveals mitochondrial network remodeling following chemotherapy treatments

Mariah J Berner et al. bioRxiv. .

Abstract

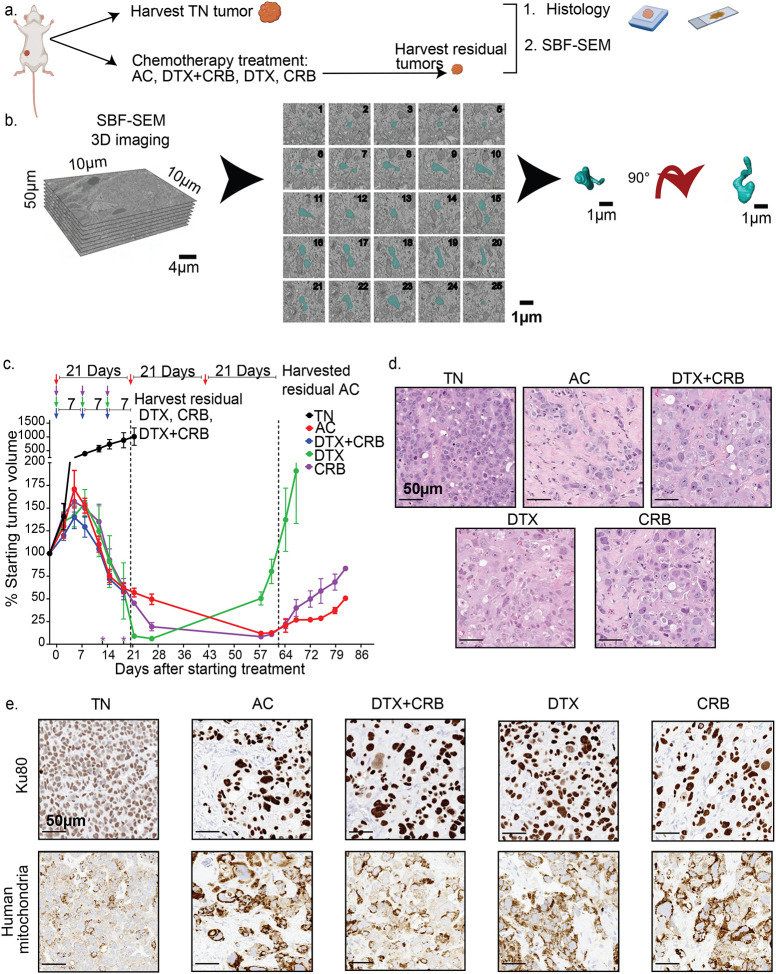
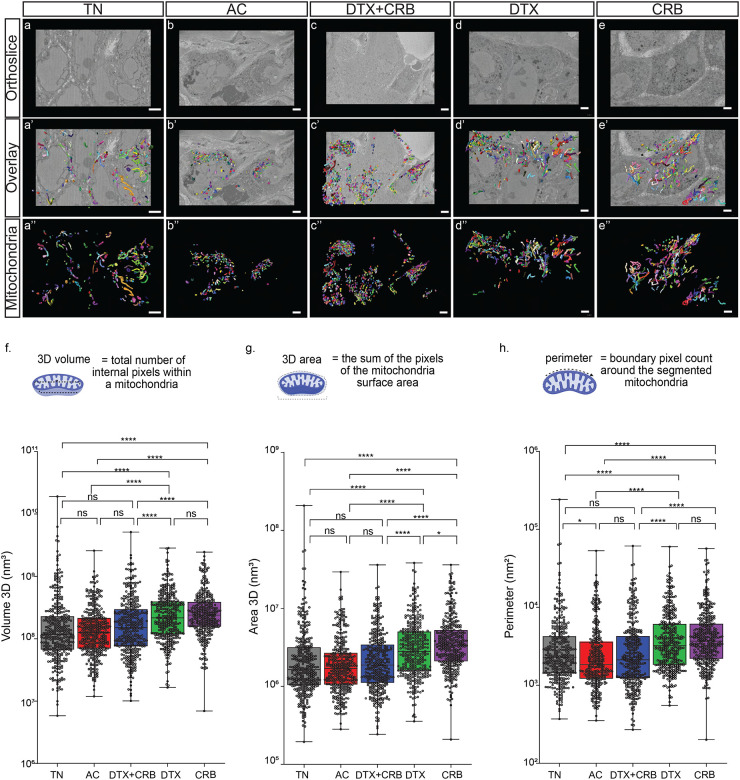
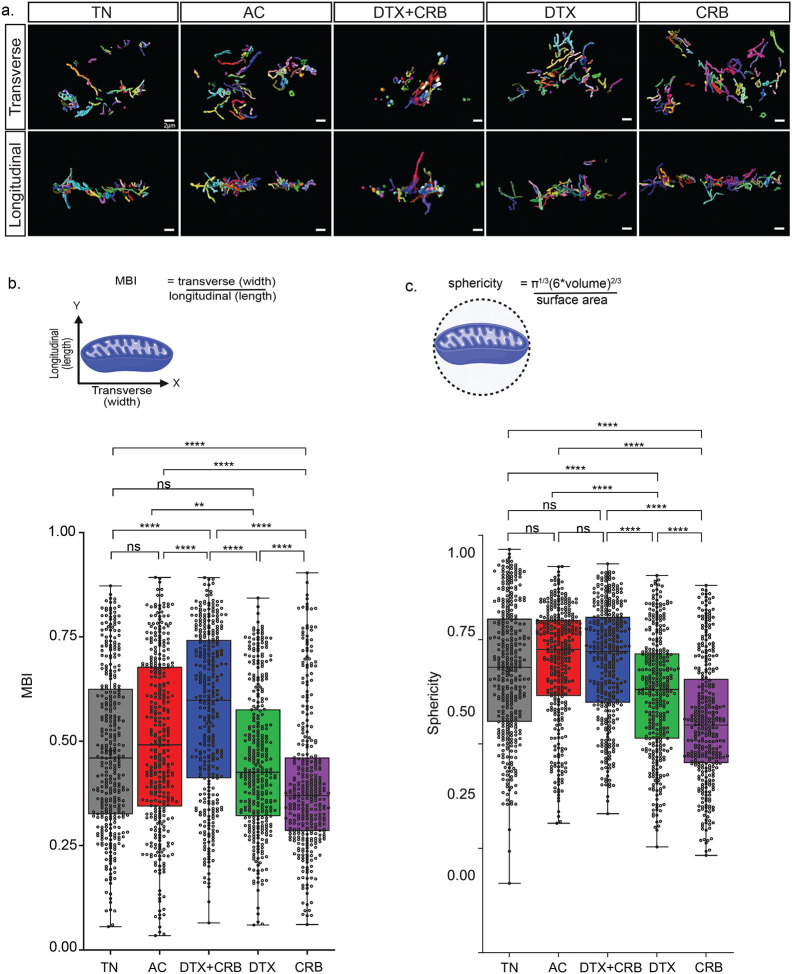
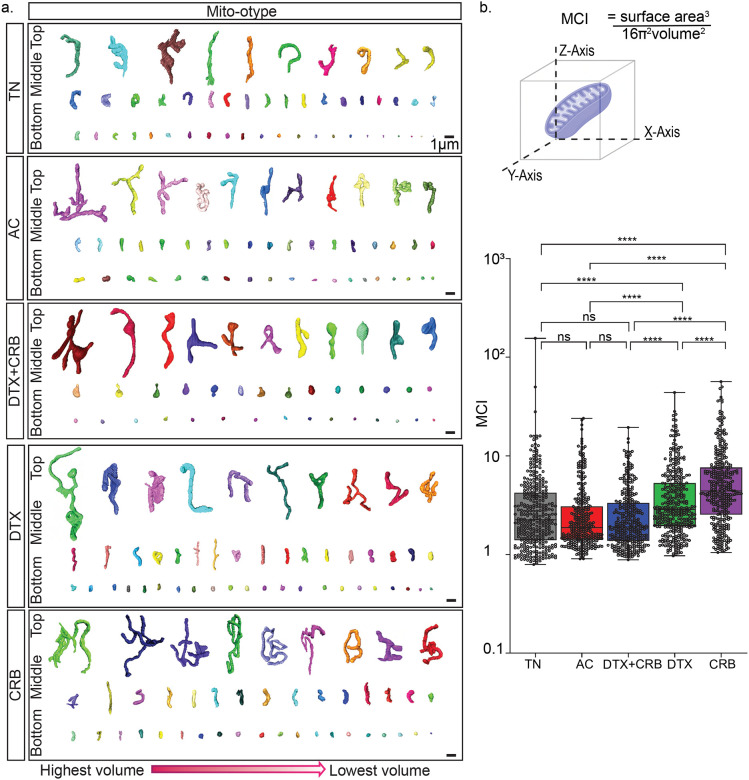
Mitochondria are hubs of metabolism and signaling and play an important role in tumorigenesis, therapeutic resistance, and metastasis in many cancer types. Various laboratory models of cancer demonstrate the extraordinary dynamics of mitochondrial structure, but little is known about the role of mitochondrial structure in resistance to anticancer therapy. We previously demonstrated the importance of mitochondrial structure and oxidative phosphorylation in the survival of chemotherapy-refractory triple negative breast cancer (TNBC) cells. As TNBC is a highly aggressive breast cancer subtype with few targeted therapy options, conventional chemotherapies remain the backbone of early TNBC treatment. Unfortunately, approximately 45% of TNBC patients retain substantial residual tumor burden following chemotherapy, associated with abysmal prognoses. Using an orthotopic patient-derived xenograft mouse model of human TNBC, we compared mitochondrial structures between treatment-naïve tumors and residual tumors after conventional chemotherapeutics were administered singly or in combination. We reconstructed 1,750 mitochondria in three dimensions from serial block-face scanning electron micrographs, providing unprecedented insights into the complexity and intra-tumoral heterogeneity of mitochondria in TNBC. Following exposure to carboplatin or docetaxel given individually, residual tumor mitochondria exhibited significant increases in mitochondrial complexity index, area, volume, perimeter, width, and length relative to treatment-naïve tumor mitochondria. In contrast, residual tumors exposed to those chemotherapies given in combination exhibited diminished mitochondrial structure changes. Further, we document extensive intra-tumoral heterogeneity of mitochondrial structure, especially prior to chemotherapeutic exposure. These results highlight the potential for structure-based monitoring of chemotherapeutic responses and reveal potential molecular mechanisms that underlie chemotherapeutic resistance in TNBC.


Figures

Figure 1.
Figure 1.. PDX TNBC tumors persist following conventional chemotherapy treatments.
(a) The experimental approach used in the study. Images were adapted from BioRender. (b) SBF-SEM 3D rendering approach. (c) Tumor volumes were monitored biweekly following administration of chemotherapies to mice bearing orthotopic PIM001-P tumors (n = 6 mice/group). Arrows at the top indicate when chemotherapy was administered. Asterisks (*) above the x-axis indicate early euthanasia due to animal health concerns. Residual tumors were harvested, as noted by arrows. Error bars represent the standard error of the mean. (d) Residual tumors were harvested, processed for FFPE, and analyzed by H&E staining, (e) IHC for Ku80 and human-specific mitochondria. Scale bars are 50 μm.
Figure 2.
Figure 2.. Several mitochondrial features were significantly altered by single-agent chemotherapy treatments.
(a-e) Representative SBF-SM orthoslices. (a’-e’) Representative 3D SBF-SEM orthoslices with overlays of mitochondria segmentations. (a”-e”) Representative 3D SBF-SEM mitochondria segmentations for each treatment group: treatment-naïve (TN), Adriamycin + cyclophosphamide (AC), docetaxel + carboplatin (DTX+CRB), docetaxel (DTX), and carboplatin (CRB). The scale bar is 3 μm. Mitochondrial measurements were calculated using Amira software for 350 segmented mitochondria (represented as dots) from each tumor for (f) volume, (g) 3D area, (h), and perimeter. Adjusted p-values (*p < 0.05, **p < 0.01, ***p < 0.001, ****p<0.0001) are shown on box and whisker plots as determined using the Mann–Whitney U test followed by the Holm method.
Figure 3.
Figure 3.. Single chemotherapeutic agent treated residual tumors have the greatest mitochondrial complexity.
Mitochondrial networks revealed through 3D mitochondria rendered using SBF-SEM. (a) Representative longitudinal and transverse views of the segmented mitochondria for each treatment group: treatment-naïve (TN), Adriamycin + cyclophosphamide (AC), docetaxel + carboplatin (DTX+CRB), docetaxel (DTX), and carboplatin (CRB). The scale bar is 3 μm. Mitochondrial measurements were calculated using Amira software for 350 segmented mitochondria (represented as dots) from each tumor for (b) mitochondrial branching index (MBI) and (c) sphericity, along with their respective method of measurements below. Adjusted p-values (*p < 0.05, **p < 0.01, ***p < 0.001, ****p<0.0001) are shown on box and whisker plots as determined using the Mann–Whitney U test followed by the Holm method.
Figure 4.
Figure 4.. Mito-otyping of the diverse mitochondria structures observed within each treatment group.
(a) Representative mitochondria structures from the bottom, middle, and top 10% of the 3D volume for tumors are displayed. Scale bars are 1μm. (b) Diagram of the mitochondrial measurements used to characterize mitochondria structure and mitochondria network through the mitochondrial complex index (MCI), as calculated by Amira software for 350 segmented mitochondria (represented as dots) from each tumor. The scale bar is 3 μm. Equations for these measurements are shown in Fig. 4b. Adjusted p-values (*p < 0.05, **p < 0.01, ***p < 0.001, ****p<0.0001) on the box and whisker plots were determined using the Mann–Whitney U test, followed by the Holm method.

References

    1. Harbeck N. et al. Breast cancer. Nat Rev Dis Primers 5, 66 (2019). 10.1038/s41572-019-0111-2 - DOI - PubMed
    1. Bianchini G., De Angelis C., Licata L. & Gianni L. Treatment landscape of triple-negative breast cancer - expanded options, evolving needs. Nat Rev Clin Oncol 19, 91–113 (2022). 10.1038/s41571-021-00565-2 - DOI - PubMed
    1. Schmid P. et al. Pembrolizumab for Early Triple-Negative Breast Cancer. N Engl J Med 382, 810–821 (2020). 10.1056/NEJMoa1910549 - DOI - PubMed
    1. Vagia E., Mahalingam D. & Cristofanilli M. The Landscape of Targeted Therapies in TNBC. Cancers (Basel) 12 (2020). 10.3390/cancers12040916 - DOI - PMC - PubMed
    1. Symmans W. F. et al. Long-Term Prognostic Risk After Neoadjuvant Chemotherapy Associated With Residual Cancer Burden and Breast Cancer Subtype. J Clin Oncol 35, 1049–1060 (2017). 10.1200/JCO.2015.63.1010 - DOI - PMC - PubMed

Publication types