[Preprint]. 2024 Sep 10:2024.09.09.612041.
doi: 10.1101/2024.09.09.612041.

Role of the SAF-A SAP domain in X inactivation, transcription, splicing, and cell proliferation

Affiliations

Role of the SAF-A SAP domain in X inactivation, transcription, splicing, and cell proliferation

Judith A Sharp et al. bioRxiv. .

Update in

Abstract

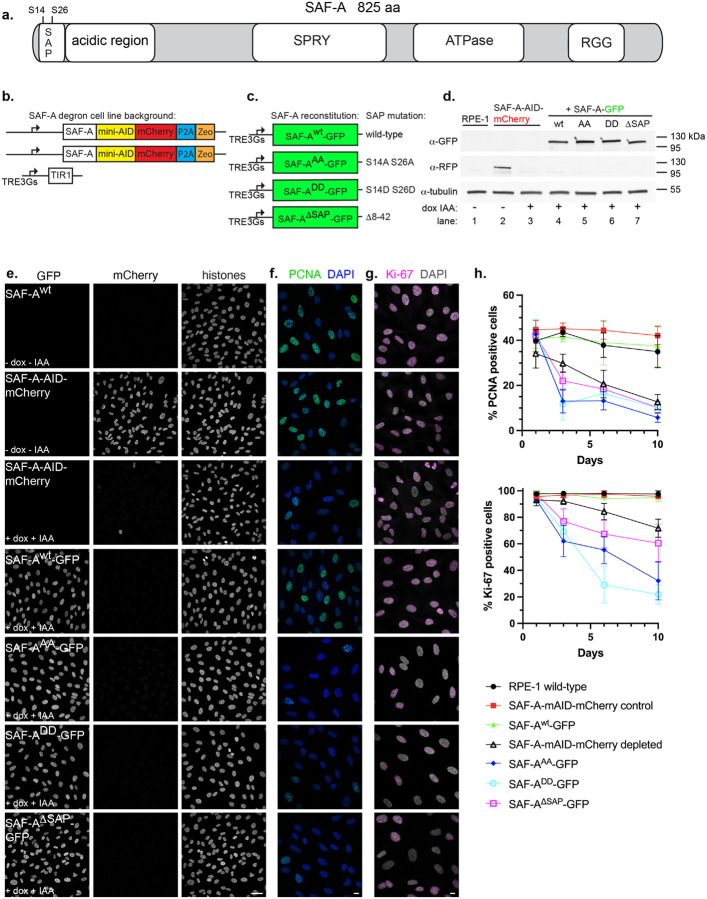
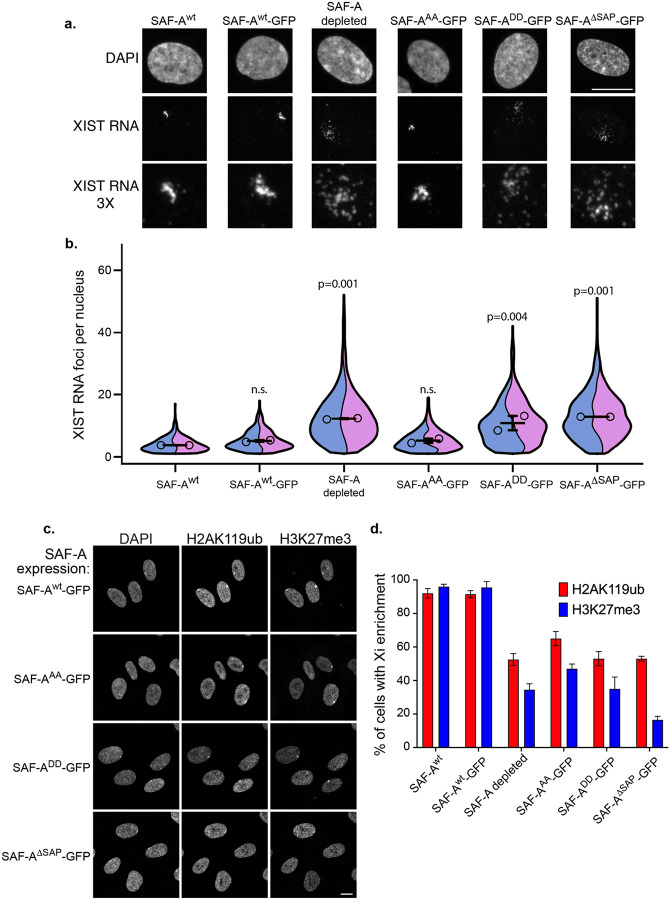
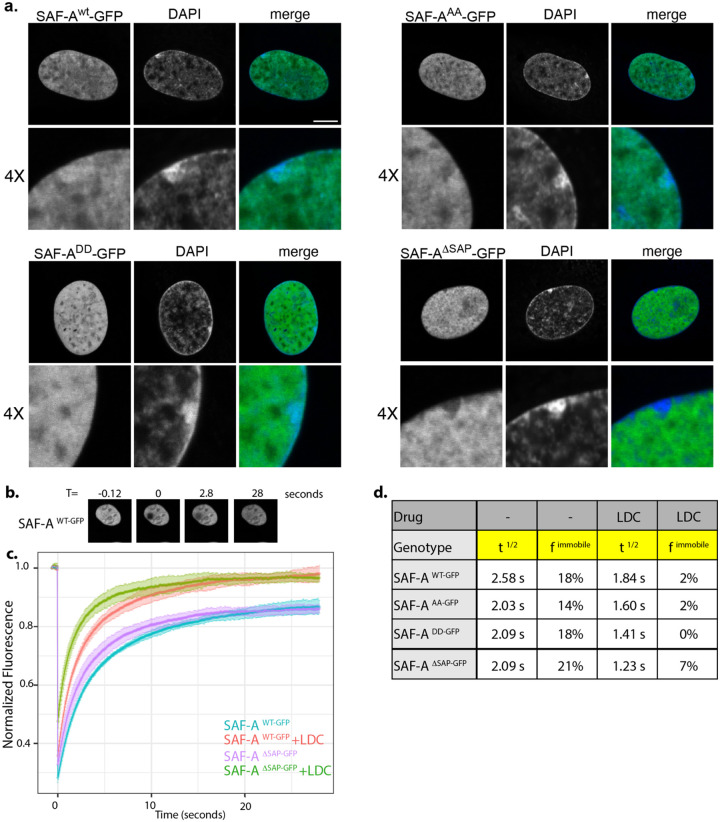
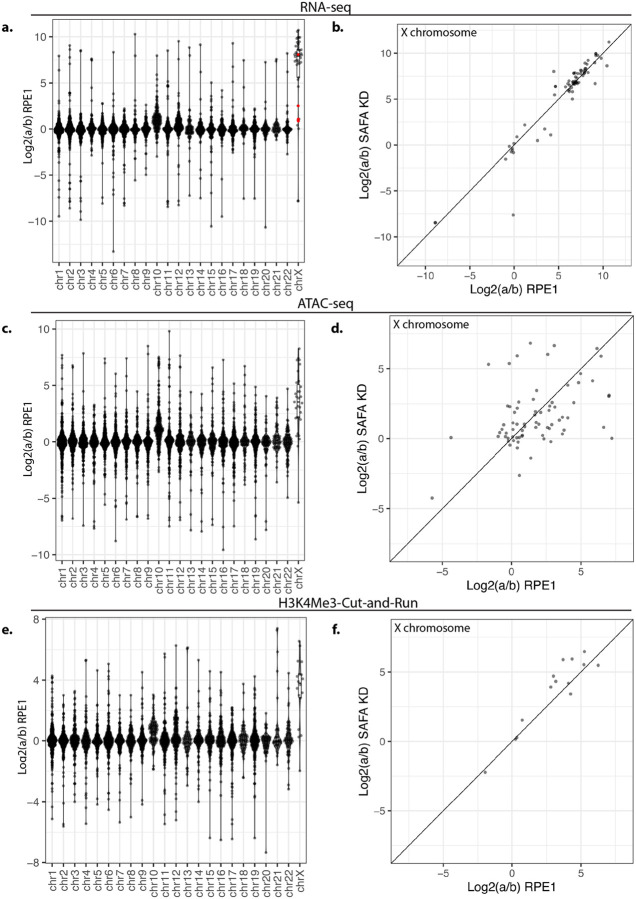
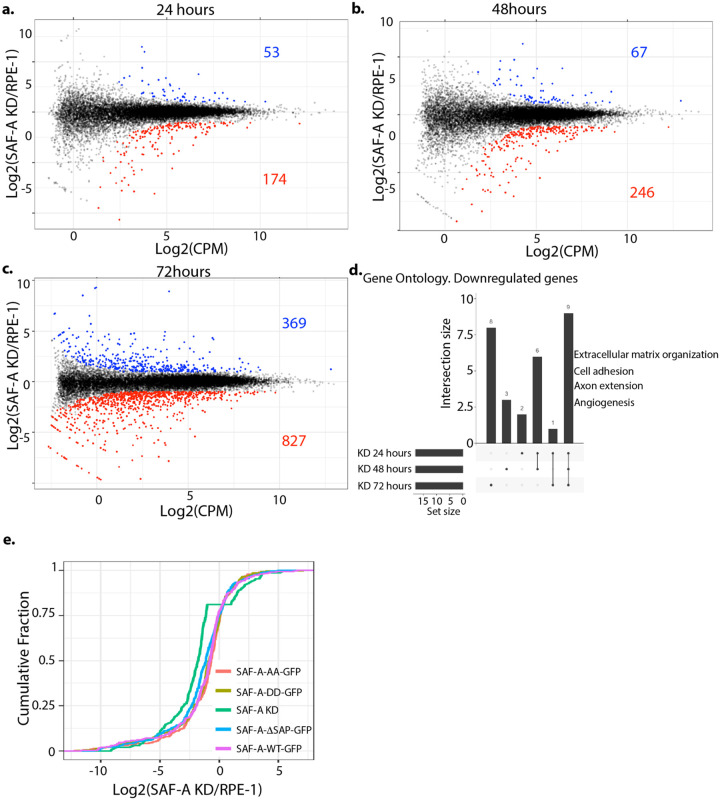
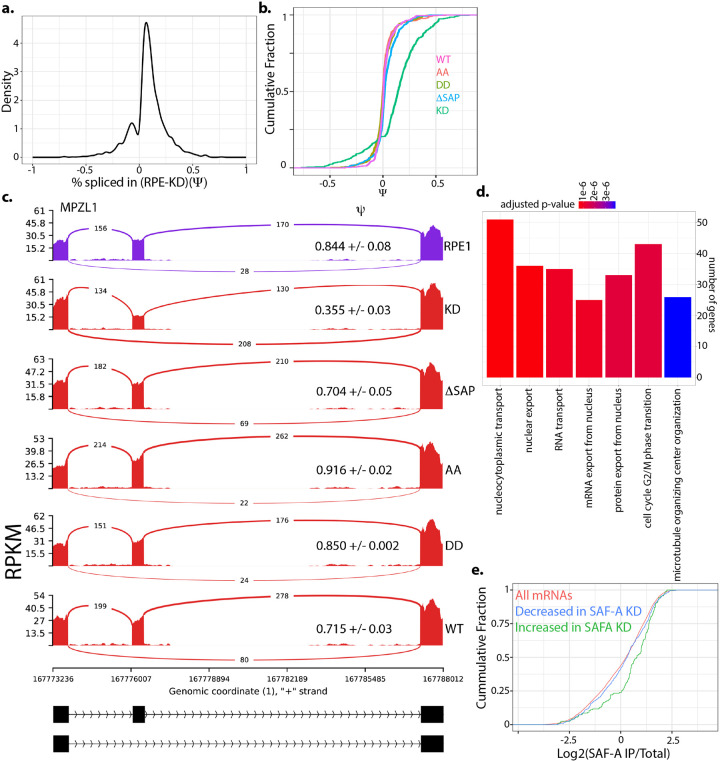
SAF-A is conserved throughout vertebrates and has emerged as an important factor regulating a multitude of nuclear functions, including lncRNA localization, gene expression, and splicing. SAF-A has several functional domains, including an N-terminal SAP domain that binds directly to DNA. Phosphorylation of SAP domain serines S14 and S26 are important for SAF-A localization and function during mitosis, however whether these serines are involved in interphase functions of SAF-A is not known. In this study we tested for the role of the SAP domain, and SAP domain serines S14 and S26 in X chromosome inactivation, protein dynamics, gene expression, splicing, and cell proliferation. Here we show that the SAP domain serines S14 and S26 are required to maintain XIST RNA localization and polycomb-dependent histone modifications on the inactive X chromosome in female cells. In addition, we present evidence that an Xi localization signal resides in the SAP domain. We found that that the SAP domain is not required to maintain gene expression and plays only a minor role in mRNA splicing. In contrast, the SAF-A SAP domain, in particular serines S14 and S26, are required for normal protein dynamics, and to maintain normal cell proliferation. We propose a model whereby dynamic phosphorylation of SAF-A serines S14 and S26 mediates rapid turnover of SAF-A interactions with DNA during interphase.


Figures

Figure 1.
Figure 1.. The SAP domain and phosphorylatable SAP domain serines S14 and 26 are required for cell proliferation.
A. Schematic depicting full-length SAF-A (isoform a, 825 amino acids) with domains drawn to scale. B. Design of the SAF-A-AID-mCherry degron to replace the endogenous SAF-A genes in RPE-1 cells. C. SAF-A transgenes with alanine (phosphomutant) or aspartic acid (phosphomimetic) mutations at positions S14 and S26, or expressing a SAP domain deletion. D. Western blot analysis of SAF-A cell lines to monitor expression of SAF-A-AID-mCherry (α-RFP panel) and SAF-A-GFP (α-GFP panel) in cell lines. Tubulin was used as a loading control. Lane 1: untagged RPE-1 parental cell line. Lane 2: SAF-A degron cell line, either without (lane 2), or with (lane 3) doxycycline and IAA. Lanes 4–7: cells expressing SAF-A-GFP transgenes, treated with doxycycline and IAA. Molecular weight markers are indicated to the right of the panel. E. Immunofluorescence of cells expressing tagged SAF-A, as indicated by the panel insets. Treatment with doxycycline and IAA as indicated led to complete depletion of SAF-A-AID-mCherry in the vast majority of cells. Integrated SAF-A-GFP transgenes showed uniform expression in the cell population after induction. Bar, 40 μm. F-G. PCNA and Ki-67 immunofluorescence to monitor cell proliferation. Cells were treated with doxycycline and IAA to induce endogenous SAF-A depletion and SAF-A-GFP transgene expression, and compared to control cell populations. Cells were treated for 1, 3, 6, or 10 days as indicated. SAF-A expression is the same as the panel insets shown in E. All images in panels E-G are rendered as a maximum projection of a 3D stack. Bar, 10 μm. H. Quantitation of cell populations with PCNA- and Ki-67-positive cells expressed as percent of the total population. 300 cells were scored for PCNA and Ki-67 immunofluorescence in two biological replicates; the average and standard deviation is shown.
Figure 2.
Figure 2.. The SAP domain and SAP domain serines S14 and 26 impact XIST RNA localization and PRC1/PRC2-dependent histone modifications on the Xi.
A. XIST RNA FISH and DAPI staining in RPE-1 cells, and cells expressing SAF-A-GFP transgenes, 24 hours after treatment with doxycycline and IAA. Images are rendered as a maximum projection of a 3D stack. Bar, 10 μm. B. Quantitative measurement of XIST RNA foci per cell. Image stacks were acquired for at least 100 nuclei per genotype for two biological replicates and analyzed in Fiji software to count XIST RNA foci. Measurements are depicted as violin superplots. The average of each replicate is depicted as an open circle, whereas the average of both replicates is depicted as a horizontal line. The standard deviation of the two averages is shown. C. Immunofluorescence of histone H3K27me3 and H2AK119ub and DAPI staining, 24 hours after treatment with doxycycline and IAA. SAF-A-GFP allele expression is indicated to the leY of the panel. Images are rendered as a maximum projection of a 3D stack. Bar, 10 μm. D. Quantitation of cell populations with H3K27me3 and H2AK119ub enrichment on the Xi. 100 cells were scored for H3K27me3 and H2AK119ub enrichment on the Xi in two biological replicates; the average and standard deviation is shown. Cell n for quantitation of XIST RNA particles is: RPE1 193, RPE2 211, SAF-AWT-GFP1 137, SAF-AWT-GFP2 236, SAF-A depletion 1 122, SAF-A depletion 2 220, , SAF-AAA-GFP1 170, , SAF-AAA-GFP2 206, , SAF-ADD-GFP1 133, , SAF-ADD-GFP2 198, SAF-AΔSAP-GFP1 160, , SAF-AΔSAP-GFP2 158. Statistical comparison of number of XIST RNA particles was performed using a one-way ANOVA followed by Tukey’s tests with a Bonferroni correction.
Figure 3.
Figure 3.. The SAF-A SAP domain is important for nuclear dynamics and Xi localization.
A. Live cell analysis of SAF-Awt-GFP and SAP domain mutations as indicated. Cells were analyzed 24 hours after doxycycline and IAA treatment. Each image represents a single 0.2 μm slice. Bar, 10 μm. B. Images from a typical FRAP experiment using SAF-Awt-GFP. C. FRAP recovery curves for SAF-Awt-GFP, SAF-AAA-GFP, SAF-ADDGFP, and SAF-AΔSAP-GFP, with and without transcriptional inhibition (LDC). Standard deviation of recovery is indicated in light colored error bars. D. Table of the t1/2 recovery time and the immobile fraction for all SAF-A-GFP proteins, with and without transcriptional inhibition.
Figure 4.
Figure 4.. SAF-A depletion does not reactivate gene expression on the inactive X chromosome.
A. Allele-specific gene expression was calculated from RNA-seq libraries using a combination of PAC and edgeR in RPE-1 cells. ‘a to ‘b ratios are plotted by gene for each chromosome. B. Average a:b ratio for all genes on the X chromosome plotted for RPE-1 and SAF-A depleted cells. C. Allele-specific ATAC-seq was calculated using PAC and is plotted by gene for each chromosome. D. comparison of allele-specific ATAC-seq reads by gene plotted for RPE-1 cells and SAF-A depleted cells. E. Allele-specific Cut-and-Run for H3K4Me3 was calculated using PAC. ‘a/b’ ratio is plotted by gene for each chromosome. F. Allele-specific Cut-and-Run is plotted for RPE-1 cells and SAF-A depleted cells for X chromosome genes.
Figure 5.
Figure 5.. SAF-A depletion leads to minor defects in gene expression.
A-C. SAF-A was depleted for 24, 48, or 72 hours through addition of auxin and gene expression was evaluated by RNA-seq and EdgeR. MD plots depict differentially expressed genes at each time point. Genes with an FDR < 0.01 are colored. d. Gene Ontology analysis of the genes downregulated following acute SAF-A depletion. e. Cumulative distribution plot depicting the magnitude of change in gene expression in each SAF-A domain mutant of the 227 genes significantly changed following SAF-A depletion (from A).
Figure 6.
Figure 6.. SAF-A depletion leads to widespread changes in mRNA splicing.
A. mRNA splicing was evaluated in SAF-A depleted cells (24 hours) using rMATS. Density plot showing changes in exon inclusion. B. CDF plot illustrating the magnitude of changes in exon inclusion (of all exons significantly changed following SAF-A depletion) in all domain mutants. C. MISO plot showing an example altered exon. D. GO analysis of genes with altered splicing. E. CDF plot showing enrichment of all mRNAs, mRNAs with increased exon inclusion, and mRNAs with decreased exon inclusion in SAF-A RIP-seq libraries from interphase cells.

References

    1. Skalska L., et al. , Nascent RNA antagonizes the interac1on of a set of regulatory proteins with chroma1n. Mol Cell, 2021. 81(14): p. 2944–2959 e10. - PubMed
    1. Fackelmayer F.O. and Richter A., Purifica1on of two isoforms of hnRNP-U and characteriza1on of their nucleic acid binding ac1vity. Biochemistry, 1994. 33(34): p. 10416–22. - PubMed
    1. Romig H., et al. , Characteriza1on of SAF-A, a novel nuclear DNA binding protein from HeLa cells with high affinity for nuclear matrix/scaffold aLachment DNA elements. EMBO J, 1992. 11(9): p. 3431–40. - PMC - PubMed
    1. Kiledjian M. and Dreyfuss G., Primary structure and binding ac1vity of the hnRNP U protein: binding RNA through RGG box. EMBO J, 1992. 11(7): p. 2655–64. - PMC - PubMed
    1. Renz A. and Fackelmayer F.O., Purifica1on and molecular cloning of the scaffold aLachment factor B (SAF-B), a novel human nuclear protein that specifically binds to S/MAR-DNA. Nucleic Acids Res, 1996. 24(5): p. 843–9. - PMC - PubMed

Publication types

LinkOut - more resources