[Preprint]. 2024 Sep 10:2024.09.10.611504.
doi: 10.1101/2024.09.10.611504.

ATP-dependent remodeling of chromatin condensates uncovers distinct mesoscale effects of two remodelers

Affiliations

ATP-dependent remodeling of chromatin condensates uncovers distinct mesoscale effects of two remodelers

Camille Moore et al. bioRxiv. .

Update in

Abstract

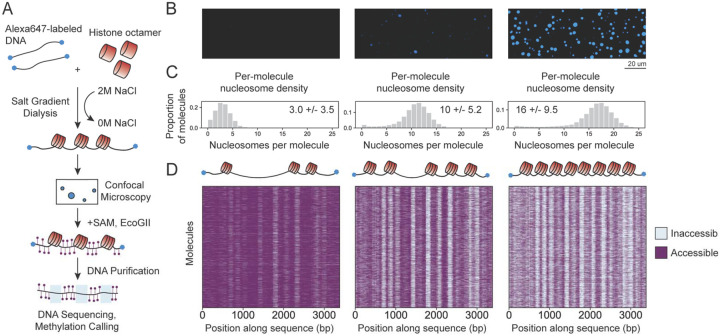
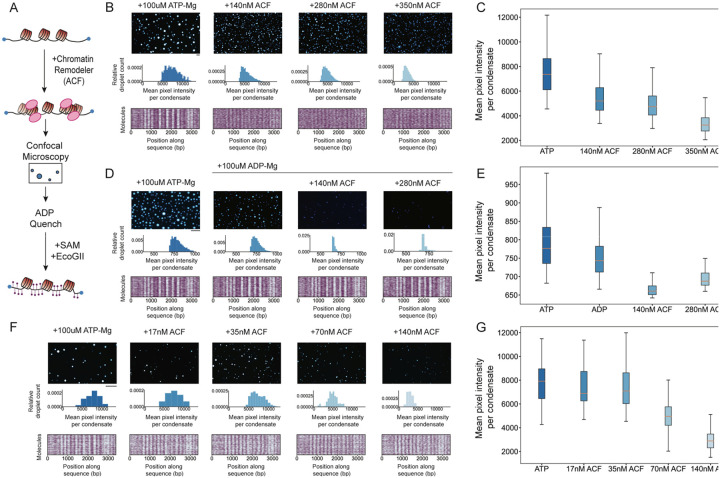
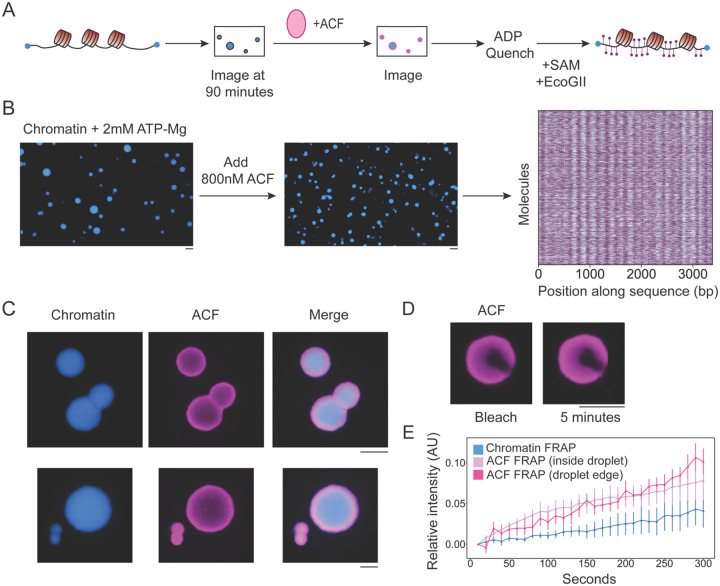
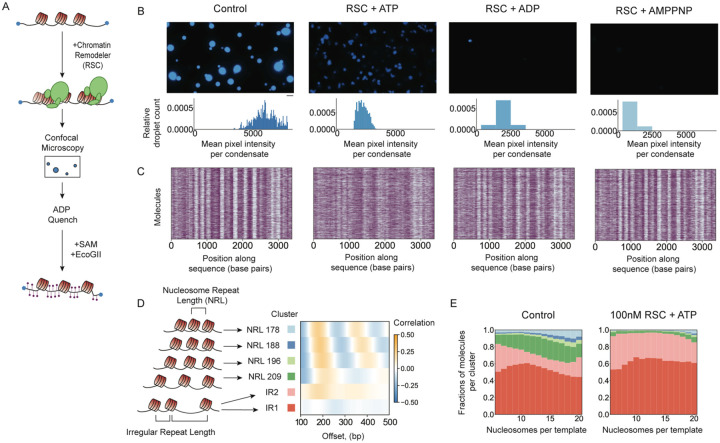
ATP-dependent chromatin remodeling enzymes mobilize nucleosomes, but how such mobilization affects chromatin condensation is unclear. Here, we investigate effects of two major remodelers, ACF and RSC using chromatin condensates and single-molecule footprinting. We find that both remodelers inhibit the formation of condensed chromatin. However, the remodelers have distinct effects on pre-formed chromatin condensates. ACF spaces nucleosomes without de-condensing the chromatin, explaining how ACF maintains nucleosome organization in transcriptionally repressed genomic regions. In contrast, RSC catalyzes ATP-dependent de-condensation of chromatin. Surprisingly, RSC also drives micron-scale movements of entire condensates. These newly uncovered activities of RSC explain its central role in transcriptional activation. The biological importance of remodelers may thus reflect both their effects on nucleosome mobilization and the corresponding consequences on chromatin dynamics at the mesoscale.


Conflict of interest statement

Competing interests: G.J.N is a co-founder of TippingPoint Biosciences.

Figures

Figure 1.
Figure 1.. Nucleosome density drives chromatin condensate formation.
(A) Scheme of experimental workflow. (B) Confocal images of chromatin reactions with varying histone octamer concentration showing Alexa647 fluorescence. (C) Per-molecule nucleosome density for each chromatin assembly shown in B. Inset is median nucleosomes per molecule and variance. (D) Heatmaps of accessible and inaccessible bases for 3000 molecules per condition. Cartoon chromatin molecules illustrate that each row in the heatmap represents a chromatin molecule and the number of nucleosomes per molecule increases according to octamer concentration.
Figure 2.
Figure 2.. ACF prevents chromatin condensate formation in an ATP-independent manner.
(A) Scheme of premix experimental workflow. (B) Titration of ACF in the presence of ATP-Mg. Confocal images showing Alexa647 fluorescence. Histograms of mean pixel intensity per condensate with histogram bin number equal to 0.1*number of condensates per condition. Heatmaps of accessible and inaccessible bases for 1000 molecules per condition. (C) Boxplot of mean pixel per droplet intensities from B. (D) Titration of ACF in the presence of ADP. Widefield images showing Alexa647 fluorescence, histograms and heatmaps as in B. Lower intensity threshold was increased for 140 and 280 nM samples for better visualization of condensates against background. (E) Boxplot of mean pixel intensities per condensate from D. (F) Titration of lower concentrations of ACF in the presence of ATP-Mg. Confocal images, histograms, and heatmaps as in B. (G) Boxplot of mean pixel intensities per condensate from F. All scale bars are 20 um.
Figure 3.
Figure 3.. ACF remodels chromatin inside of condensates and is concentrated in condensates.
(A) Scheme of ACF add-in experimental workflow. (B) Alexa647 fluorescence before and after adding in ACF, along with heatmap of accessible and inaccessible bases for 3000 molecules from the add-in reaction. (C) Example condensates after adding ACF using AF488-labeled ACF. Chromatin is labeled with AF647. (D) Example droplet before and after photobleaching, AF488 channel. (E) Quantification of recovery after photobleaching for chromatin (AF647) and ACF (AF488). Recovery is normalized to pre-bleach droplet intensity. All scale bars are 5 um.
Figure 4.
Figure 4.. RSC inhibits chromatin condensation and generates diverse nucleosome products that are not evenly spaced.
(A) Scheme of premix experimental workflow. (B) RSC reactions have 100nM RSC, 100uM nucleotide-Mg2+, and 150nM nucleosome, with median 15 nucleosomes per molecule. Confocal images show Alexa647 fluorescence and histograms of mean pixel intensity per condensate, with bin size equal to 0.1*number of condensates per condition. Scale bars are 5 um. (C) Heatmaps of accessible and inaccessible bases for 2000 molecules per condition. (D) Average single-molecule autocorrelograms resulting from Leiden clustering of individual molecules. We observe six different array types, four with regular spacing (NRL) and two with irregular spacing (IR). (E) Stacked bar chart representation of cluster representation for molecules from two different conditions, plotted as a function of nucleosome density. In the presence of RSC and ATP, the proportion of IR fibers (red and pink colors) increases.
Figure 5.
Figure 5.. RSC decondenses chromatin condensates and increases condensate motion in an ATP-dependent manner.
(A) Scheme of RSC add-in experimental workflow. (B) Confocal images of chromatin condensates for the RSC premix experiment (scheme shown in Fig 4A) in conditions with 150nM nucleosome, 100uM ATP-Mg. Estimated mean nucleosome concentration inside condensates is 38uM (control reaction) and 9uM (+100nM RSC reaction). (C) RSC add-in experiment as shown in A, done in conditions with either 100uM ATP-Mg or 2mM ATP-Mg and 150nM nucleosome. Estimated mean nucleosome concentration inside condensates is 43uM (before RSC, 100uM ATP-mg), 21uM (after RSC, 100uM ATP-mg), 21uM (before RSC, 2mM ATP-mg), 7uM (after RSC, 2mM ATP-mg). (D) Boxplots of mean condensate intensity for premix (left) and add in experiments in A and B (right). (E) Example traces of condensate displacement over 20 seconds. Displacement analysis was limited to condensates with diameter of approximately 5 um and the number of 5 um diameter condensates tracked in each condition is listed above the example droplets. (E) Boxplot of size-matched condensate displacement before and after RSC add-in. (F) On left, confocal images of RSC add-in using AF488 labeled RSC, 488 channel. Top row images are from 7nM AF488-RSC add-in, bottom row images from 350nM AF488-RSC add-in. Both were done in conditions with 100uM ATP-Mg. The molar ratio of nucleosome to RSC inside condensates is shown. (G) AF488 fluorescence recovery after photobleaching for 7nM and 350nM RSC. Recovery is normalized to pre-bleach droplet intensity and plotted an average of 6 droplets for 350nM RSC and 3 droplets for 7nM RSC. (H) Model for chromatin condensation and remodeling within the condensate by ACF or RSC. All scale bars are 5 um.

References

    1. Lieberman-Aiden E. et al. , Comprehensive Mapping of Long-Range Interactions Reveals Folding Principles of the Human Genome. Science 326, 289–293 (2009). - PMC - PubMed
    1. Dekker J., Mapping in vivo chromatin interactions in yeast suggests an extended chromatin fiber with regional variation in compaction. J Biol Chem 283, 34532–34540 (2008). - PMC - PubMed
    1. Clapier C. R., Iwasa J., Cairns B. R., Peterson C. L., Mechanisms of action and regulation of ATP-dependent chromatin-remodelling complexes. Nature Reviews Molecular Cell Biology 18, 407–422 (2017). - PMC - PubMed
    1. Zhou C. Y., Johnson S. L., Gamarra N. I., Narlikar G. J., Mechanisms of ATP-Dependent Chromatin Remodeling Motors. Annu Rev Biophys 45, 153–181 (2016). - PMC - PubMed
    1. Krietenstein N. et al. , Genomic Nucleosome Organization Reconstituted with Pure Proteins. Cell 167, 709–721.e712 (2016). - PMC - PubMed

Publication types

LinkOut - more resources