[Preprint]. 2024 Sep 10:2024.09.10.612348.
doi: 10.1101/2024.09.10.612348.

Efficient genome replication in influenza A virus requires NS2 and sequence beyond the canonical promoter

Affiliations

Efficient genome replication in influenza A virus requires NS2 and sequence beyond the canonical promoter

Sharmada Swaminath et al. bioRxiv. .

Update in

Abstract

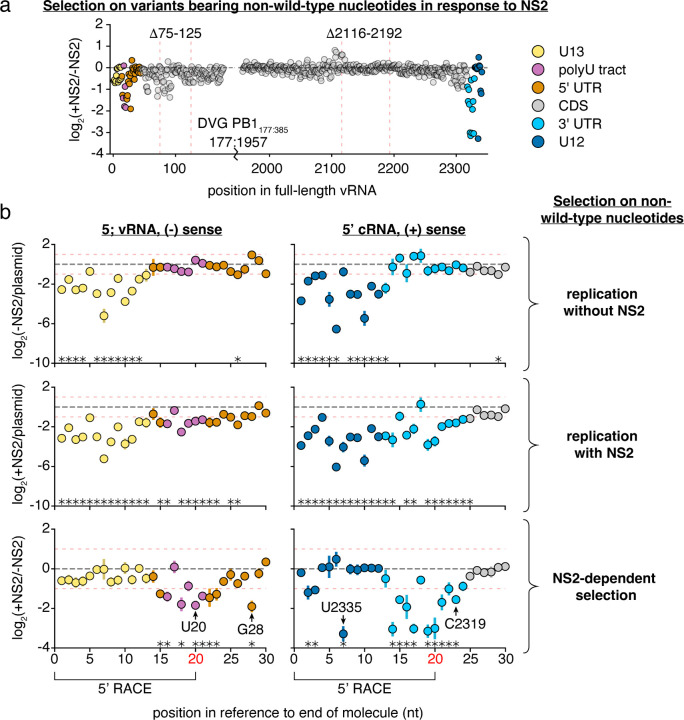
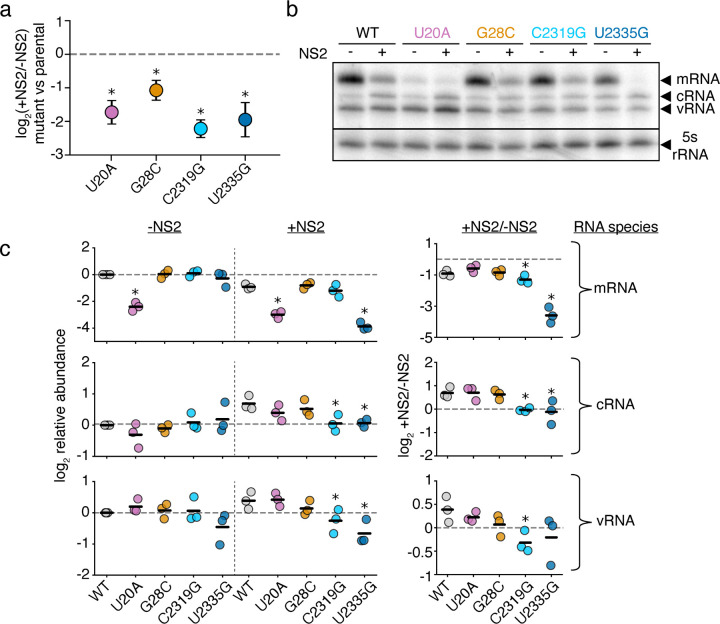
Influenza A virus encodes promoters in both the sense and antisense orientations. These support the generation of new genomes, antigenomes, and mRNA transcripts. Using minimal replication assays-transfections with viral polymerase, nucleoprotein, and a genomic template-the influenza promoter sequences were identified as 13nt at the 5' end of the viral genomic RNA (U13) and 12nt at the 3' end (U12). Other than the fourth 3' nucleotide, the U12 and U13 sequences are identical between all eight RNA molecules that comprise the segmented influenza genome. Despite possessing identical promoters, individual segments can exhibit different transcriptional dynamics during infection. However flu promoter sequences were defined in experiments without influenza NS2, a protein which modulates transcription and replication differentially between genomic segments. This suggests that the identity of the "complete" promoter may depend on NS2. Here we assess how internal sequences of two genomic segments, HA and PB1, may contribute to NS2-dependent replication as well as map such interactions down to individual nucleotides in PB1. We find that the expression of NS2 significantly alters sequence requirements for efficient replication beyond the identical U12 and U13 sequence, providing a mechanism for the divergent replication and transcription dynamics across the influenza A virus genome.


Figures

Figure 1.
Figure 1.. Prior models incompletely describe genome replication during viral infection.
(a) (top)Our previous work found that a 400nt variants of the PB1 and HA segments outcompete their full-length counterparts during genome replication, but during packaging, full-length variants have an advantage. More comprehensive library-based analyses of genomic length showed that a smaller sizes correlate with better replication efficiency and longer sizes better packaging efficiency. Inconsistent with this model, Alnaji et al. described a phenomenon where a short variant of the PB2 segment was outcompeted during genome replication. (bottom) Schematic of our model derived from measuring thousands of length-variants in Mendes and Russell (2021). (b) Barcoded 200, 400, 800, and 1600nt variants of A/WSN/1933 PB1 and HA bearing equal sequence length from 5’ and 3’ ends were generated and rescued by coinfection with wild-type virus. Viral supernatant was used to infect A549 cells at an MOI of 25, and qPCR was used to analyze the proportion of each variant before infection and within infected cells at 8h post-infection. 200, 400, and 800nt variants are assessed by their frequency relative to the 1600nt species. Asterisks indicate significantly different values, ANOVA p<0.05 with post-hoc Tukey test, q<0.05. n=3, individual replicates and mean shown.
Figure 2.
Figure 2.. Expression of NS2 complicates simple length-dependent replication kinetics.
a,b Barcoded 200, 400, 800, and 1600nt variants of each individual segment bearing equal sequence length derived from 5’ and 3’ ends and lacking canonical start codons were generated and co-transfected into HEK293T cells along with the minimal replication machinery with, or without, NS2. The relative frequency of each variant was measured by qPCR at 24h post-transfection, with 1600nt variants serving as a comparison. Asterisks indicate conditions significantly impacted by the expression of NS2, two-sample two-tailed t-test with a within-panel Benjamini-Hochberg corrected FDR<0.05. n=3 for (a), n=4 for (b), individual replicates and mean displayed.
Figure 3.
Figure 3.. Analysis of length variant libraries confirms NS2-dependent replication effects.
Size distributions of libraries in transfections with minimal replication machinery only (-NS2) and with the addition of NS2 (+NS2) 24 hours post-transfection in HEK293T cells as compared to the original plasmid library or one-another. The fraction of variants falling within each 100nt bin was compared. Points above the dotted line represent sizes in each individual library which were enriched, below, depleted. Points were only shown if represented in all three libraries under both conditions. R is the Spearman correlation coefficient. n = 3, all replicates shown. Inter-replicate correlation plots presented in Supplementary Fig. 2.
Figure 4.
Figure 4.. Specific regions in PB1 influence replication in the presence of NS2.
a Reanalysis of data from Fig. 3. The abundance of each variant that does, or does not, encode the indicated region was measured. Then, comparing only variants of identical length, the frequency at which a region is, or is not, observed under each condition was determined. Again, within only variants of identical size, changes in this frequency were measured, and the final value, presented in this graph, represents the median measurement across all lengths within a given replicate. Points above the dotted line indicate individual regions whose absence enhances replication under each indicated comparison, while points below indicate regions whose absence is associated with decreased replication. Asterisks indicate regions with a greater-than 2-fold effect size that differ significantly from no effect, one-sample two-tailed t-test, Benjamini-Hochberg corrected FDR<0.1. b The ratio of replication of sequences containing or not containing a region centering at the 100nt position, with, and without NS2 expression, across a range of lengths. Points are only shown if there were at least 100 measurements across all conditions. Statistics performed as in (a), with a stricter FDR cutoff of 0.05. c Each indicated deletion was generated in a PB1177:385 background, co-transfected with a barcoded PB1 400nt internal control with, or without, NS2, and its replication was compared against the parental background at 24h post-transfection by qPCR. Asterisks indicate a ratio significantly less than 1, one-tailed one-sample t-test, p<0.05, indicating that the a given deletion reduces replication efficiency when NS2 is expressed. Points represent mean and standard deviation, n=3. d Library data analyzed as in Fig 3, bottom, excluding deletions that remove the indicated regions (first 400nt and last 175nt) in PB1 or HA.
Figure 5.
Figure 5.. Positions within and beyond the canonical promoter are required for efficient replication in the presence of NS2.
The frequency of total non-wild-type nucleotides at each position during minimal replication assays was measured under each condition, and its enrichment, or depletion shown. Similar data were procured for total information content, which considers selection at each individual nucleotide at each individual position (Supplementary Fig. 5) a NS2-dependent selection measured across all of PB1177:385 against non-wild-type nucleotides, average value across all three replicates provided. Coordinates of deletions from Fig. 4 noted. Coordinates given as the full-length vRNA, regions of functional interest annotated. Data from replication without NS2, and replication with NS2, provided in Supplementary Fig. 7. b Selection on non-wild-type nucleotides in the first 30nt in the vRNA (left) and cRNA (right). Mean and standard deviation graphed. Asterisks indicate regions with a greater-than 2-fold effect size (denoted by red dotted lines) that differ significantly from no effect, one-sample t-test, Benjamini-Hochberg corrected FDR <0.1. The first 20nt of vRNA and cRNA were inferred from 5’ RACE rather than simple amplicon sequencing (Supplementary Fig. 8). Positions further explored in Fig. 6 noted. Inter-replicate correlation plots presented in Supplementary Fig. 9.
Figure 6.
Figure 6.. Mutations to NS2-dependent sites can influence mRNA/cRNA/vRNA ratios.
a Each individual mutant in PB1177:385 was transfected alongside a 400nt internal control and minimal replication machinery with, and without, NS2. The relative frequency of each variant relative to the 400nt control was compared against wild-type under each condition. Asterisks indicate a ratio significantly less than 1, one-tailed one-sample t-test, Benjamini-Hochberg corrected FDR<0.05, indicating that the parental exhibits an NS2-dependent advantage over the variant. Points represent mean and standard deviation, n=3. b Representative primer-extension analysis of minimal replication assays with the indicated variants in PB1177:385 with (+) and without (−) the additional expression of NS2. Each molecular species indicated. c Quantitative analysis of primer extension as presented in (b). All values in left two columns corrected against a parental template in the absence of NS2. Dotted line represents that value, points above indicate an increase in that molecular species, below, decrease. Values in the right column represent the ratio of points between the left two columns. Asterisks indicate values that are significantly decreased relative to the parental template, one-tailed t-test with Benjamini-Hochberg corrected FDR <0.1. Full gels presented in Supplementary Fig. 12. Individual replicates and mean presented, n=3. Similar analyses for full-length PB1 template for cRNA presented in Supplementary Fig.13.

References

    1. Holmes E. C. Error thresholds and the constraints to RNA virus evolution. Trends in Microbiology 11, 543–546. doi: 10.1016/j.tim.2003.10.006 (2003). - DOI - PMC - PubMed
    1. O’Neill R. E., Talon J. & Palese P. The influenza virus NEP (NS2 protein) mediates the nuclear export of viral ribonucleoproteins. The EMBO Journal 17, 288–296. doi: 10.1093/emboj/17.1.288 (1998). - DOI - PMC - PubMed
    1. Neumann G., Hughes M. T. & Kawaoka Y. Influenza A virus NS2 protein mediates vRNP nuclear export through NES-independent interaction with hCRM1. The EMBO Journal 19, 6751–6758. doi: 10.1093/emboj/19.24.6751 (2000). - DOI - PMC - PubMed
    1. Robb N. C., Smith M., Vreede F. T. & Fodor E. NS2/NEP protein regulates transcription and replication of the influenza virus RNA genome. Journal of General Virology 90, 1398–1407. doi: 10.1099/vir.0.009639-0 (2009). - DOI - PubMed
    1. Zhang L. et al. Fine Regulation of Influenza Virus RNA Transcription and Replication by Stoichiometric Changes in Viral NS1 and NS2 Proteins. J Virol 97. Zhang, Lei Wang, Yingying Shao, Yuekun Guo, Jiamei Gao, George F Deng, Tao 2023/5/11, e0033723. doi: 10.1128/jvi.00337-23 (2023). - DOI - PMC - PubMed

Publication types