[Preprint]. 2024 Sep 14:2024.09.11.611693.
doi: 10.1101/2024.09.11.611693.

The myokine FGF21 associates with enhanced survival in ALS and mitigates stress-induced cytotoxicity

Affiliations

The myokine FGF21 associates with enhanced survival in ALS and mitigates stress-induced cytotoxicity

Abhishek Guha et al. bioRxiv. .

Update in

Abstract

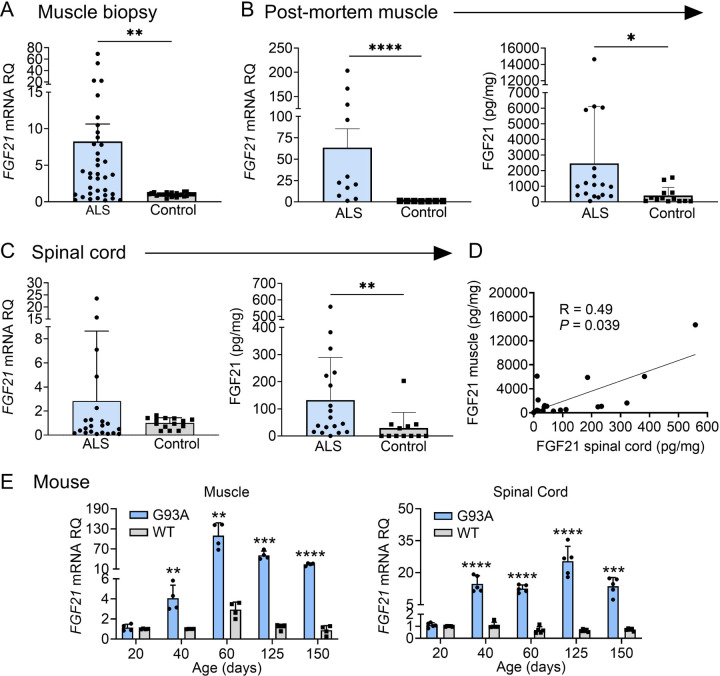
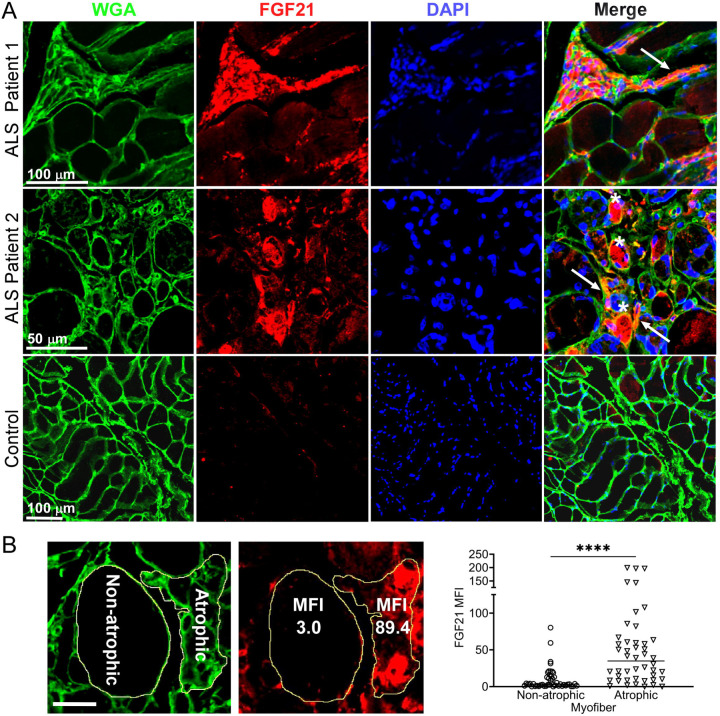
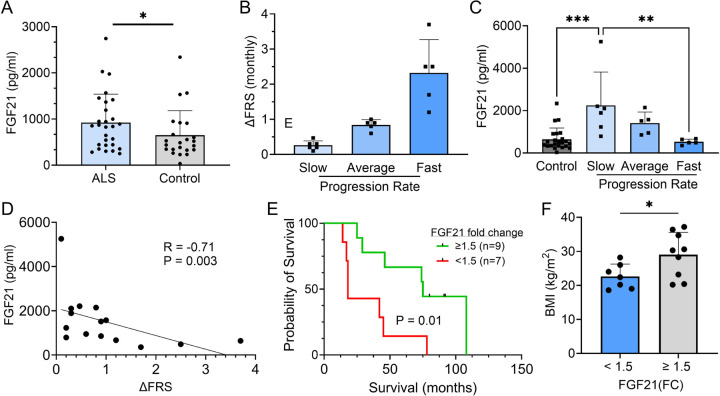
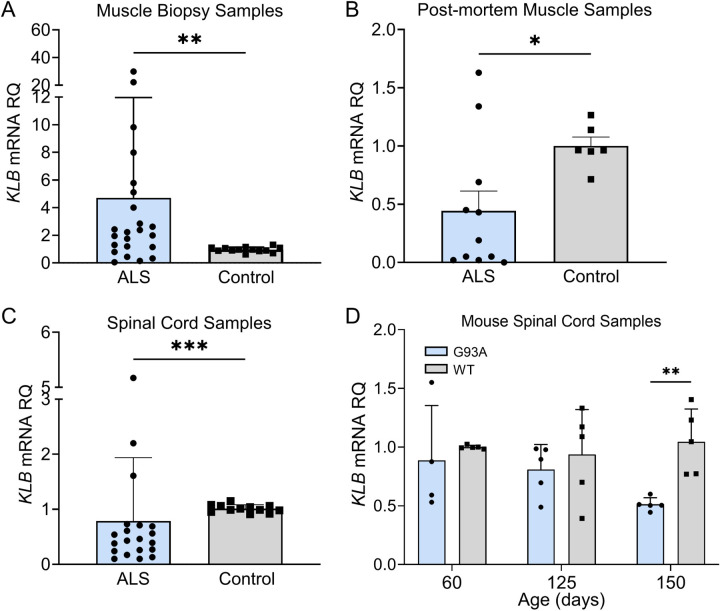
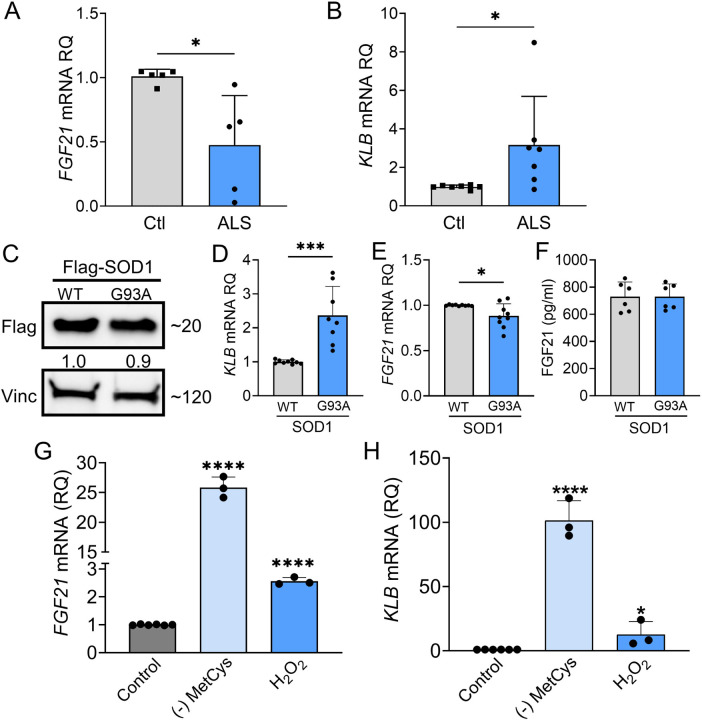
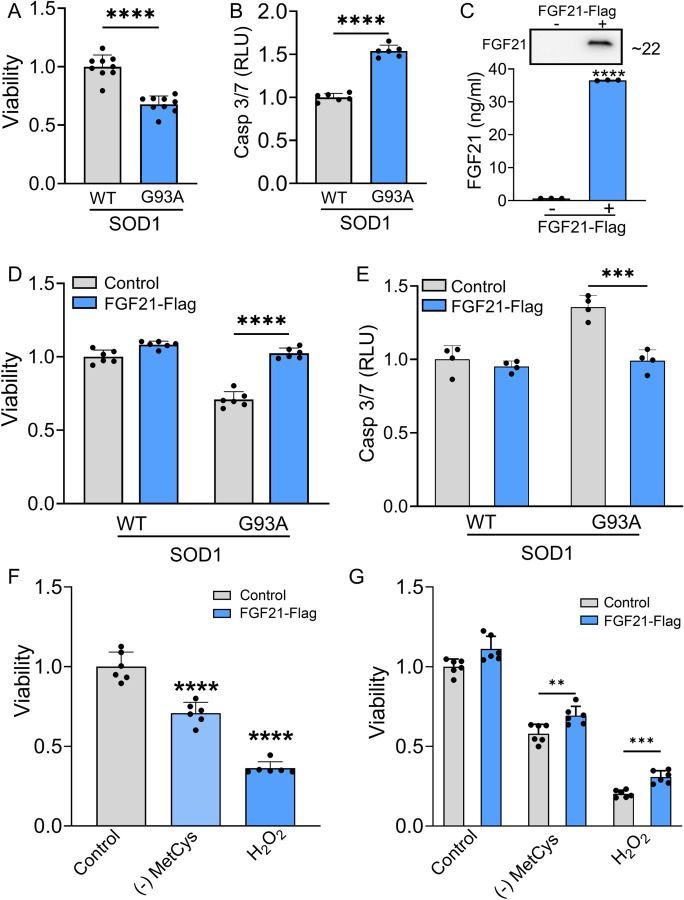
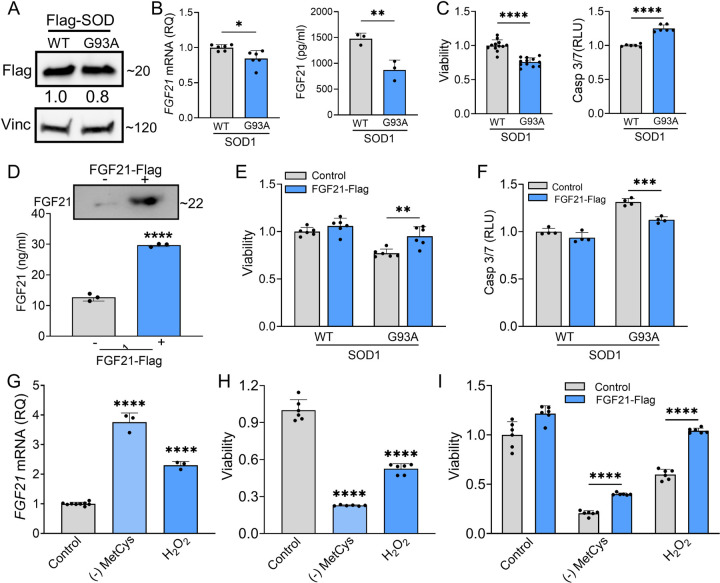
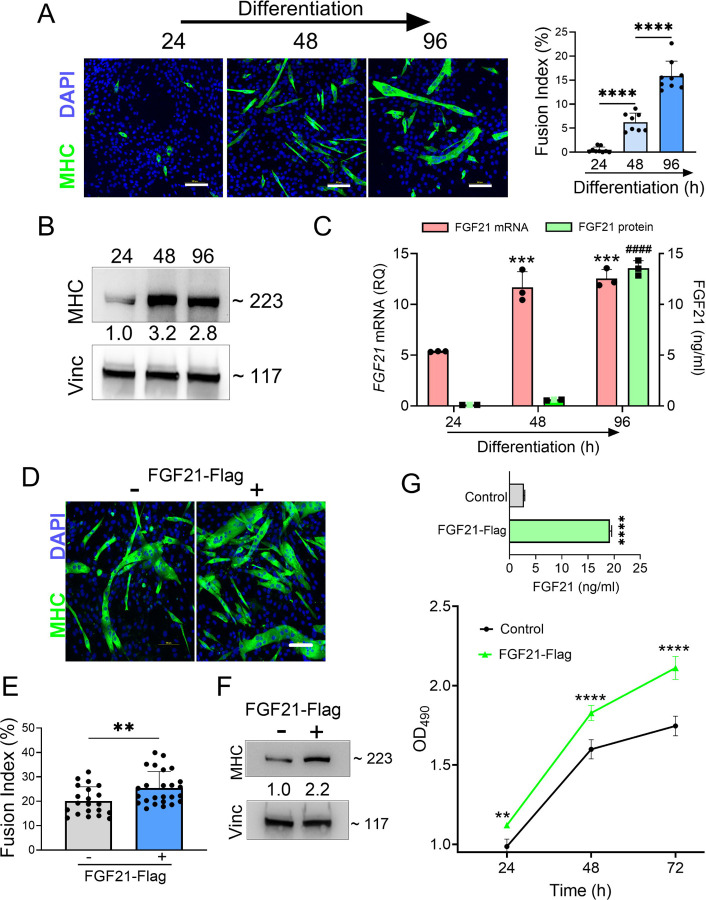
Amyotrophic lateral sclerosis (ALS) is an age-related and fatal neurodegenerative disease characterized by progressive muscle weakness. There is marked heterogeneity in clinical presentation, progression, and pathophysiology with only modest treatments to slow disease progression. Molecular markers that provide insight into this heterogeneity are crucial for clinical management and identification of new therapeutic targets. In a prior muscle miRNA sequencing investigation, we identified altered FGF pathways in ALS muscle, leading us to investigate FGF21. We analyzed human ALS muscle biopsy samples and found a large increase in FGF21 expression with localization to atrophic myofibers and surrounding endomysium. A concomitant increase in FGF21 was detected in ALS spinal cords which correlated with muscle levels. FGF21 was increased in the SOD1G93A mouse beginning in presymptomatic stages. In parallel, there was dysregulation of the co-receptor, β-Klotho. Plasma FGF21 levels were increased and high levels correlated with slower disease progression, prolonged survival, and increased body mass index. In NSC-34 motor neurons and C2C12 muscle cells expressing SOD1G93A or exposed to oxidative stress, ectopic FGF21 mitigated loss of cell viability. In summary, FGF21 is a novel biomarker in ALS that correlates with slower disease progression and exerts trophic effects under conditions of cellular stress.

Keywords: ALS biomarker; Fibroblast growth factor 21; human skeletal muscle; motor neurons; oxidative stress response; β-Klotho.


Conflict of interest statement

Conflicts of Interest The authors report no competing interests.

Figures

Figure 1
Figure 1. FGF21 levels are elevated in the muscle and spinal cord tissues of ALS patients and the SOD1G93A mouse.
(A) FGF21 mRNA expression was analysed in normal (n = 24) and ALS (n = 36) muscle biopsy samples via RT-qPCR. **P = 0.004, unpaired two-tailed t-test with Welch’s correction. (B) FGF21 mRNA levels were quantified in normal (n = 7) and ALS (n = 11) post-mortem muscle samples (left panel) and FGF21 protein levels (n = 13 for normal samples; n = 18 for ALS samples; right panel). **P = 0.003, ****P < 0.0001, two-tailed Mann Whitney test. (C) FGF21 mRNA levels were quantified in normal (n = 14) and ALS (n = 22) post-mortem spinal cord samples (left panel) and FGF21 protein levels (n = 12 for normal samples; n = 18 for ALS samples; right panel). **P = 0.00, two-tailed Mann Whitney test. (D) Comparison of spinal cord and muscle FGF21 protein levels for 18 ALS patients. A spearman correlation test was used for analysis. (E) FGF21 mRNA levels in the gastrocnemius muscle (left panel) and spinal cord (right panel) were quantified across different age groups (20 – 150 days; n = 4–5 per group) from SOD1G93A mice and littermate controls. **P < 0.01, ***P < 0.001, ****P < 0.0001, unpaired two-tailed t-test comparing WT to SOD1G93A. For all graphs, error bars represent SD.
Figure 2
Figure 2. FGF21 localizes to atrophic myofibers in ALS muscle.
(A) Tissue sections from two ALS patients and one normal control were immunostained with an anti-FGF21 antibody and counterstained with Hoechst and wheat germ agglutin (WGA). Intense immunoreactivity is observed in atrophic myofibers (asterisks) and in the endomysial space (arrows) in the ALS muscle sections. Scale bars, 100 µM in low power views and 50 µM in the enlarged views. (B) Mean fluorescence Intensity (MFI) analysis of FGF21 immunoreactivity was performed in 5 ALS patient biopsy samples and 5 normal controls. Atrophic (< 25 μM minimal Feret’s diameter) and non-atrophic myofibers were selected in the same section as shown in the micrograph (yellow outline). FGF21 MFI (per μM2) was quantitated for 46 atrophic and non-atrophic myofibers and summarized in the graph (horizontal line represents the mean). ****P < 0.0001; two-tailed Mann Whitney test. Scale bar: 50 µM.
Figure 3
Figure 3. Plasma FGF21 is increased in ALS patients and high levels associate with slower disease progression and prolonged survival.
(A) Plasma samples from age-matched normal controls (n = 23) and ALS patients (n = 28) and assayed by ELISA for FGF21. *P = 0.043, unpaired two-tailed t-test. (B) 16 ALS patients from a prior biomarker study were divided into slow (n = 6), average (n = 5), and fast (n = 5) progressing groups based on the average in the study monthly decline in ALSFRS-R scores. (C) Plasma FGF21 levels were measured at baseline and 3 months and averaged. The normal control values were added for comparison. **P = 0.003, ***P = 0.0003; one-way ANOVA followed by Tukey post hoc test. (D) Correlation between plasma FGF21 levels with monthly change in the ALSFRS-R scores (∆FRS) for each subject. Spearman correlation test. (E) Kaplan–Meier survival curves for study patients whose FGF21 plasma levels were < 1.5-fold-change (FC) over the normal control group versus study patients with ≥ 1.5-FC in FGF21 levels. *P = 0.015; Log-rank (Mantel-Cox) test. (F) Comparison of body mass index (BMI) between the < 1.5 FC and ≥ 1.5-FC groups. *P = 0.037; unpaired two-tailed t-test. For all graphs, error bars represent SD.
Figure 4
Figure 4. FGF21 coreceptor, β-Klotho (KLB), is dysregulated in ALS muscle and spinal cord.
(A) KLB mRNA levels were measured in muscle biopsy samples from normal (n = 13) and ALS patients (n = 23). **P = 0.005, two-tailed Mann Whitney test. (B) KLB mRNA levels were measured in post-mortem muscle samples from normal controls (n = 6) and ALS (n = 11) patients. *P = 0.034, two-tailed Mann Whitney test. (C) KLB mRNA levels were measured in spinal cord samples from normal controls (n = 12) and ALS patients (n = 20). ***P = 0.0006, two-tailed Mann Whitney test. (D) KLB mRNA levels were measured in spinal cord samples from SOD1G93A mice (n = 5) and WT controls (n = 5) at different ages. **P = 0.003; unpaired two-tailed t-test comparing WT to SOD1G93A.
Figure 5
Figure 5. FGF21-KLB signaling is dysregulated in ALS motor neurons.
(A) FGF21 were measured in iPSC-derived motor neurons obtained from healthy controls and ALS patients carrying either C9orf72 or SOD1 mutations (Supplementary Table 1). *P = 0.012; two-tailed Mann Whitney test. (B) KLB mRNA levels were similarly measured in iPSC motor neurons. *P = 0.018; two-tailed Mann Whitney test. (C) NSC-34 motor neuron-like cells were transfected with FLAG-tagged WT and SOD1G93A expression plasmids and lysates were assessed by western blot using the antibodies indicated. Bands were quantitated by densitometry and a ratio to the loading control, vinculin, was calculated (shown between the two blots). (D) KLB and (E) FGF21 mRNA levels were measured in the same lysates. *P = 0.018, ***P = 0.0002, unpaired two-tailed t-test. (F) FGF21 protein was measured in the CM of transfected NSC-34 cells. (G) FGF21 or (H) KLB mRNA levels were quantified from NSC-34 cells exposed to methionine-cystine (MetCys)-deprived media or treated with 100μM H2O2 for 24 h. *P = 0.048, ****P < 0.0001; one-way ANOVA followed by Tukey’s multiple comparisons test. Data points represent biological replicates and bars are the mean ± SD.
Figure 6
Figure 6. FGF21 mitigates cytotoxicity in NSC-34 motor neuron-like cells induced by SOD1G93A or oxidative stress.
(A) The viability of NSC-34 cells expressing FLAG-tagged WT-SOD1 or SOD1G93A was determined using the Vialight assay. Viability for WT SOD1-transfected cells was set at 1. ****P < 0.0001, unpaired two-tailed t-test. (B) Caspase activation was measured in the same cells and values were normalized to activity in WT SOD1-transfected cells which was set at 1. ****P < 0.0001, unpaired two-tailed t-test. (C) FGF21 protein in the conditioned media of NSC-34 cells transfected with a FLAG-tagged FGF21 plasmid was detected by western blot (upper panel) and by ELISA (graph). ****P < 0.0001; unpaired two-tailed t-test. (D) and (E) NSC-34 cells expressing either WT-SOD1 or SOD1G93A were transfected with FLAG-FGF21 and assessed for viability as in (A) and Caspase-3/7 as in (B). ****P < 0.0001, unpaired two-tailed t-test. (F) Cell viability was assessed in NSC-34 cells exposed to methionine-cystine (MetCys)-deprived media or treated with 100μM H2O2. ****P < 0.0001; one-way ANOVA followed by Tukey’s multiple comparisons test. (G) NSC-34 cells transfected with FLAG-FGF21 (or empty vector) were subjected to stressors as described in (F) for 24h and then assayed for viability. **P = 0.007, ***P = 0.0002; unpaired two-tailed t-test. Data points represent biological replicates and bars are the mean ± SD.
Figure 7
Figure 7. FGF21 mitigates cytotoxicity in C2C12 myoblasts induced by SOD1G93A or oxidative stress.
(A) C2C12 myoblasts were transfected with FLAG-tagged WT and SOD1G93A expression plasmids and lysates were assessed by western blot using the antibodies indicated. Bands were quantitated by densitometry and a ratio to the loading control, vinculin, was calculated (shown between the two blots). (B) FGF21 mRNA levels were measured in the same lysates (left panel) and FGF21 protein in the conditioned media was quantified by ELISA (right panel). *P = 0.011, **P = 0.008; unpaired two-tailed t-test. Secretory FGF21 from the conditioned media was quantified using ELISA (Right panel). (C) Viability of NSC-34 cells expressing FLAG-tagged WT-SOD1 or SOD1G93A was determined using the Vialight assay (Left panel). Caspase activation was measured in the same cells and values were normalized to activity in WT SOD1-transfected cells which was set at 1 (right panel). ****P < 0.0001, unpaired two-tailed t-test. (D) FGF21 protein in the conditioned media of C2C12 cells transfected with a FLAG-tagged FGF21 was detected by western blot (upper panel) and by ELISA (graph). Estimated size of the band (kDa) is shown to the right of the blot. ****P < 0.0001; unpaired two-tailed t-test. (E) and (F) C2C12 myoblasts cells expressing either WT-SOD1 or SOD1G93A were transfected with FGF21-FLAG and assessed for viability and Caspase-3/7 activity as in (C). **P = 0.003, ***P = 0.0003; unpaired two-tailed t-test. (G) FGF21 mRNA levels were quantified in C2C12 cells exposed to MetCys-deprived media or treated with 100μM H2O2 for 24 h. ****P < 0.0001; one-way ANOVA followed by Tukey’s multiple comparisons test. (H) Cell viability was assessed in C2C12 myoblasts exposed to stressors as described in (G). ****P < 0.0001; one-way ANOVA followed by Tukey’s multiple comparisons test. (I) C2C12 cells transfected with FGF21-FLAG (or empty vector) were subjected to stressors as described in (G) for 24h and then assayed for viability. ****P < 0.0001; unpaired two-tailed t-test. Data points represent biological replicates and bars are the mean ± SD.
Figure 8
Figure 8. FGF21 is upregulated during myogenesis and facilitates myogenic differentiation of C2C12 myoblasts.
(A) C2C12 myoblasts were treated with DM for various time intervals and immunostained with an anti-MHC antibody followed by DAPI counterstaining. Myotube formation was detected by MHC-positive staining. Scale bars, 100 µM. The fusion index (%) was quantified as described in the methods (right panel). (B) C2C12 myoblasts treated with DM were lysed at specific time intervals and immunoblotted with antibodies against MHC and vinculin. Densitometry values (24 h time interval was set at 1) are shown. (C) FGF21 mRNA levels were quantified from the lysates and FGF21 protein from conditioned media. ***P = 0.0005 comparing to the 24 h time interval, ####P < 0.0001 comparing to the 24 and 48 h time intervals; one-way ANOVA followed by Tukey’s multiple comparisons test. (D) C2C12 myoblasts were transfected with an FGF21-FLAG plasmid and cultured in DM for 96 h. Myotube formation was assessed by MHC-positive staining as in (A). Scale bar, 100 µM. (E) Fusion index for transfected C2C12 cells. **P = 0.008; unpaired two-tailed t-test. (F) Immunoblot analysis for MHC and vinculin was performed as described in (B). (G) FGF21 levels in the conditioned media from C2C12 myoblasts transfected with FGF21-FLAG or empty vector control were quantified by ELISA (upper graph). ****P < 0.0001; unpaired two-tailed t test. Cells were reseeded and cultured in growth medium (GM) for 72 h. Cell proliferation was assessed at indicated time intervals using MTS (lower graph). **P = 0.007, ****P < 0.0001; one-way ANOVA followed by Tukey’s multiple comparisons test. Data points represent biological replicates and bars are the mean ± SD.

References

    1. Kazamel M, Cutter G, Claussen G, et al. Epidemiological features of amyotrophic lateral sclerosis in a large clinic-based African American population. Amyotroph Lateral Scler Frontotemporal Degener. Sep 2013;14(5–6):334–7. doi: 10.3109/21678421.2013.770030 - DOI - PMC - PubMed
    1. Hardiman O, van den Berg LH, Kiernan MC. Clinical diagnosis and management of amyotrophic lateral sclerosis. 10.1038/nrneurol.2011.153. Nat Rev Neurol. Oct 11 2011;7(11):639–49. doi: 10.1038/nrneurol.2011.153 - DOI - PubMed
    1. Verma S, Khurana S, Vats A, et al. Neuromuscular Junction Dysfunction in Amyotrophic Lateral Sclerosis. Mol Neurobiol. Mar 2022;59(3):1502–1527. doi: 10.1007/s12035-021-02658-6 - DOI - PubMed
    1. King PH. Skeletal muscle as a molecular and cellular biomarker of disease progression in amyotrophic lateral sclerosis: a narrative review. Neural Regen Res. Apr 2024;19(4):747–753. doi: 10.4103/1673-5374.382226 - DOI - PMC - PubMed
    1. Moloney EB, de Winter F, Verhaagen J. ALS as a distal axonopathy: molecular mechanisms affecting neuromuscular junction stability in the presymptomatic stages of the disease. Front Neurosci. 2014;8:252. doi: 10.3389/fnins.2014.00252 - DOI - PMC - PubMed

Publication types

LinkOut - more resources