[Preprint]. 2024 Dec 2:2024.09.06.611711.
doi: 10.1101/2024.09.06.611711.

Death in the taste bud: engulfment of dying taste receptor cells by glial-like Type I cells

Affiliations

Death in the taste bud: engulfment of dying taste receptor cells by glial-like Type I cells

Courtney E Wilson et al. bioRxiv. .

Update in

Abstract

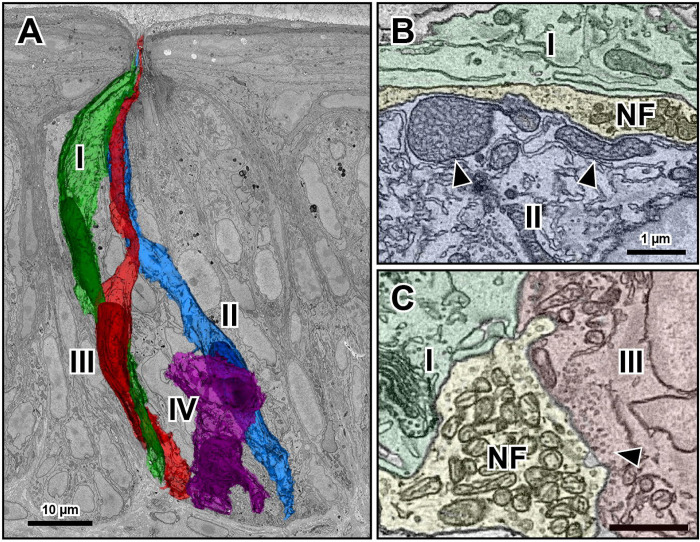
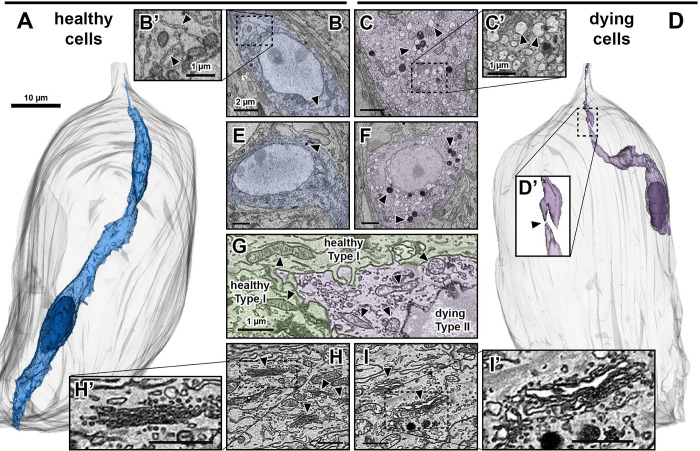
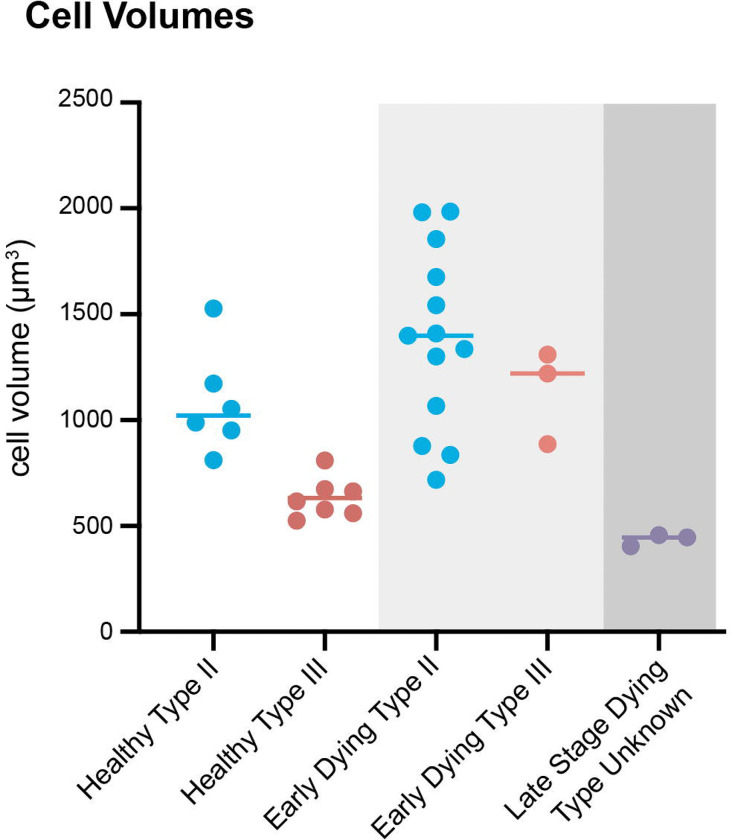
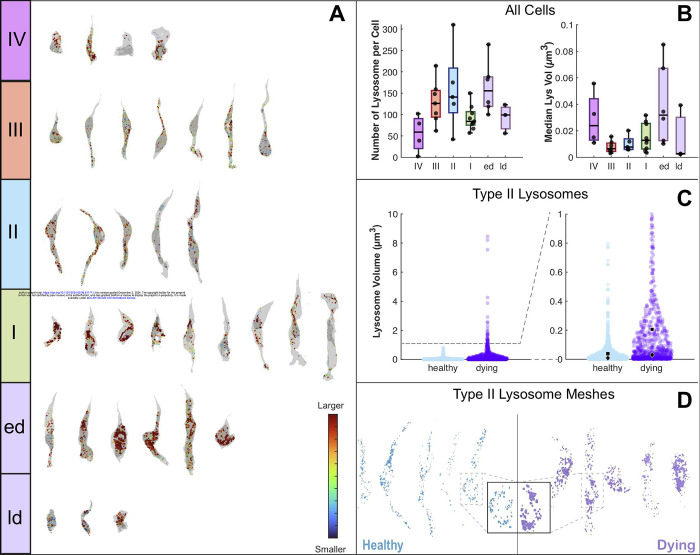
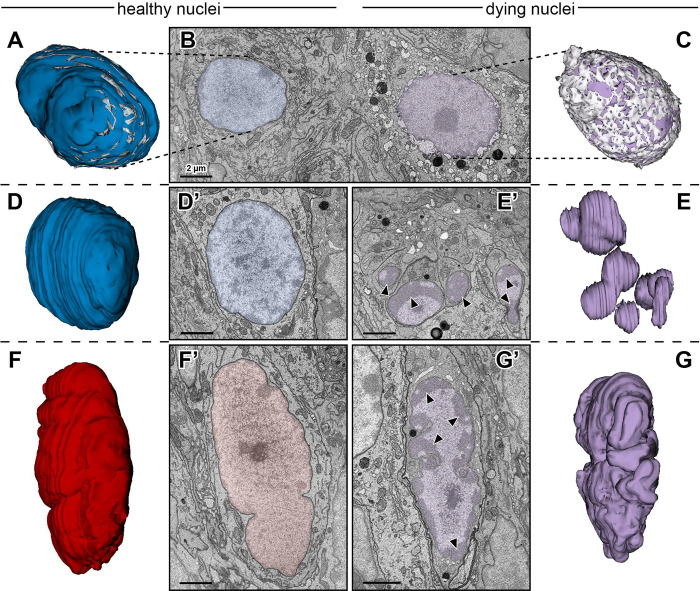
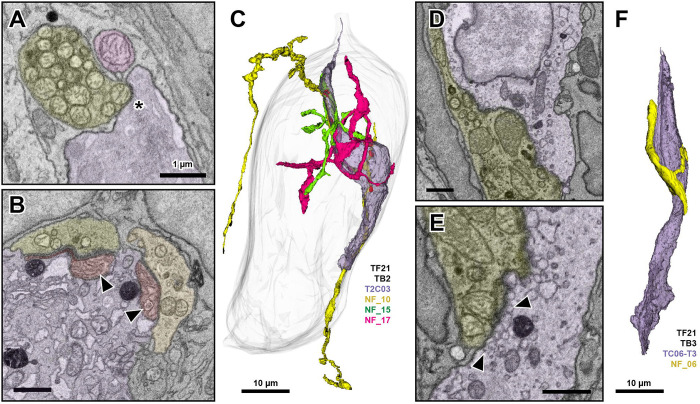
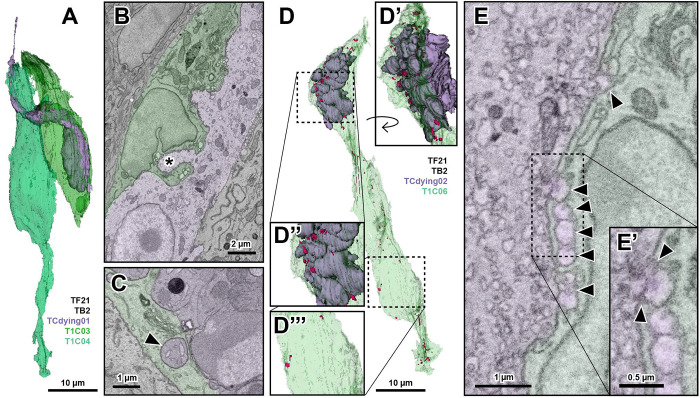
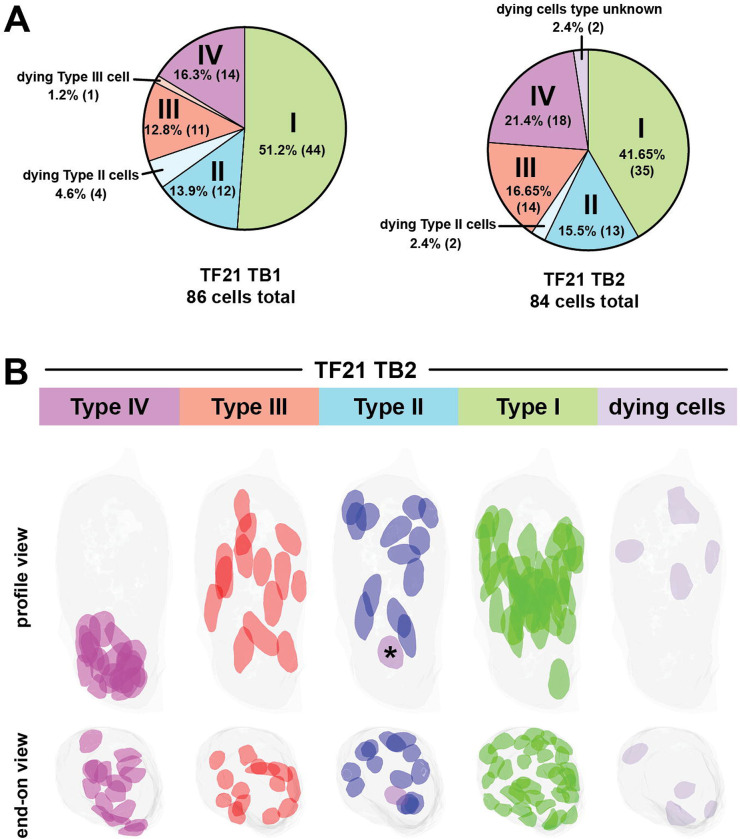
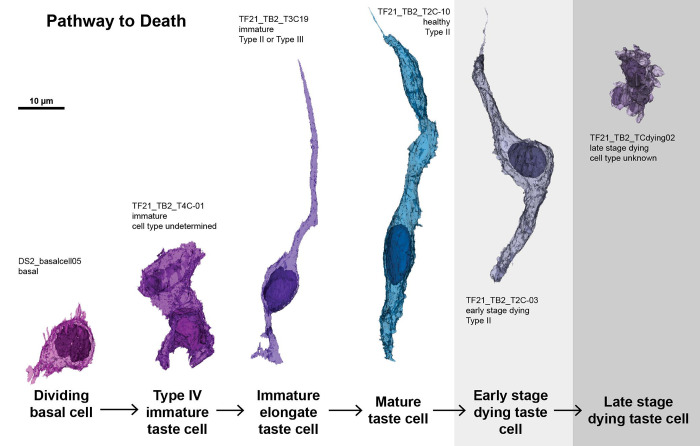
Taste buds comprise 50-100 epithelial derived cells, including glial-like cells (Type I) and two types of receptor cells (Types II and III). All of these taste cells are renewed throughout the life of an organism from a pool of uncommitted basal cells. Immature cells enter the bud at its base, maturing into one of the three mature cell types. How taste cells die and/or exit the bud, as well as the role of the glial-like cells in this process, remains unclear. Here we present morphological data obtained through Serial Blockface Scanning Electron Microscopy of murine circumvallate taste buds, revealing taste cells at the end of their life. Cells we identify as dying share morphological features typical of apoptosis: swollen endoplasmic reticulum, large lysosomes, degrading organelles, distended outer nuclear membranes, heterochromatin reorganization, cell shrinkage, and cell and/or nuclear fragmentation. Most early stage dying cells have Type II cell morphologies, while a few display Type III cell features. Many dying cells maintain contacts with nerve fibers, but those postsynaptic fibers often appear to be detached from the main trunk of an afferent nerve. Dying cells, like mature Type II and III taste cells, are surrounded by glial-like Type I cells. In many instances Type I cells appear to be engulfing their dying neighbors, suggesting for them a novel, phagocytic role. Surprisingly, virtually no Type I cells display features of apoptosis, although they reportedly have the shortest residence time in taste buds. The ultimate fate of Type I cells therefore remains unknown.

Keywords: apoptosis; cell death; electron microscopy; engulfment; glial-like; synapse; taste buds.


Figures

Figure 1.
Figure 1.. Taste cell types and synapses in murine circumvallate taste buds.
A. Electron micrograph of a circumvallate mouse taste bud with overlaid individual reconstructions of a Type I cell (green), Type II cell (blue), Type III cell (red), and Type IV immature cell (purple). Scale bar is 10 μm. B. Micrograph of the channel synapse between a Type II cell (blue) and adjacent nerve fiber (yellow) bordered by a Type I cell (green). Arrows indicate the large, atypical mitochondria characteristic of Type II cell synapses. Scale bar is 1 μm for both B and C. C. Micrograph of the synapse between a Type III cell (red) and adjacent nerve fiber (yellow) bordered by a Type I cell (green). Arrow indicates the cluster of vesicles at the pre-synaptic membrane.
Figure 2.
Figure 2.. Morphological features of healthy and dying taste cells.
A. Reconstruction of a healthy, mature Type II cell (blue) in the taste bud shell (gray). Scale bar is 10 μm. B. Micrograph of a healthy Type II cell, with arrows indicating endoplasmic reticulum (ER). Scale bar is 2 μm and applies to B, C, E, and F. B’. Enlarged region of healthy Type II cytosol showing normal ER (arrows). Scale bar is 1 μm. C. Micrograph of a dying Type II cell, with arrows indicating examples of swollen endoplasmic reticulum. C’. Enlarged region of dying Type II cell cytosol, featuring swollen endoplasmic reticulum. Scale bar is 1 μm. D. Reconstruction of a dying cell of unknown type (purple) in the taste bud shell (gray). Scale is the same as in A. D’. Enlarged region of dying taste cell reconstruction in D. Arrow indicates the point of separation between the main dying cell and its apical fragment. E. Micrograph of healthy Type II cell, with an arrow indicating the only visible lysosome in this cell profile. F. Micrograph of a dying Type II cell, with arrows indicating some of the numerous lysosomes apparent in the cell cytosol. G. Micrograph depicting two healthy Type I cells (green, left) and a dying Type II cell (purple, right). Arrows indicate mitochondria in healthy cells (left 2) and those of the dying cell (right 4). Scale bar is 1 μm and applies to G, H, H’, I, and I’. H. Micrograph of healthy cell cytosol with arrows indicating Golgi bodies. H’. Enlarged region of cytosol including a healthy Golgi apparatus. I. Micrograph of a dying Type II cell with arrows indicating swollen Golgi bodies. I’. Enlarged region of the swollen Golgi apparatus of a dying cell.
Figure 3.
Figure 3.. Cell volumes of taste cells.
Graph depicts total cell volumes of healthy Type II and III cells (left), early dying Type II and III cells (middle, light gray), and late stage dying cells (right, dark gray).
Figure 4.
Figure 4.. Lysosomes in taste cells.
A. Reconstructions of selected taste cells (grey) and their lysosomes (color coded by size from small (blue) to large (red)). Reconstructions are divided into cell types: IV, III, II, I, early dying (ed), and late dying (ld). B. Lysosome count per cell (left) and lysosome median volume by cell (right). Each data point represents a single cell. Data is binned by cell type, as in A. C. Swarm charts of lysosome volumes of healthy Type II cells and early stage dying Type II cells showing the entire range of volumes (left) and a cropped view (right) of the volumes below 1μm3. Black squares indicate mean volume, while diamonds indicate median volume. D. Reconstructions of the lysosome meshes from healthy Type II cells (blue) and an early stage dying Type II cells (purple). Inset shows an enlarged view of the perinuclear area from a healthy and dying cell.
Figure 5.
Figure 5.. Morphological features of healthy and dying taste cell nuclei.
A. Reconstruction of healthy Type II cell nucleus (blue) with distended regions between inner and outer nuclear membranes reconstructed in gray. B. Micrograph of a healthy Type II cell nucleus (that reconstructed in A) (blue, left) and a nucleus of a dying Type II cell on the right (purple) showing distended regions between the inner and outer nuclear membrane. Scale bar is 2 μm, and applies to all micrographs in this figure. C. Reconstruction of the nucleus shown in B, showing in the inner nuclear region in purple, and the distended regions between the inner nuclear membrane in lighter purple. Of the dying cell nuclei, this is the only nucleus for which these distended regions were segmented and reconstructed. Thus, the reconstructions in E and G do not feature equivalent reconstructions of the distended nuclear membrane regions. D, D’. Reconstruction (D) and micrograph (D’) of healthy Type II cell nucleus. E, E’. Reconstruction (E) and micrograph (E’) of a fragmented nucleus of a dying cell of unknown type. Arrows indicate regions of heterochromatin expansion. F, F’. Reconstruction (F) and micrograph (F’) of a healthy Type III cell nucleus. G, G’. Reconstruction (G) and micrograph (G’) of the shrunken nucleus of a dying cell of unknown type. Arrows indicate regions of heterochromatin expansion.
Figure 6.
Figure 6.. Synapses in dying cells.
A. Micrograph of the point of contact between a late stage dying cell of unknown type (purple) and an adjacent nerve fiber (yellow). Asterisk indicates region of contact. Scale bar is 1 μm and applies to all micrographs in this figure. B. Synaptic sites between two nerve fibers (yellow-green and yellow) and a dying Type II cell (purple). Arrows indicate atypical mitochondria (red), which feature abnormal cristae patterns. C. Reconstruction of a dying Type II cell (purple) and the three nerve fibers that receive synapses from it in the taste bud shell (gray). Atypical mitochondria are red. Only the orange fiber exits the base of the taste bud. The green and pink fibers appear to be nerve fiber fragments. Scale bar 10 μm. D. Micrograph showing a region of contact between a dying Type III cell (purple) and the adjacent nerve fiber (yellow). E. Enlarged micrograph showing a different point of contact between the dying Type III cell (purple) and the nerve fiber (yellow) in D. Arrows indicate large, swollen structures (upper arrow) and typical synaptic vesicle structures (lower arrow) at the point of contact with the nerve fiber. F. Reconstruction of a dying Type III cell (purple) and the nerve fiber it borders. This nerve fiber is a fragment and does not exit the base of the bud.
Figure 7.
Figure 7.. Type I cells as they relate to dying cells.
A. Reconstruction of a late stage dying cell (purple) and the two Type I cells (green) that surround it. B. Micrograph of an early stage dying Type II cell (purple) and a neighboring Type I cell (green). Asterisk indicates a region of the dying cell nearly surrounded by the neighboring Type I cell, likely an area of phagocytosis. C. Micrograph of a late stage dying cell (purple) and the bordering Type I cell (green). Arrow indicates a presumed apoptotic body, which is completely surrounded by the Type I cell. D. Reconstruction of a late stage dying cell (purple) and the neighboring Type I cell (green). Lysosomes in the Type I cell are depicted in pink. D’. Rotated, enlarged view of the Type I cell partially surrounding the dying cell. D”. Enlarged region of D which highlights the lysosomes (pink) in the region of the Type I cell that borders the dying cell. D’”. Enlarged region of D which highlights the lysosomes (pink) in the region of the Type I cell that does not border the dying cell. E. Micrograph of a Type I cell (green) that borders an early dying cell (purple). Arrows indicate large, membrane enclosed profiles that the Type I cell may have engulfed from the dying cell. E’. Enlarged region of E which highlights the membrane continuity between the dying cell and one such profile that is perhaps in the process of being engulfed by the neighboring Type I cell.
Figure 8.
Figure 8.. Dying cells in the context of the bud.
A. Pie charts depicting the cell type composition of two taste buds: TF21 TB1 and TF21 TB2. These two taste buds are the only taste buds that are fully contained in the boundaries of the tissue block. B. Diagram depicting the locations of cell nuclei within the taste bud TF21 TB2 according to cell type. Immature Type IV cell nuclei (pink-purple) are on the left, followed by Type III cell nuclei (red), Type II cell nuclei (blue), Type I cell nuclei (green) and dying cell nuclei (dusty purple). One nucleus in the Type II cell panel is labeled as purple (asterisk), because the cell it inhabits is immature and we cannot discern whether it would have developed into a Type II or Type III cell. The taste bud and nuclei are shown in profile (top row) and from a top down view of the taste bud (bottom).
Figure 9.
Figure 9.. Pathway to death.
Reconstructions of cells summarizing the pathway from birth to death of a taste cell. From left to right: dividing basal cell, Type IV immature taste cell, Immature Type II or III taste cell, Type II mature taste cell, Type II early stage dying cell, Late stage dying cell of unknown type.

Similar articles

References

    1. Araque A., Parpura V., Sanzgiri R. P., & Haydon P. G. (1999). Tripartite synapses: glia, the unacknowledged partner. Trends Neurosci, 22(5), 208–215. - PubMed
    1. Barlow LA (2015). Progress and renewal in gustation: new insights into taste bud development. Development, 142(21), 3620–3629. - PMC - PubMed
    1. Bartel DL, Sullivan SL, Lavoie EG, Sevigny J, Finger TE. 2006. Nucleoside triphosphate diphosphohydrolase-2 is the ecto-ATPase of type I cells in taste buds. The Journal of comparative neurology 497: 1–12. - PMC - PubMed
    1. Beidler LM, Smallman RL (1965). Renewal of cells within taste buds. J Cell Biol, 27(2), 263–272. - PMC - PubMed
    1. Bouchier-Hayes L., & Green D. R. (2012). Caspase-2: The orphan caspase. Cell Death Differ, 19(1), 51–57. - PMC - PubMed

Publication types

LinkOut - more resources