[Preprint]. 2024 Sep 13:2024.09.08.611873.
doi: 10.1101/2024.09.08.611873.

Non-canonical IL-22 receptor signaling remodels the mucosal barrier during fungal immunosurveillance

Affiliations

Non-canonical IL-22 receptor signaling remodels the mucosal barrier during fungal immunosurveillance

Nicolas Millet et al. bioRxiv. .

Abstract

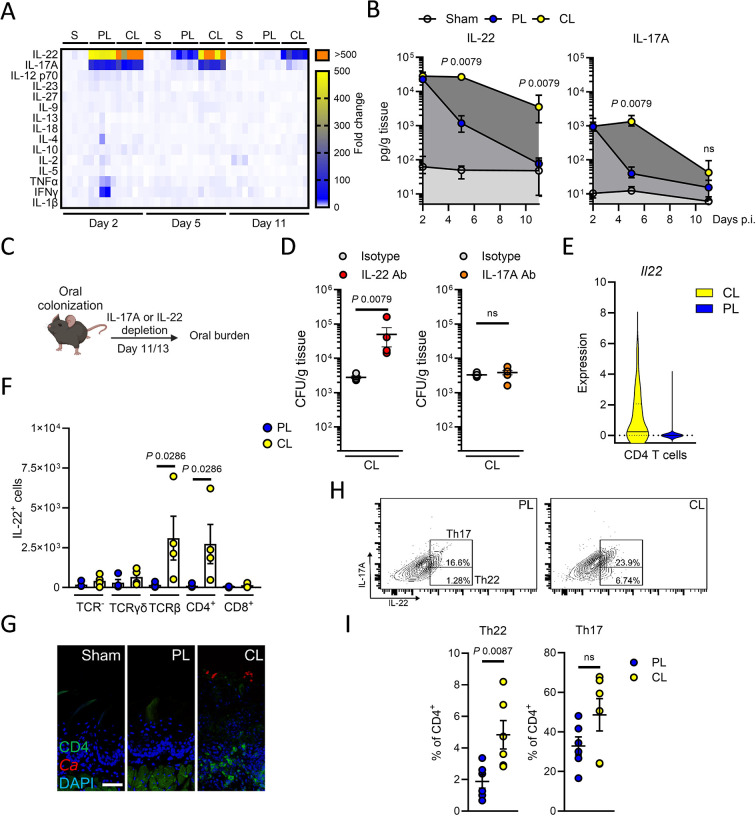
Mucosal barrier integrity is vital for homeostasis with commensal organisms while preventing pathogen invasion. We unexpectedly found that fungal-induced immunosurveillance enhances resistance to fungal outgrowth and tissue invasion by remodeling the oral mucosal epithelial barrier in mouse models of adult and neonatal Candida albicans colonization. Epithelial subset expansion and tissue remodeling were dependent on interleukin-22 (IL-22) and signal transducer and activator of transcription 3 (STAT3) signaling, through a non-canonical receptor complex composed of glycoprotein 130 (gp130) coupled with IL-22RA1 and IL-10RB. Immunosurveillance-induced epithelial remodeling was restricted to the oral mucosa, whereas barrier architecture was reset once fungal-specific immunity developed. Collectively, these findings identify fungal-induced transient mucosal remodeling as a critical determinant of resistance to mucosal fungal infection during early stages of microbial colonization.

Keywords: Candida albicans; IL-10RB; IL-22RA1; JAK; STAT3; TYK2; Th17; Th22; gp130; oral epithelium.


Conflict of interest statement

Competing interests The authors declare no competing interests.

Figures

Figure 1
Figure 1. Oral C. albicans colonization induces epithelial remodeling.
A Experimental setup for single cell collection and sequencing. B Cell types identified in the oral mucosa after 11 days of CL and PL infection with UMAP projections of scRNA-seq data. C Proportions of identified cell types separated by PL and CL infection. D Expression of Miki67, Cenpf, and Cenpa in epithelial cells of PL and CL infected mice. E Representative pictures of PAS staining of CL-infected mice over time. F Representative pictures of Ki67 staining of CL-infected mice over time. Scale bar 50μm. G Quantification of Ki67+ DAPI+ cells CL-infected mice over time. N = 3; Ordinary one-way ANOVA. H Experimental setup for sequencing of epithelial-enriched tissues. I GSEA of keratinocyte differentiation and keratinization sequencing data of epithelial-enriched tissues. N = 3–4. J Z-scores of keratin genes in epithelial-enriched tissues after PL and CL infection (Day 11). N = 3–4 K Representative pictures of K14 staining of PL- and CL-infected mice after 11 days. L Quantification of K14 thickness in Sham-, PL, and CL-infected mice after 11 days. N = 6; combined data of two independent experiments. Ordinary one-way ANOVA. M Quantification of K14 thickness in CL-infected mice over time. N = 5; combined data of two independent experiments. Ordinary one-way ANOVA. PL, pathogen-like; CL, commensal-like.
Figure 2
Figure 2. Th17/Th22 cells produce IL-22 during C. albicans colonization.
A Heat map presented in fold change of various cytokines during PL, CL, and Sham infection over time N = 10; combined data of two independent experiments. Two-tailed Mann–Whitney Test. B Levels of IL-17A and IL-22 in PL-, CL-, and Sham-infected mice; N = 10. Two-tailed Mann–Whitney Test. C Scheme of IL-17 and IL-22 depletion during CL-colonization. D Oral fungal burden of mice colonized with CL after treatment on day 11 and 13 with anti-IL-17A or anti-IL-22 antibodies. N = 6; combined data of two independent experiments. Two-tailed Mann–Whitney Test. The y-axis is set at the limit of detection (20 CFU/g tissue). E Expression of Il22 in CD4 T cells identified in the single cell RNA-sequencing data set. F Quantification of IL-22 expressing cells during CL colonization using IL22TdTomato reporter mice. N=4. Two-tailed Mann–Whitney Test. G Representative immunofluorescence pictures of localization of CD4 T cells in tissues after 11 days of infection. Scale bar 50μm. H Representative flow cytometry plots for intracellular IL-17A and IL-22 levels in CD4+ cells. I Levels of Th17 and Th22 cells after 11 days of infection. N = 6; combined data of two independent experiments. Two-tailed Mann–Whitney Test. PL, pathogen-like; CL, commensal-like.
Figure 3
Figure 3. Epithelial expansion requires non-classical IL-22 signaling
A Area under the curve (AUC) of oral epithelial cells in response to different concentrations of IL-22. Growth was determined by confluence over time. N=8. Ordinary one-way ANOVA. B Representative pictures of K14 staining of Sham- and CL-infected mice after 11 days. Scale bar 50μm. C Quantification of K14 thickness in Sham- and CL-infected WT and Il22−/− mice at day 11. N = 6; combined data of two independent experiments. Two-tailed Mann–Whitney Test. D Quantification of Ki67+ DAPI+ cells CL-infected mice over time. N = 6; combined data of two independent experiments. Two-tailed Mann–Whitney Test. E Oral fungal burden of WT and Il22−/− mice colonized with CL after 11 days. N = 8–9; combined data of two independent experiments. Two-tailed Mann–Whitney Test. The y-axis is set at the limit of detection (20 CFU/g tissue). F Oral fungal burden of indicated mice colonized with CL after 11 days. N = 7; combined data of two independent experiments. Brown-Forsythe and Welch ANOVA. The y-axis is set at the limit of detection (20 CFU/g tissue). G Quantification of K14 thickness in indicated mice at day 11. N = 6; combined data of two independent experiments. Ordinary one-way ANOVA. H (Left) Representative Images for proximity ligation assay (PLA) for indicated receptor complexes. Scale bar 50μm. Red dots indicate receptor complexes. (Right) Quantification of average number of complexes per cell. N = 5. I Representative immunoblot of STAT3 activation during IL-22 incubation in the presence of IL-22RA1, IL-10RB, or combination of IL-22RA1/IL-10RB blocking antibodies. J Area under the curve (AUC) of oral epithelial cells in response to IL-22 treatment in the presence of IL-22RA1, IL-10RB, or combination of IL-22RA1/IL-10RB blocking antibodies. Growth was determined by confluence over time. N = 8. Ordinary one-way ANOVA. K Area under the curve (AUC) of oral epithelial cells in response to IL-22 treatment in the presence of the gp130 inhibitor SC144 (igp130). Growth was determined by confluence over time. N = 8. Ordinary one-way ANOVA. L Representative immunoblot of STAT3 activation during IL-22 incubation in the presence of gp130 inhibitor, IL-22RA1, IL-10RB, or combination. M Oral fungal burden of mice treated with gp130 inhibitor (igp130) or vehicle control (Veh) colonized with CL after 11 days. N = 6; combined data of two independent experiments. Two-tailed Mann–Whitney Test. The y-axis is set at the limit of detection (20 CFU/g tissue). N Representative pictures of K14 staining of Veh- and igp130 treated mice after 11 days of CL infection. Scale bar 50μm O Quantification of K14 thickness in Veh- and igp130 treated mice after 11 days of CL infection. N = 6; combined data of two independent experiments. Two-tailed Mann–Whitney Test. P Quantification of Ki67+ DAPI+ cells CL-infected mice in the presence and absence of gp130 signaling. N = 6; Two-tailed Mann–Whitney Test. PL, pathogen-like; CL, commensal-like.
Figure 4
Figure 4. Transitory epithelial K14 expansion depends on Candida-specific immunity.
A Oral fungal burden of mice colonized with CL after indicated time points. N = 6; combined data of two independent experiments. Two-tailed Mann–Whitney Test. The y-axis is set at the limit of detection (20 CFU/g tissue). B Representative pictures of K14 staining of CL-infected mice after 11 and 31 days. Scale bar 50μm. C Quantification of K14 thickness in CL-infected mice at indicated time points. N = 6; combined data of two independent experiments. Two-tailed Mann–Whitney Test. D Determination of IL-17 secreting cells isolated from cervical lymph nodes mice and stimulated with Candida antigen pools for 24 hours using ELISpot. N=6. Ordinary one-way ANOVA. E Correlation of K14 thickness and Candida (Ca)- specific IL-17 secreting cells. N=6. Correlation was determined by Pearson. F Oral fungal burden of WT and Rag1−/− mice colonized with CL after 31 days. N=5; combined data of two independent experiments. Two-tailed Mann–Whitney Test. The y-axis is set at the limit of detection (20 CFU/g tissue). G Representative pictures of K14 staining of CL-infected mice after 31 days. Scale bar 50μm. H Quantification of K14 thickness in CL-infected mice after 31 days. N = 5; combined data of two independent experiments. Two-tailed Mann–Whitney Test. PL, pathogen-like; CL, commensal-like.
Figure 5
Figure 5. Epithelial remodeling prevents fungal invasion during neonatal colonization.
A Experimental setup for neonatal colonization of wild type mice. B Oral fungal burden of neonatal mice Sham-infected or colonized with CL after indicated time points. N = 4–6; combined data of two independent experiments. Two-tailed Mann–Whitney Test. The y-axis is set at the limit of detection (20 CFU/g tissue). C Representative pictures of K14 staining of Sham-infected or CL-infected mice at day 14 of life. Scale bar 50μm. D Quantification of K14 thickness in Sham-infected or CL-infected mice at day 14 of life. N = 5; combined data of two independent experiments. Two-tailed Mann–Whitney Test. E Oral fungal burden of neonatal WT and Il22−/− mice colonized with CL at day 14 of life. N = 6; combined data of two independent experiments. Two-tailed Mann–Whitney Test. The y-axis is set at the limit of detection (20 CFU/g tissue). F Representative pictures of K14 staining of WT and Il22−/− mice colonized with CL at day 14 of life. Scale bar 50μm. G Quantification of K14 thickness in neonatal WT and Il22−/− mice colonized with CL at day 14 of life. N = 5; combined data of two independent experiments. Two-tailed Mann–Whitney Test. H Quantification of Ki67+ DAPI+ cells in neonatal WT and Il22−/− mice colonized with CL at day 14 of life. N = 6; combined data of two independent experiments. Two-tailed Mann–Whitney Test. I Representative PAS staining of tongue tissues of neonatal (day 14 of life/day 12 of CL colonization) and adult (day 11 of CL colonization) WT and Il22−/− mice. Scale bar 50μm. J Quantification of depth of fungal invasion in neonatal WT and Il22−/− mice colonized with CL at day 14 of life and adult mice after 11 days of CL colonization. N = 8–12; combined data of four independent experiments. Two-tailed Mann–Whitney Test. PL, pathogen-like; CL, commensal-like.

References

    1. Moutsopoulos N. M., Konkel J. E., Trends Immunol 39, 276 (Apr, 2018). - PMC - PubMed
    1. Zheng D., Liwinski T., Elinav E., Cell Research 30, 492 (2020/06/01, 2020). - PMC - PubMed
    1. Gaffen S. L., Moutsopoulos N. M., Sci Immunol 5 (Jan 3, 2020). - PMC - PubMed
    1. Swidergall M., LeibundGut-Landmann S., Mucosal Immunol 15, 829 (May, 2022). - PMC - PubMed
    1. Mayer F. L., Wilson D., Hube B., Virulence 4, 119 (Feb 15, 2013). - PMC - PubMed

Publication types

LinkOut - more resources