[Preprint]. 2024 Sep 10:2024.09.09.612138.
doi: 10.1101/2024.09.09.612138.

Behavioral state and stimulus strength regulate the role of somatostatin interneurons in stabilizing network activity

Affiliations

Behavioral state and stimulus strength regulate the role of somatostatin interneurons in stabilizing network activity

Celine M Cammarata et al. bioRxiv. .

Update in

Abstract

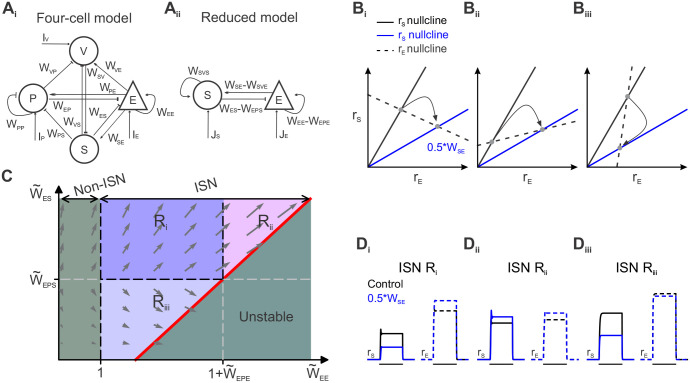
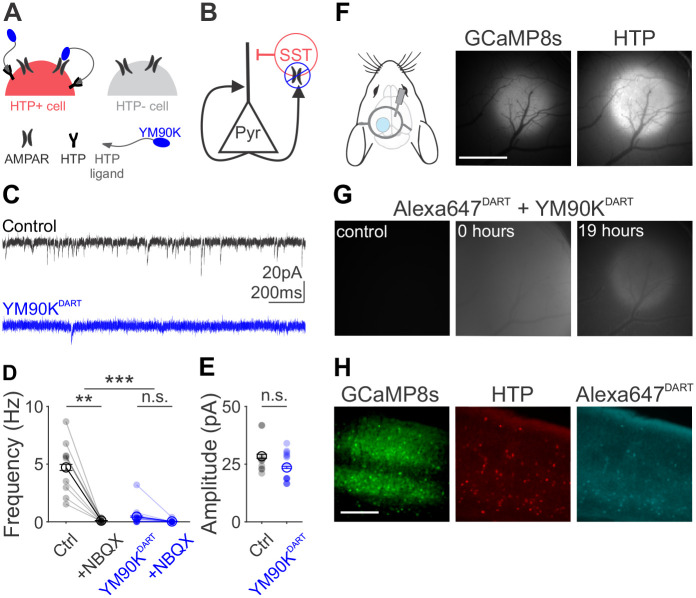
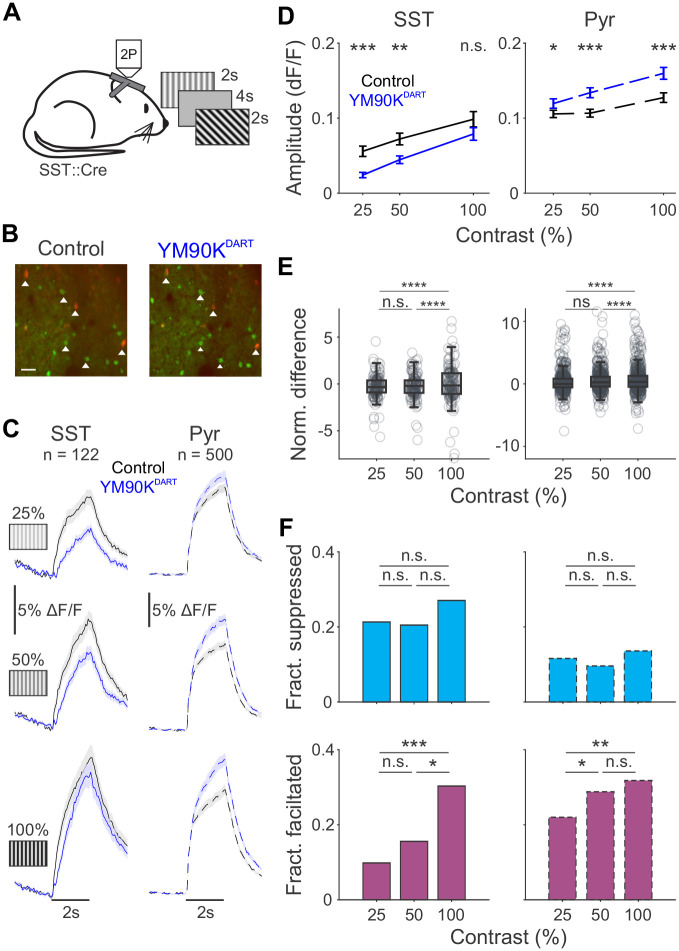
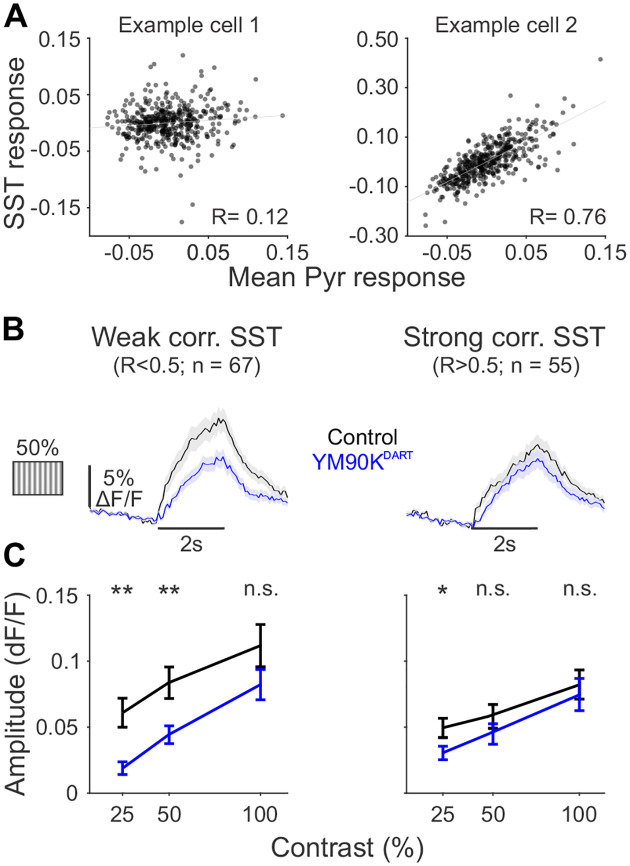
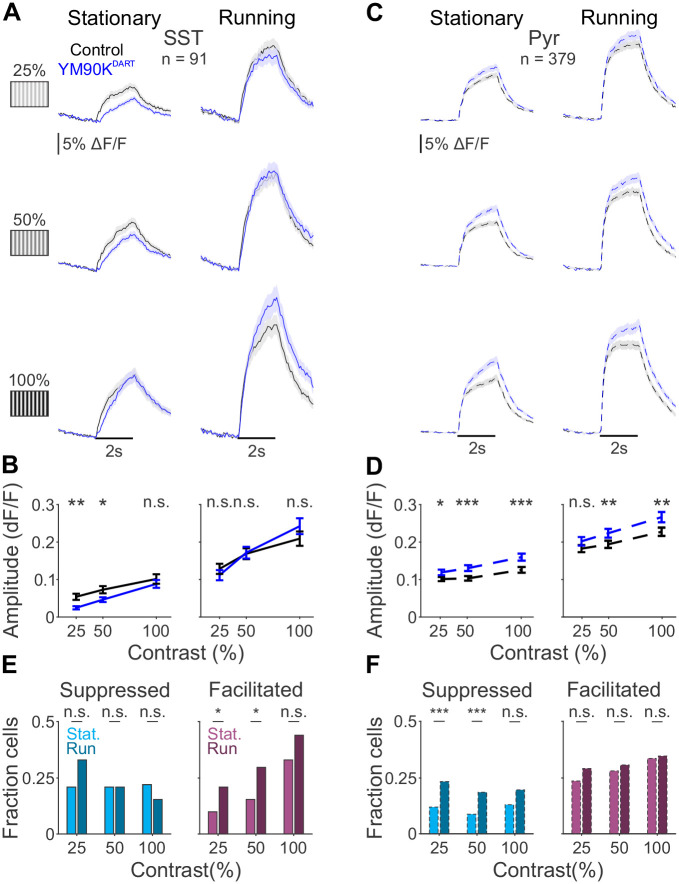
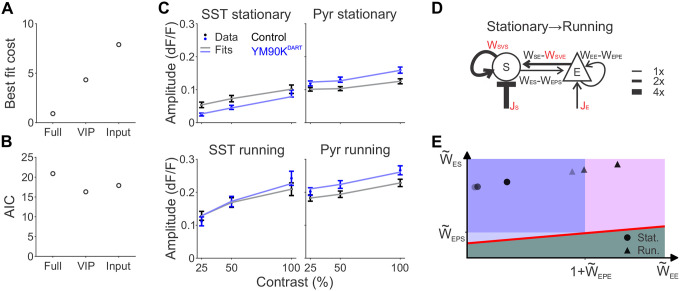
Inhibition stabilization enables cortical circuits to encode sensory signals across diverse contexts. Somatostatin-expressing (SST) interneurons are well-suited for this role through their strong recurrent connectivity with excitatory pyramidal cells. We developed a cortical circuit model predicting that SST cells become increasingly important for stabilization as sensory input strengthens. We tested this prediction in mouse primary visual cortex by manipulating excitatory input to SST cells, a key parameter for inhibition stabilization, with a novel cell-type specific pharmacological method to selectively block glutamatergic receptors on SST cells. Consistent with our model predictions, we find antagonizing glutamatergic receptors drives a paradoxical facilitation of SST cells with increasing stimulus contrast. In addition, we find even stronger engagement of SST-dependent stabilization when the mice are aroused. Thus, we reveal that the role of SST cells in cortical processing gradually switches as a function of both input strength and behavioral state.

Keywords: AMPA receptors; calcium imaging; chemogenetics; inhibition; microcircuit; normalization; pharmacology; visual cortex.


Conflict of interest statement

Declaration of Interests M.R.T. and B.C.S are on a patent application describing HTL.2 and its applications. The remaining authors declare no competing interests.

Figures

Figure 1.
Figure 1.. A theoretical framework for network stabilization by SST cells.
(A) Schematic of the four-cell (left) and reduced two-cell (right) model. (Bi-iii) Schematic of rE nullcline (dashed black), rS nullcline in control (solid black) and rS nullcline after a 50% reduction in WSE (blue) when the slope of the rE nullcline is negative (Bi), positive (Bii) and steeply positive (Biii). Arrows illustrate the shift in stability points (gray dots), and therefore the change in rE and rS after decrease in WSE. (C) Network stability in the space defined by W˜EE (effective recurrent excitation among E cells) and W˜ES (effective inhibition of S to E). Gray arrows illustrate how effective weights in W˜EE×W˜ES space change when stimulus intensity is increased. (Di-iii) Simulated activity of pyramidal (dashed lines) and SST cells (solid lines) in response to a visual stimulus (thick black line) in each region of the space defined in (C) and corresponding to the nullclines illustrated in (Bi-iii). See also Figure S1.
Figure 2.
Figure 2.. Cell-type specific antagonism of AMPA receptors.
(A) Schematic of cell-type specific pharmacology with YM90KDART. HTP: Halo-tag protein. (B) Schematic of circuit manipulation. (C) Spontaneous EPSCs (sEPSCs) in an example control SST cell (black) and an example SST cell incubated in YM90KDART (blue). Holding potential is −85 mV to isolate excitatory events. (D) Rate of sEPSCs in normal ACSF or NBQX (10 μM) for control (black) and YM90KDART (blue) cells. Light symbols represent individual cells; dark symbols represent the mean; lines connect individual cells. Error is SEM across cells. (E) Same as (D), for sEPSC amplitude in normal ACSF. (F) Schematic of cranial window and infusion cannula (left), and widefield imaging of the calcium indicator GCaMP8s (middle) and flex-dTomato-HTP (right). Scalebar = 1 mm. (G) Alexa647DART (1:10 with YM90KDART) capture before (left), immediately after (middle) and 19 hours after (right) infusion for mouse in (F). (H) Expression of GCaMP8s (left) and HTP (middle), and capture of Alexa647DART (right) in coronal sections for the same mouse as (F-G). Scalebar = 200 μm. n.s.- not significant; ** p < 0.01; *** p< 0.001. See also Figure S2.
Figure 3.
Figure 3.. The effect of blocking AMPARs on SST cells depends on stimulus strength.
(A) Schematic of experimental setup. (B) Example two-photon imaging field of view of GCaMP (green) and HTP (red) expression in control (left) and after YM90KDART infusion (right) for the same mouse as Figure 2F–H. White triangles highlight example cells identifiable across sessions. Scalebar = 200 μm. (C) Grand average time courses for HTP+ SST (left, solid lines) and HTP-putative pyramidal cells (right, dotted lines) before (black) and after (blue) YM90KDART infusion, in response to preferred-direction gratings (horizontal black bar) at three stimulus contrasts, during stationary epochs. Shaded error is SEM across cells. (D) Mean response during stimulus period, for SST cells (left) and pyramidal cells (right) before (black) and after (blue) YM90KDART infusion, at each contrast. Error is SEM across cells. (E) Normalized difference (meanDRATmeancontrolSTDcontrol) of stimulus response for SST (left) and pyramidal cells (right) as a function of contrast. Gray circles are individual cells; box plots illustrate median, 25% and 75% quartiles. Significance refers to pairwise F tests for variance. (F) Fraction of SST (left) and pyramidal (right) cells that are suppressed (top, cyan) or facilitated (bottom, magneta) by more than 1 std of their control response at each contrast. n.s.- not significant; * p < 0.05; ** p < 0.01; *** p< 0.001; **** p< 0.0001. See also Figure S3.
Figure 4.
Figure 4.. SST cells weakly correlated with the local network are more strongly suppressed by YM90KDART.
(A) Mean-subtracted trial-by-trial responses for two example SST cells and all concurrently recorded pyramidal cells. Each data point represents a single trial. Fit line is from a linear regression; R is the Pearson’s correlation. (B) Grand average time courses for SST cells before (black) and after (blue) YM90KDART separated into those weakly (left) and strongly (right) correlated to pyramidal activity, during stationary epochs in response to preferred-direction gratings at 50% contrast. Shaded error is SEM across cells. (C) Mean response during stimulus period, for SST cells weakly (left) or strongly (right) correlated to pyramidal activity, at each contrast in control (black) and after YM90KDART (blue). Error is SEM across cells. n.s.- not significant; * p < 0.05; ** p < 0.01. See also Figure S4.
Figure 5.
Figure 5.. The effect of blocking AMPARs on SST cells depends on behavioral state.
(A) Grand average time courses for SST cells before (black) and after (blue) YM90KDART during stationary (left) or running (right) epochs, at each contrast. All cells are matched across behavioral states and contrasts. Shaded error represents SEM across cells. (B) Mean response during stimulus period, for SST cells during stationary (left) or running (right) epochs, at each contrast. Error is SEM across cells. (C-D) Same as (A-B), for pyramidal cells. (E) Fraction of SST cells suppressed (left, cyan) or facilitated (right, magenta) by more than 1 std of their control response during stationary (light) or running (dark) epochs. (F) Same as E, for pyramidal cells. n.s.- not significant; * p < 0.05; ** p < 0.01; *** p< 0.001. See also Figure S5.
Figure 6.
Figure 6.. Paradoxical effects indicate the necessity of SST cells for network stabilization.
(A) Cost of the best fit for each of the three models. (B) Akaike information criterion (AIC) values for each of the three models. (C) Empirical (dark data points, mean +/− SEM from Figure 5B,D) and simulated (light lines) responses of SST (left) and pyramidal (right) cells to increasing contrast, in stationary (top) or locomotion (bottom) states in control (gray) and after YM90KDART (light blue). (D) Schematic of changes to weights to fit changes from stationary to running. Line thickness is proportional to weight change. (E) Position of model best fit parameters at each contrast (shading) and behavioral state (circles = stationary, triangles = running) in the phase space from Figure 1. Instability line (red) corresponds to the high contrast, running condition. See also Figure S6.

Similar articles

References

    1. Heeger D.J. (1992). Normalization of cell responses in cat striate cortex. Vis. Neurosci. 9, 181–197. - PubMed
    1. Carandini M., and Heeger D.J. (2011). Normalization as a canonical neural computation. Nat. Rev. Neurosci. 13, 51–62. - PMC - PubMed
    1. Carandini M., Heeger D.J., and Movshon J.A. (1997). Linearity and normalization in simple cells of the macaque primary visual cortex. J. Neurosci. 17, 8621–8644. - PMC - PubMed
    1. Litwin-Kumar A., Rosenbaum R., and Doiron B. (2016). Inhibitory stabilization and visual coding in cortical circuits with multiple interneuron subtypes. J. Neurophysiol. 115, 1399–1409. - PMC - PubMed
    1. Palmigiano A., Fumarola F., Mossing D.P., Kraynyukova N., Adesnik H., and Miller K.D. (2023). Common rules underlying optogenetic and behavioral modulation of responses in multi-cell-type V1 circuits. bioRxiv, 2020.11.11.378729. 10.1101/2020.11.11.378729. - DOI

Publication types

LinkOut - more resources