[Preprint]. 2024 Sep 9:2024.09.09.611047.
doi: 10.1101/2024.09.09.611047.

NR2F2 Reactivation in Early-life Adipocyte Stem-like Cells Rescues Adipocyte Mitochondrial Oxidation

Affiliations

NR2F2 Reactivation in Early-life Adipocyte Stem-like Cells Rescues Adipocyte Mitochondrial Oxidation

Snehasis Das et al. bioRxiv. .

Abstract

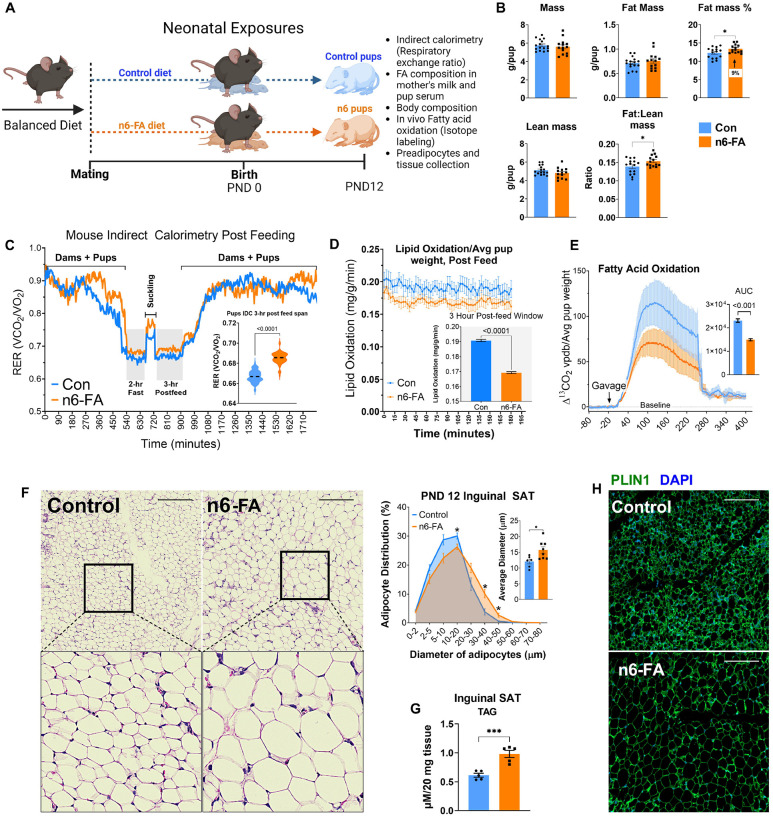
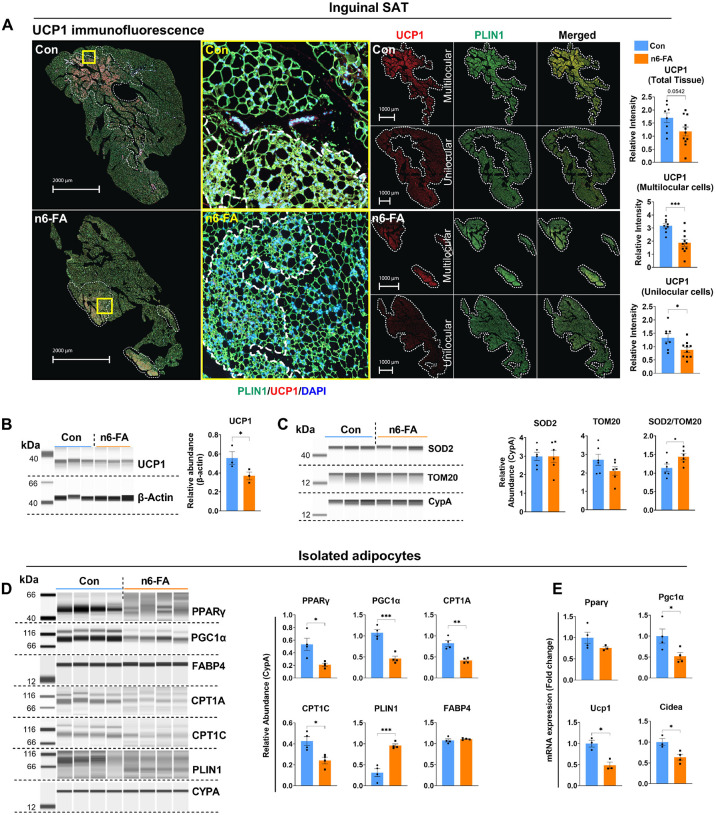
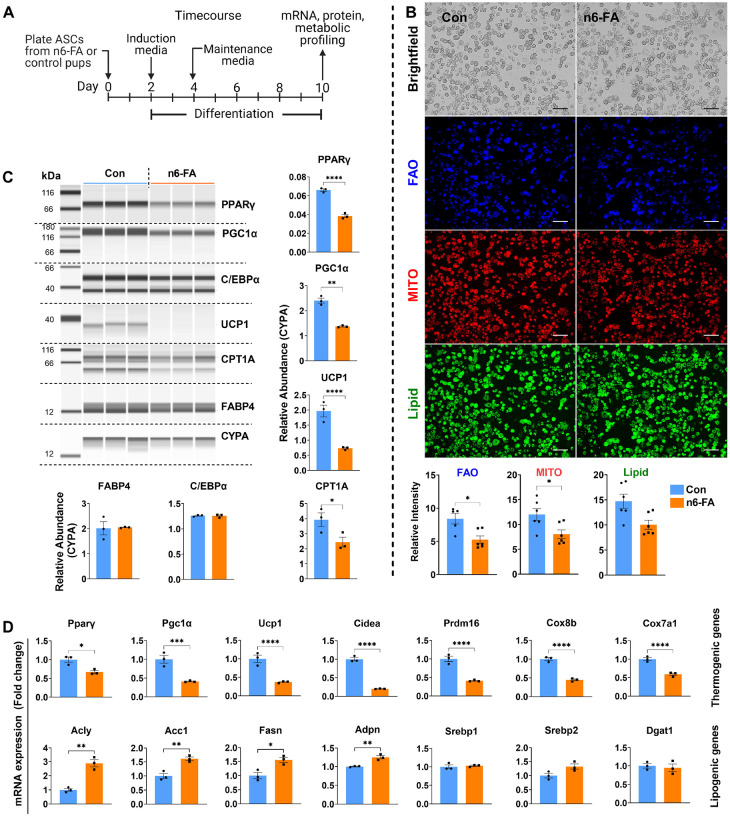
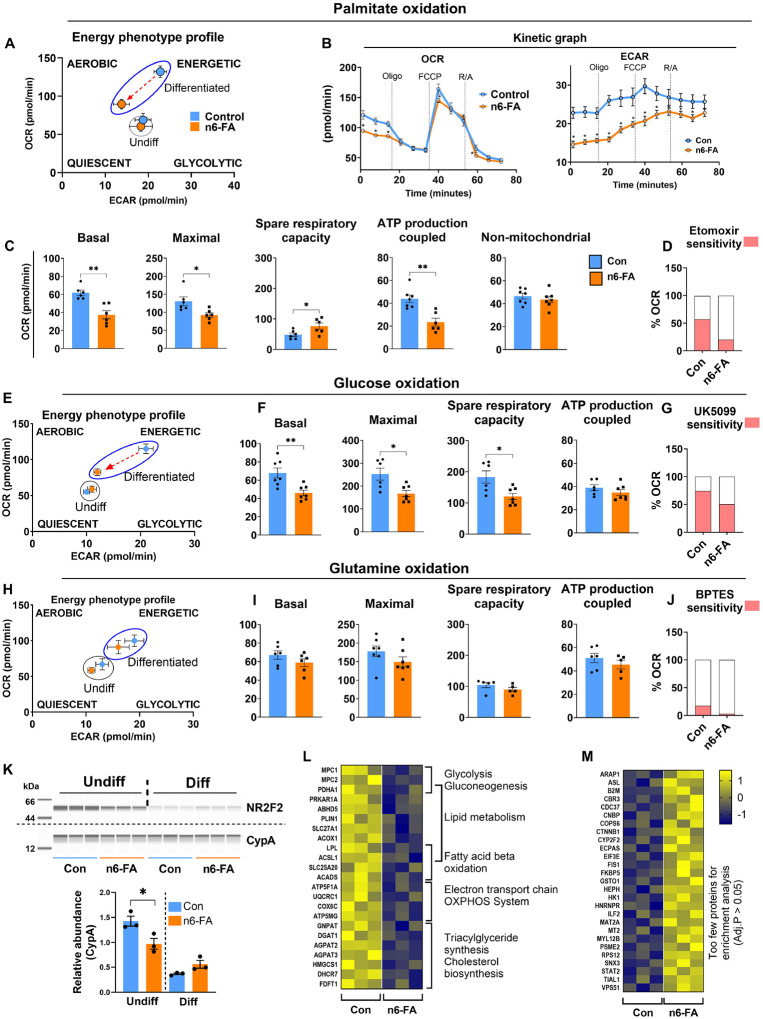
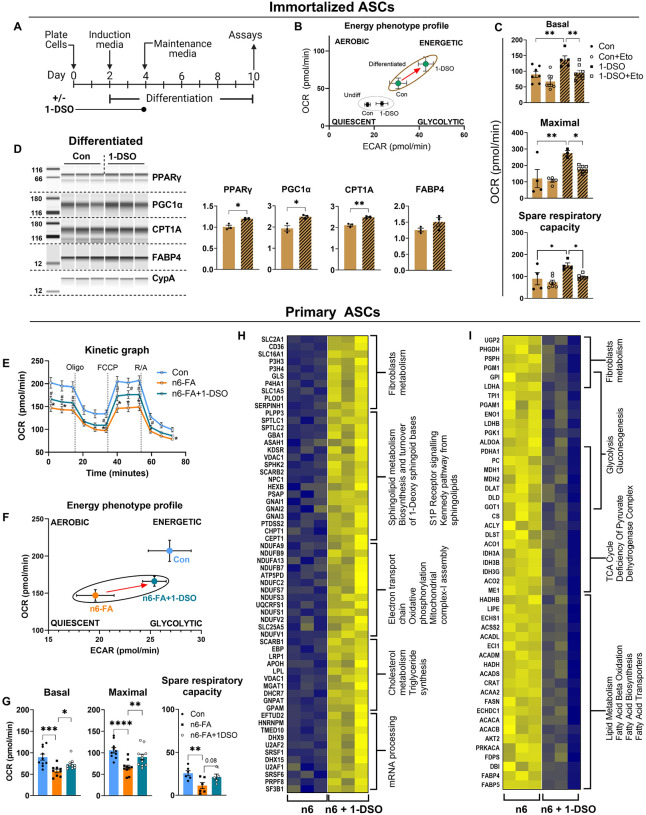
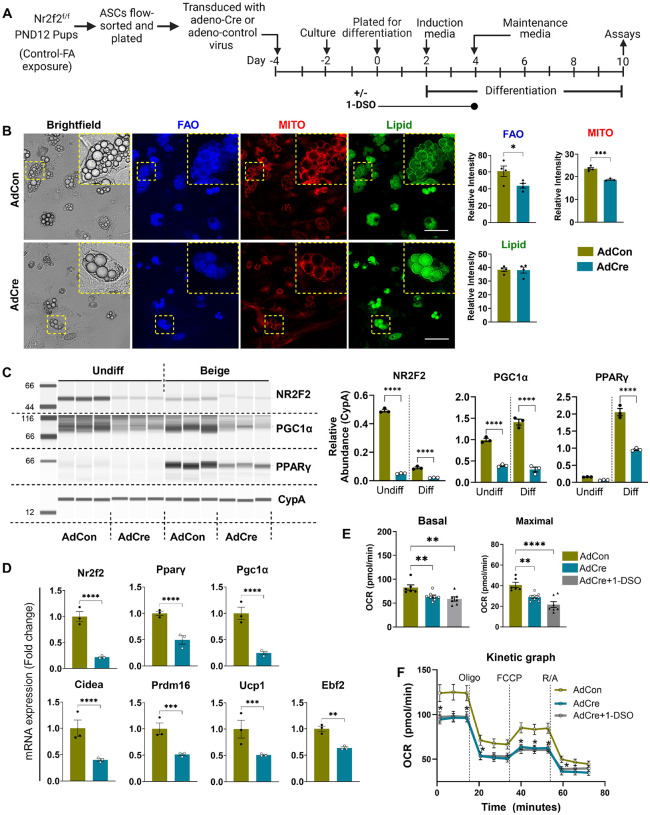
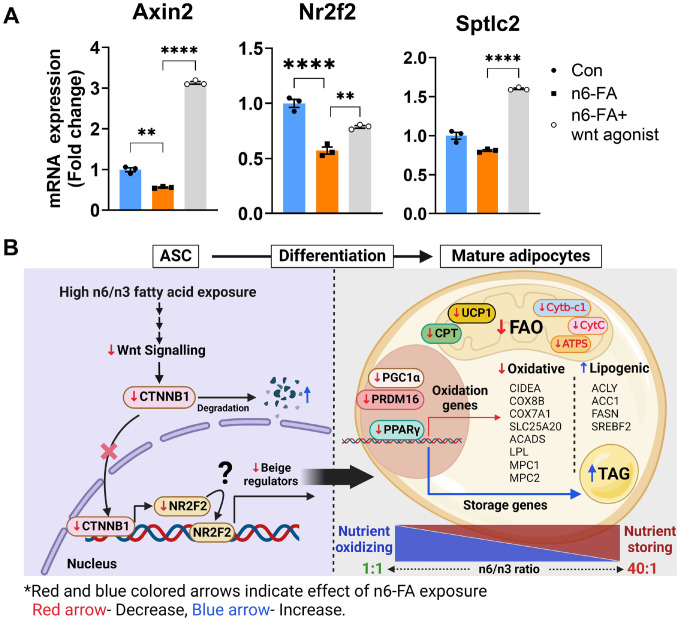
In humans, perinatal exposure to an elevated omega-6 (n6) relative to omega-3 (n3) Fatty Acid (FA) ratio is associated with the likelihood of childhood obesity. In mice, we show perinatal exposure to excessive n6-FA programs neonatal Adipocyte Stem-like cells (ASCs) to differentiate into adipocytes with lower mitochondrial nutrient oxidation and a propensity for nutrient storage. Omega-6 FA exposure reduced fatty acid oxidation (FAO) capacity, coinciding with impaired induction of beige adipocyte regulatory factors PPARγ, PGC1α, PRDM16, and UCP1. ASCs from n6-FA exposed pups formed adipocytes with increased lipogenic genes in vitro, consistent with an in vivo accelerated adipocyte hypertrophy, greater triacylglyceride accumulation, and increased % body fat. Conversely, n6-FA exposed pups had impaired whole animal 13C-palmitate oxidation. The metabolic nuclear receptor, NR2F2, was suppressed in ASCs by excess n6-FA intake preceding adipogenesis. ASC deletion of NR2F2, prior to adipogenesis, mimicked the reduced FAO capacity observed in ASCs from n6-FA exposed pups, suggesting that NR2F2 is required in ASCs for robust beige regulator expression and downstream nutrient oxidation in adipocytes. Transiently re-activating NR2F2 with ligand prior to differentiation in ASCs from n6-FA exposed pups, restored their FAO capacity as adipocytes by increasing the PPARγ-PGC1α axis, mitochondrial FA transporter CPT1A, ATP5 family synthases, and NDUF family Complex I proteins. Our findings suggest that excessive n6-FA exposure early in life dampens an NR2F2-mediated induction of beige adipocyte regulators, resulting in metabolic programming that is shifted towards nutrient storage.

Keywords: NR2F2; adipocyte stem-like cells; beige adipocyte metabolism; early-life adipocyte development; omega-3 fatty acids.


Conflict of interest statement

Competing Interests The authors declare no competing interests.

Figures

Figure 1.
Figure 1.. High n6 exposure alters fat mass percentage, RER, and adipocyte cellularity.
(A) Diagram of experimental design. (B) Body composition of control and high n6-FA exposed pups at Postnatal day 12 (PND12). Each data point is the mean mass, lean body mass, fat mass, ratio of fat to lean mass, or fat mass percentage of one litter of pups at PND12 (n=13–15 litters). (C) Indirect calorimetry of control and high n6-exposed litters. Dams were removed for the 2h pre- and 3h post-nursing periods to measure the Respiratory Exchange Ratio (VCO2/VO2: Scale 0.5–1.0) of pups in a litter. Data are presented as means ± SEM (n=7–9). (D) Fatty acid oxidation (FAO) calculated using the equation (1.70 × VO2 – 1.69 × VCO2) (n=7–9). (E) Pups were administered 13C16-palmitate (100 mg/kg body weight) and the litters placed into cages in an Indirect Calorimeter cabinet held at 25°C to quantify 13CO2 stable isotope gas exchange as a measure of whole-body FAO (n=3 per group). (F) H&E staining of control and n6-FA exposed pup SAT (inguinal fat) and quantification of cellularity (n=7–8). Scale bar is 100 μm. (G) Quantification of SAT triglyceride (TAG) levels (n=5). (H) Immunofluorescence staining of inguinal adipose tissue with anti-PLIN1 antibody (green) and DAPI (blue) (n=5 neonatal inguinal SAT sections from independent litters per control/n6-FA group). The scale bar is 100 μm. Data are expressed as mean ± SEM, statistical significance is denoted by *p < 0.05, **p < 0.01, ***p < 0.001, ****p < 0.0001 by t-test.
Figure 2.
Figure 2.. Expression of beige adipocyte proteins in SAT and adipocytes.
(A) Immunofluorescence staining of inguinal SAT from PND12 mice with anti-UCP1 (red) and anti-PLIN1 (green) antibodies. Nuclei (blue) were stained with DAPI. Morphologically defined white and beige regions were quantified separately for UCP1 staining, which was significantly decreased in n6-FA group (n=8–11 neonatal SAT section from independent litters per control/n6 group). (B, C) Analysis of UCP1, SOD2, and TOM20 in inguinal fat pads through Western blotting. CypA was used as the reference protein to normalize loading (n=3–6 neonatal SAT tissue from independent litters per control/n6-FA group). (D, E) Levels of key adipocyte proteins and mRNA were measured through Western blotting and qPCR in mature adipocytes isolated from inguinal fat from control and n6-FA pups. (n=3–4 pooled adipocytes from neonatal SAT tissue from independent litters per control/n6-FA group). Data are expressed as mean ± SEM, statistical significance is denoted by *p < 0.05, **p < 0.01, ***p < 0.001, ****p < 0.0001 by t-test.
Figure 3.
Figure 3.. High n6-FA exposure reduces expression of beige markers while upregulating lipogenic markers in adipocytes generated from them.
(A) Experimental design. (B) Differentiated beige adipocytes were stained with LipidSpot (green; lipid droplets), TMRE (red; mitochondria), and FAOBlue (blue; fatty acid oxidation). n=3 wells containing ASCs isolated from inguinal SAT from independent litters per control/n6-FA group. Intensity of LipidSpot, TMRE, and FAOBlue staining was quantified using image J software (n=6. Two images per well). Scale bar 100 μM. (C, D) Protein levels and mRNA expression in differentiated adipocytes were quantified through semiquantitative Western blots and qPCR (n=3 wells containing ASCs isolated from inguinal SAT from independent litters per control/n6-FA group). Data are expressed as mean ± SEM, statistical significance is denoted by *p < 0.05, **p < 0.01, ***p < 0.001, ****p < 0.0001 by one-way ANOVA and Tukey’s correction.
Figure 4.
Figure 4.. High n6-FA exposure in ASCs inhibits fatty acid oxidation in adipocytes.
ASCs were isolated from control and n6-FA exposed pups, plated, and differentiated to beige adipocytes, which were used for metabolic assays in Fig A-J (n=5–7 ASC pools from independent litters per control/n6-FA group). (A) Energy map of control and high n6-FA exposed adipocytes when palmitate was supplied as fuel. (B) Kinetic graphs for oxygen consumption rate (OCR) and extracellular acidification rate (ECAR). (C) OCR for basal, maximal, ATP production-coupled respiration, and spare respiratory capacity in differentiated adipocytes. (D) Sensitivity to Etomoxir during maximal respiration (E, F) Energy map, OCR for basal, maximal, ATP production-coupled respiration, and spare respiratory capacity when glucose was supplied as fuel source. (G) Sensitivity to UK5099 during maximal respiration (H, I) Energy map, OCR for basal, maximal, ATP production-coupled respiration, and spare respiratory capacity when glutamine was supplied as fuel source. (J) Sensitivity to BPTES during maximal respiration (K) Analysis of NR2F2 protein levels in undifferentiated and differentiated beige adipocytes derived from flow-sorted ASCs from control and n6-FA pups through. (L, M) Proteomics data from differentiated beige adipocytes derived from control and n6-FA primary ASCs, followed by pathway enrichment analyses. (n=3 wells containing differentiated ASCs isolated from inguinal SAT from independent litters per control/n6-FA group for all the experiments; K-M). Data are expressed as mean ± SEM, statistical significance is denoted by *p < 0.05, **p < 0.01, ***p < 0.001, ****p < 0.0001 by multiple comparison t-test for B, one-way ANOVA for F, I, K, and t-test for the rest.
Figure 5.
Figure 5.. Transient NR2F2 activation in n6-FA ASCs improves fatty acid oxidation and alters mitochondrial proteins in adipocytes.
(A) Experimental design. Immortalized adipocyte precursor cells (APCs) were differentiated to beige adipocytes ± a 4-day pulse treatment with 1-DSO in the early phase of differentiation, as shown in the schematic. Following differentiation, cells were assayed for metabolic activity and protein abundance (n=3–7 wells containing immortalized ASCs for Con and 1-DSO; Fig A-D). (B, C) Energy map, basal, maximal respiration and spare respiratory capacity in control and 1-DSO treated beige adipocytes when palmitate was used as the fuel source. (D) Treatment with NR2F2 ligand 1-DSO increased expression of beige markers in beige adipocytes differentiated from APCs evaluated through Western blotting. (E-G) OCR kinetic graph, energy map, basal, maximal respiration and spare respiratory capacity in beige differentiated ASCs (± 1-DSO during differentiation as in panel A) isolated from control and n6-FA pups, when palmitate was supplied as fuel source (n=5–11 wells per group). (H, I) Proteomics data from beige differentiated ASCs (± 1-DSO during differentiation as in panel A) isolated from n6-FA pups, followed by pathway enrichment analyses, showing important metabolic pathways were altered significantly between groups (n=3 wells per group). Data are expressed as mean ± SEM, statistical significance is denoted by *p < 0.05, **p < 0.01, ***p < 0.001, ****p < 0.0001 by one-way ANOVA for C, G, multiple comparison t-test for E and t-test for the rest.
Figure 6.
Figure 6.. Ablation of NR2F2 in vitro suppresses expression of beige proteins following differentiation.
(A) Diagram of experimental design. ASCs were isolated from Nr2f2f/f pups, plated, treated with Adeno-Cre (AdCre) or control adenovirus (AdCon) to ablate NR2F2, followed by differentiation into beige adipocytes. Following differentiation, cells were assayed for adipogenic markers. (B) Differentiated adipocytes were stained with LipidSpot (green; lipid droplets), TMRE (red; mitochondria), and FAOBlue (blue; fatty acid oxidation) and quantified in Image J (n=4 wells containing ASCs isolated from inguinal SAT from independent litters). (C, D) Protein and mRNA levels of NR2F2 and other key regulators were quantified in ASCs ± in vitro ablation of NR2F2 through Western blotting and qPCR (n=3 wells per group). (E, F) Basal, maximal respiration, and OCR (kinetic graph) of beige differentiated ASCs (n=6–8 wells per group). Data are expressed as mean ± SEM, statistical significance is denoted by *p < 0.05, **p < 0.01 by t-test for B and one-way ANOVA for the rest.
Figure 7.
Figure 7.
(A) mRNA expression of Nr2f2, Axin2, and Sptlc2 in ASCs ± Wnt agonist 1(48h) quantified through qPCR (n=3 wells per group). (B) Model showing effects of excess n6-FA exposure on ASCs and how that affects adipocyte metabolism. ASCs exposed to n6-FA ratio have a diminished WNT mediated activation of CTNNb1 gene signature, leading to poor induction of NR2F2 and lower expression of beige regulators PPARγ, PGC1α, Cidea, and Prdm16. These ASCs differentiate, give rise to mature adipocytes with diminished electron transport chain and oxidative phosphorylation protein components, blunted nutrient oxidation, while retaining an enhanced capacity for triacylglyceride accumulation. Data are expressed as mean ± SEM, statistical significance is denoted by *p < 0.05, **p < 0.01, ***p < 0.001, ****p < 0.0001 by one-way ANOVA.

Similar articles

References

    1. Lister N.B., Baur L.A., Felix J.F., Hill A.J., Marcus C., Reinehr T., Summerbell C., and Wabitsch M. (2023). Child and adolescent obesity. Nat Rev Dis Primers 9, 24. 10.1038/s41572-023-00435-4. - DOI - PubMed
    1. Ward Z.J., Long M.W., Resch S.C., Giles C.M., Cradock A.L., and Gortmaker S.L. (2017). Simulation of Growth Trajectories of Childhood Obesity into Adulthood. N Engl J Med 377, 2145–2153. 10.1056/NEJMoa1703860. - DOI - PMC - PubMed
    1. Heymsfield S.B., and Wadden T.A. (2017). Mechanisms, Pathophysiology, and Management of Obesity. N Engl J Med 376, 1492. 10.1056/NEJMc1701944. - DOI - PubMed
    1. O’Connor E.A., Evans C.V., Burda B.U., Walsh E.S., Eder M., and Lozano P. (2017). Screening for Obesity and Intervention for Weight Management in Children and Adolescents: Evidence Report and Systematic Review for the US Preventive Services Task Force. JAMA 317, 2427–2444. 10.1001/jama.2017.0332. - DOI - PubMed
    1. Rankin J., Matthews L., Cobley S., Han A., Sanders R., Wiltshire H.D., and Baker J.S. (2016). Psychological consequences of childhood obesity: psychiatric comorbidity and prevention. Adolesc Health Med Ther 7, 125–146. 10.2147/AHMT.S101631. - DOI - PMC - PubMed

Publication types

LinkOut - more resources